


Indian Rupee draws support from consistent RBI intervention, lower oil prices
- The Indian Rupee trades flat around 96.00 against the US Dollar on Wednesday.
- Consistent RBI intervention and lower oil prices lend support to the Indian currency.
- Receding hopes of US-Iran diplomacy could stage a recovery for oil prices.
The Indian Rupee (INR) opens flat against the US Dollar (USD) on Wednesday, with the USD/INR pair wobbling near 96.00. The Indian currency has drawn temporary support from consistent Reserve Bank of India’s (RBI) intervention through spot and Non-Deliverable Forwards (NDFs) markets and a drop in oil prices.
In the opening session, the MCX Crude Oil contract expiring on October 19 is down 0.45% to near Rs. 8,635.
Currencies from economies, such as India, which rely heavily on oil imports to meet their energy needs, gets some relief when oil prices start correcting.
Oil prices drop amid an increase in flows from Saudi Arabia
Analysts at Deutsche Bank note that the earlier surge in Brent was tempered after “Saudi Arabia has restored about half the flows through its East-West pipeline.” Goldman Sachs also said in a note that it estimates Persian Gulf oil exports, including dark exports, to have recovered to their 2025 average after doubling in September.
However, experts also question the correction in oil prices and warn of upside risks even beyond 2026, citing dashed hopes of near-term United States (US)-Iran diplomacy.
Deutsche Bank argues that persistent “scepticism about the Strait of Hormuz reopening any time soon has led investors to price a longer period of high prices into next year.”
Meanwhile, a report from Axios has shown that efforts this week by Qatari mediators to broker a diplomatic breakthrough between the US and Iran have made little progress, with neither side willing to budge. Such a scenario could allow oil prices to resume their upside.
US PCE Inflation data awaited
Later in the day, investors will pay close attention to the US Personal Consumption Expenditures (PCE) Price Index data for August, which will be published at 12:30 GMT. The core PCE inflation, which is the Federal Reserve’s (Fed) preferred inflation gauge, is expected to have remained steady at 3.3% Year-on-Year (YoY), with monthly figures growing at a faster pace of 0.3% against the previous reading of 0.2%.
The data is expected to have a significant influence on Fed’s interest rate expectations. Currently, financial markets are confident that the Fed will continue its monetary tightening cycle to contain high inflation risks due to energy supply bottlenecks and strong Artificial Intelligence (AI)-led demand.
The Fed started the interest rate hike cycle in the September policy meeting where it raised key rates by 25 basis points (bps) to the 3.75%-4.00% range.
Analysts at MUFG/BTMU highlight that, after delivering its first hike this month, the US rate market now expects the Fed to deliver "almost another 100bps of rate hikes in the year ahead."
This week, the major trigger for Fed’s interest rate projections will be the Nonfarm Payrolls (NFP) data for September, which will be released on Friday.
USD/INR Technical Analysis
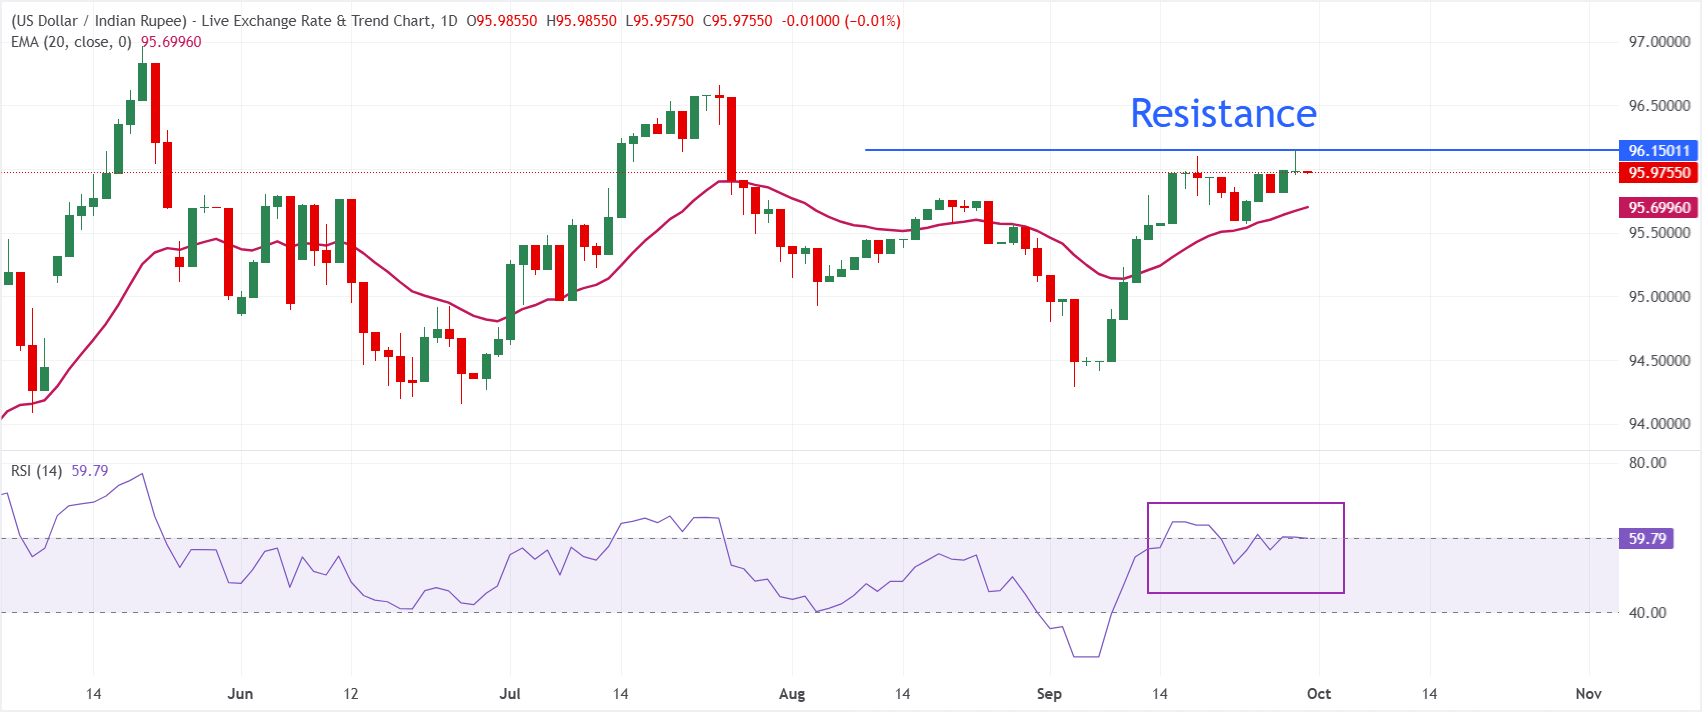
In the daily chart, USD/INR trades at 95.9755, holding above the 20-period exponential moving average (EMA) at 95.6996, which underpins a mildly bullish near-term bias. The pair has been grinding higher over recent sessions, and the Relative Strength Index (RSI) at 59.8 stays in positive territory without yet signaling overbought conditions, suggesting room for the uptrend to extend while dips remain supported by the nearby EMA.
On the downside, initial support is located at the 20-period EMA around 95.70, where buyers are likely to defend the prevailing uptrend on any pullback. With no clear technical resistance levels immediately overhead in this dataset, price action could continue to probe higher until a new structural barrier forms, while a daily close below the 20-period EMA would hint at waning bullish momentum and a deeper corrective phase.
(The technical analysis of this story was written with the help of an AI tool. Know more.)
Indian Rupee FAQs
The Indian Rupee (INR) is one of the most sensitive currencies to external factors. The price of Crude Oil (the country is highly dependent on imported Oil), the value of the US Dollar – most trade is conducted in USD – and the level of foreign investment, are all influential. Direct intervention by the Reserve Bank of India (RBI) in FX markets to keep the exchange rate stable, as well as the level of interest rates set by the RBI, are further major influencing factors on the Rupee.
The Reserve Bank of India (RBI) actively intervenes in forex markets to maintain a stable exchange rate, to help facilitate trade. In addition, the RBI tries to maintain the inflation rate at its 4% target by adjusting interest rates. Higher interest rates usually strengthen the Rupee. This is due to the role of the ‘carry trade’ in which investors borrow in countries with lower interest rates so as to place their money in countries’ offering relatively higher interest rates and profit from the difference.
Macroeconomic factors that influence the value of the Rupee include inflation, interest rates, the economic growth rate (GDP), the balance of trade, and inflows from foreign investment. A higher growth rate can lead to more overseas investment, pushing up demand for the Rupee. A less negative balance of trade will eventually lead to a stronger Rupee. Higher interest rates, especially real rates (interest rates less inflation) are also positive for the Rupee. A risk-on environment can lead to greater inflows of Foreign Direct and Indirect Investment (FDI and FII), which also benefit the Rupee.
Higher inflation, particularly, if it is comparatively higher than India’s peers, is generally negative for the currency as it reflects devaluation through oversupply. Inflation also increases the cost of exports, leading to more Rupees being sold to purchase foreign imports, which is Rupee-negative. At the same time, higher inflation usually leads to the Reserve Bank of India (RBI) raising interest rates and this can be positive for the Rupee, due to increased demand from international investors. The opposite effect is true of lower inflation.
Artigos Recomendados


