

USD/CAD Price Analysis: Stays on sidelines above 1.3700
- USD/CAD grinds between firm US Dollar and recovery in the Oil price.
- Oil recovers on sharp drawdown in US oil stockpiles.
- The Canadian Dollar will be guided by the Employment data for April.
The USD/CAD pair consolidates in a tight range above the round-level support of 1.3700 in Thursday’s European session after correcting from its weekly high of 1.3760. The Loonie asset struggles for direction as the firm US Dollar keeps the downside supported, while strength in the Canadian Dollar due to a sharp recovery in the Oil price restricts the upside.
The US Dollar Index (DXY), which tracks the US Dollar’s value against six major currencies, rises to 105.60. The appeal for the US Dollar improves as Federal Reserve (Fed) policymakers see interest rates remaining unchanged at their current levels for a longer period due to a surprise rise in inflation readings in the last few months.
Meanwhile, sharp Oil price recovery due to a larger-than-expected drawdown in the US oil inventory for the week ending May 3 has boosted demand for the Canadian Dollar. It is worth noting that Canada is the leading exporter of Oil to the United States and higher Oil prices support the Canadian Dollar.
Going forward, investors will focus on the Canada’s Employment data for April, which will be announced on Friday. The Canadian job market is estimated to have expanded by fresh 20K payrolls against a drawdown of 2.2K. The Unemployment Rate is anticipated to have risen to 6.2% from 6.1%. The labor market data will significantly influence the Bank of Canada’s (BoC) interest rate outlook.
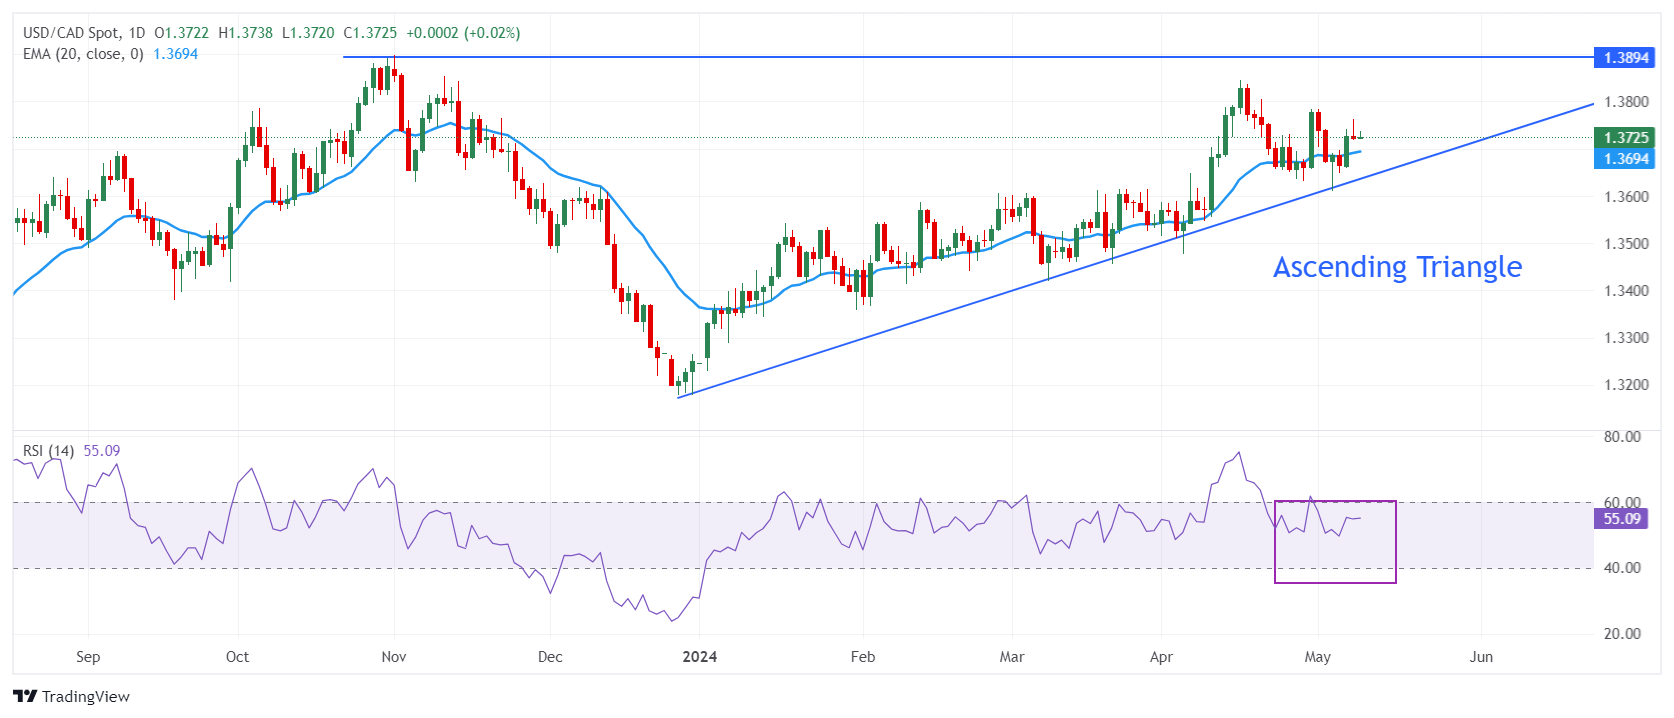
USD/CAD recovers strongly after discovering buying interest near the upward-sloping border of the Ascending Triangle formation on a daily timeframe, which is plotted from December 27 low at 1.3178. The horizontal resistance of the above-mentioned chart pattern is placed from November 1 high around 1.3900.
The 20-day Exponential Moving Average (EMA) near 1.3700 continues to provide support to the US Dollar bulls.
The 14-period Relative Strength Index (RSI) oscillates in the 40.00-60.00 range, suggesting indecisiveness among investors.
Fresh buying opportunity would emerge if the asset breaks above April 30 high at 1.3785. This would drive the asset towards April 17 high at 1.3838, followed by the round-level resistance of 1.3900.
In an alternate scenario, a breakdown below May 3 low around 1.3600 will expose the asset to the April 9 low around 1.3547 and the psychological support of 1.3500.
USD/CAD daily chart
Economic Indicator
Net Change in Employment
The Net Change in Employment released by Statistics Canada is a measure of the change in the number of people in employment in Canada. Generally speaking, a rise in this indicator has positive implications for consumer spending and indicates economic growth. Therefore, a high reading is seen as bullish for the Canadian Dollar (CAD), while a low reading is seen as bearish.
Read more.Next release: Fri May 10, 2024 12:30
Frequency: Monthly
Consensus: 18K
Previous: -2.2K
Source: Statistics Canada
Canada’s labor market statistics tend to have a significant impact on the Canadian dollar, with the Employment Change figure carrying most of the weight. There is a significant correlation between the amount of people working and consumption, which impacts inflation and the Bank of Canada’s rate decisions, in turn moving the C$. Actual figures beating consensus tend to be CAD bullish, with currency markets usually reacting steadily and consistently in response to the publication.
Artigos Recomendados


