


EUR/USD drifts away from highs ahead of flash PMIs
- EUR/USD remains close to 1.1765 highs after bouncing from 1.1670 on Thursday.
- The US Dollar is on track for its largest weekly sell-off in months amid US-EU tensions.
- Erozone and US flash PMIs are likely to drive the pair on Friday.
EUR/USD posts moderate losses, trading near 1.1730 at the time of writing on Friday, but holding most of the previous day's gains and on track for its strongest weekly performance since June. The US Dollar (USD) has been hit by US President Donald Trump's obsession with acquiring Greenland, while the market braces for the release of flash Purchasing Managers' Index (PMI) figures in Europe and the US.
Trump said on social media that he has secured total and permanent access to Greenland in a deal with the North Atlantic Treaty Organization (NATO), following a speech at the Davos World Economic Forum, where he backed off on the use of military action against NATO allies and withdrew threats of tariffs to the Eurozone countries.
On the macroeconomic front, US Q3 Gross Domestic Product (GDP) figures beat expectations on Thursday, weekly Initial Jobless Claims rose less than expected, and the Personal Consumption Expenditures (PCE) Price Index revealed higher inflationary pressures in November, supporting the US Federal Reserve's (Fed) view of steady interest rates. The data, however, was practically ignored, with geopolitical tensions front and center in the market.
Euro Price Today
The table below shows the percentage change of Euro (EUR) against listed major currencies today. Euro was the strongest against the New Zealand Dollar.
| USD | EUR | GBP | JPY | CAD | AUD | NZD | CHF | |
|---|---|---|---|---|---|---|---|---|
| USD | 0.15% | 0.09% | -0.03% | 0.08% | -0.04% | 0.14% | 0.14% | |
| EUR | -0.15% | -0.06% | -0.19% | -0.07% | -0.18% | -0.01% | -0.01% | |
| GBP | -0.09% | 0.06% | -0.11% | -0.00% | -0.12% | 0.05% | 0.05% | |
| JPY | 0.03% | 0.19% | 0.11% | 0.15% | 0.02% | 0.19% | 0.20% | |
| CAD | -0.08% | 0.07% | 0.00% | -0.15% | -0.13% | 0.05% | 0.06% | |
| AUD | 0.04% | 0.18% | 0.12% | -0.02% | 0.13% | 0.17% | 0.19% | |
| NZD | -0.14% | 0.00% | -0.05% | -0.19% | -0.05% | -0.17% | -0.00% | |
| CHF | -0.14% | 0.01% | -0.05% | -0.20% | -0.06% | -0.19% | 0.00% |
The heat map shows percentage changes of major currencies against each other. The base currency is picked from the left column, while the quote currency is picked from the top row. For example, if you pick the Euro from the left column and move along the horizontal line to the US Dollar, the percentage change displayed in the box will represent EUR (base)/USD (quote).
Daily Digest Market Movers: EU-US tensions hit the US Dollar
- The US Dollar Index (DXY) languishes near three-week lows as the deterioration in the relationship between the US and the EU, its main trading partner, amid the Greenland issue erodes confidence in the US as a global leader and the status of the US Dollar as a reserve currency.
- Market sentiment improved after Trump softened his tone toward the European Union, which allowed for a relief rally. Transatlantic relations, however, have been severely damaged, and the US Dollar is taking the brunt of it, at least for now.
- US macroeconomic releases, on the other hand, were USD-supportive on Thursday. The US Q3 GDP was revised up to 4.4% annualized growth, from the previous 4.3% estimate, and also above the 3.8% growth seen in Q2.
- The US PCE Price Index accelerated 2.8% year-on-year in November from 2.7% previously, as widely expected. The core PCE Price Index showed an identical performance.
- Beyond that, US Initial Jobless Claims rose to 200K in the week of January 17, from the upwardly revised 199K the previous week, still well below the 212K anticipated by the market.
- Later on Friday, the Eurozone's preliminary HCOB PMIs are expected to show that business activity in the services sector accelerated, with the Services PMI index rising to 52.8 in January from 52.4 in December, while the Manufacturing PMI is expected to rise to 49.0 from 48.8 in December.
- In the US, the S&P Global preliminary Services PMI is seen ticking up to 52.8 in January from 52.5 in December.
Technical Analysis: EUR/USD fails again near the 1.1765 area
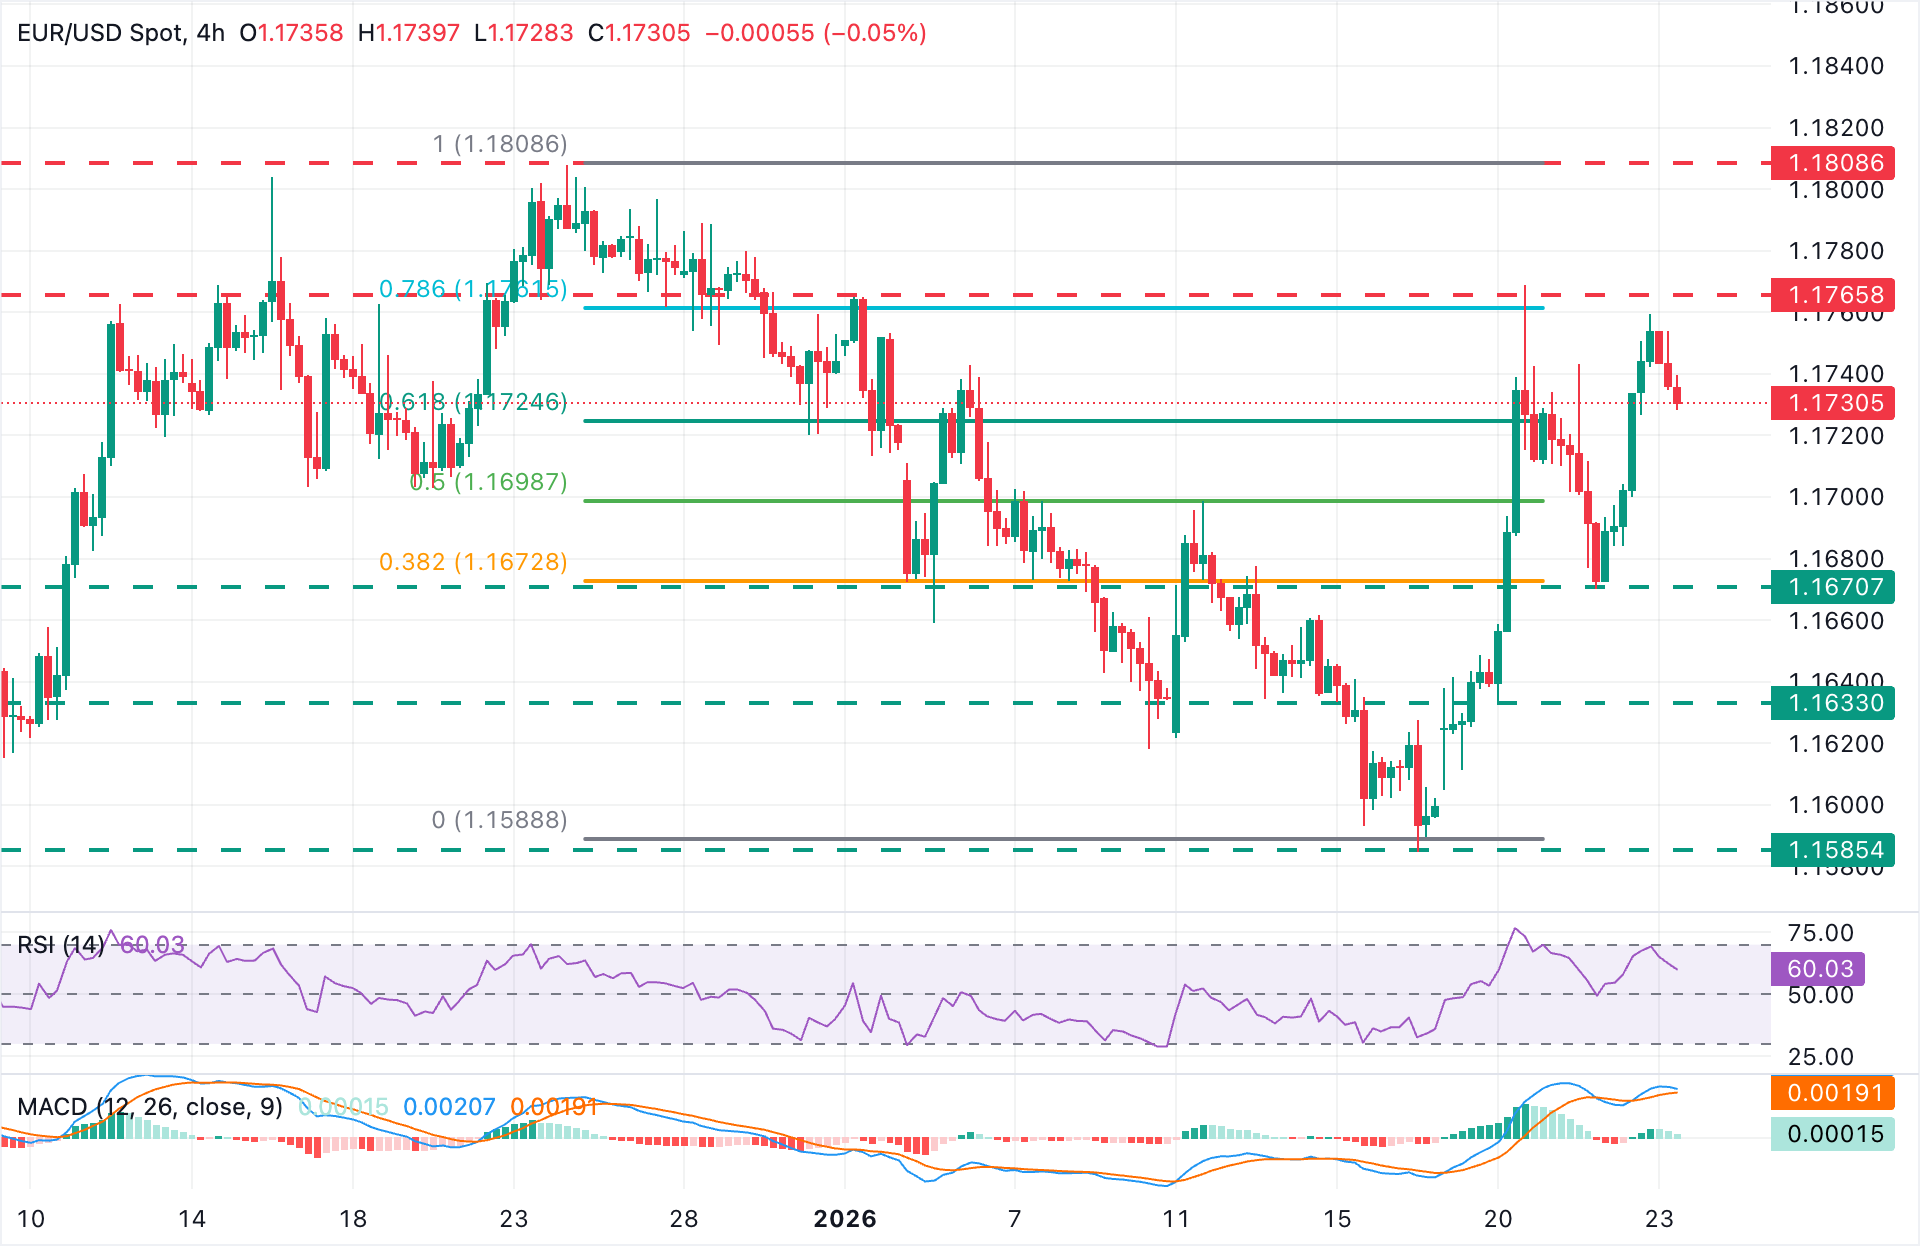
EUR/USD is retreating from levels close to a key resistance area at 1.1765. Technical indicators are also turning lower on the 4-hour chart. The Relative Strength Index (RSI) has dropped to 60, approaching the neutral zone, and the Moving Average Convergence Divergence (MACD) histogram is contracting, highlighting a weaker upside momentum.
On the downside, intraday lows are at the 1.1725 area, although there is no clear support ahead of Thursday's low at 1.1670. Above the mentioned 1.1765 (January 2 and 20 highs), the next target is the December 24 high, at 1.1808.
(The technical analysis of this story was written with the help of an AI tool.)
Economic Indicator
HCOB Manufacturing PMI
The Manufacturing Purchasing Managers Index (PMI), released on a monthly basis by S&P Global and Hamburg Commercial Bank (HCOB), is a leading indicator gauging business activity in the Eurozone manufacturing sector. The data is derived from surveys of senior executives at private-sector companies from the manufacturing sector. Survey responses reflect the change, if any, in the current month compared to the previous month and can anticipate changing trends in official data series such as Gross Domestic Product (GDP), industrial production, employment and inflation. The index varies between 0 and 100, with levels of 50.0 signaling no change over the previous month. A reading above 50 indicates that the manufacturing economy is generally expanding, a bullish sign for the Euro (EUR). Meanwhile, a reading below 50 signals that activity among goods producers is generally declining, which is seen as bearish for EUR.
Read more.Next release: Fri Jan 23, 2026 09:00 (Prel)
Frequency: Monthly
Consensus: 49
Previous: 48.8
Source: S&P Global
Economic Indicator
HCOB Services PMI
The Services Purchasing Managers Index (PMI), released on a monthly basis by S&P Global and Hamburg Commercial Bank (HCOB), is a leading indicator gauging business activity in the Eurozone services sector. As the services sector dominates a large part of the economy, the Services PMI is an important indicator gauging the state of overall economic conditions. The data is derived from surveys of senior executives at private-sector companies from the services sector. Survey responses reflect the change, if any, in the current month compared to the previous month and can anticipate changing trends in official data series such as Gross Domestic Product (GDP), industrial production, employment and inflation. The index varies between 0 and 100, with levels of 50.0 signaling no change over the previous month. A reading above 50 indicates that the services economy is generally expanding, a bullish sign for the Euro (EUR). Meanwhile, a reading below 50 signals that activity among services providers is generally declining, which is seen as bearish for EUR.
Read more.Next release: Fri Jan 23, 2026 09:00 (Prel)
Frequency: Monthly
Consensus: 52.8
Previous: 52.4
Source: S&P Global
Artigos Recomendados


