

Australian Dollar holds ground following stronger monthly CPI
- Australian Dollar steadies as Monthly CPI rose by 2.8% YoY in July, surpassing the expected 2.3% increase.
- Traders remain cautious after President Trump warned of a 200% tariff on Chinese goods.
- Trump has indicated that White House economist Stephen Miran could be considered for Fed Governor Lisa Cook’s seat.
The Australian Dollar (AUD) remains steady following the release of the Monthly Consumer Price Index (CPI) on Wednesday. However, the AUD/USD pair receives downward pressure as the US Dollar (USD) recovers its recent losses from the previous session.
Australian Bureau of Statistics (ABS) reported that the Monthly Consumer Price Index jumped by 2.8% year-over-year in July, following a 1.9% increase reported in June. The market consensus was for 2.3% growth in the reported period. Meanwhile, the Australian Construction Work Done improved to 3% in the second quarter, against the 0.8% expected.
Traders remain cautious following US President Donald Trump’s warning of imposing a 200% tariff on Chinese goods if Beijing refuses to supply magnets to the United States (US), per Reuters. It is worth noting that any change in the Chinese economy could influence AUD as China and Australia are close trading partners.
Australian Dollar steadies as US Dollar recovers recent losses
- The US Dollar Index (DXY), which measures the value of the US Dollar against six major currencies, is retracing its recent losses and trading around 98.30 at the time of writing. Focus is shifted toward the upcoming release of the Q2 US Gross Domestic Product Annualized and July Personal Consumption Expenditures Price Index data, the Fed's preferred inflation gauge.
- US President Donald Trump announced early Tuesday that he was removing Fed Governor Lisa Cook from her position on the Fed's board of directors. This is considered the first instance of a president firing a central bank governor in the Fed’s 111-year history.
- Trump has already nominated White House economist Stephen Miran to a temporary seat that expires in January and has suggested Miran could also be in the running for Cook’s position. Meanwhile, The Wall Street Journal reported that David Malpass, former World Bank president, is another potential candidate.
- President Trump threatened "subsequent additional tariffs" and export restrictions on advanced technology and semiconductors in retaliation for digital services taxes that hit American technology companies, per Bloomberg.
- Fed Chair Jerome Powell said at the Jackson Hole symposium on Friday that risks to the job market were rising, but also noted inflation remained a threat and that a decision wasn't set in stone. Powell also stated that the Fed still believes it may not need to tighten policy solely based on uncertain estimates that employment may be beyond its maximum sustainable level.
- The US Initial Jobless Claims rose to 235K for the previous week, an eight-week high and above the consensus estimate of 225K, suggesting some softening in labor market conditions.
- The preliminary S&P Global US Composite PMI picked up pace in August, with the index at 55.4 against 55.1 prior. Meanwhile, the US Manufacturing PMI rose to 53.3 from 49.8 prior, surpassing the market consensus of 49.5. Services PMI eased to 55.4 from 55.7 in the previous reading, but was stronger than the 54.2 expected.
- The Reserve Bank of Australia (RBA) Minutes of its August monetary policy meeting suggested that board members agreed that some further reduction in the cash rate is likely to be needed in the coming year. RBA Meeting Minutes also indicated that policymakers consider the pace of rate cuts would be determined by incoming data and the balance of global risks. The board saw arguments for both a gradual pace of easing and for a faster pace, while the labor market remained a little tight, inflation was still above the midpoint, and domestic demand was recovering.
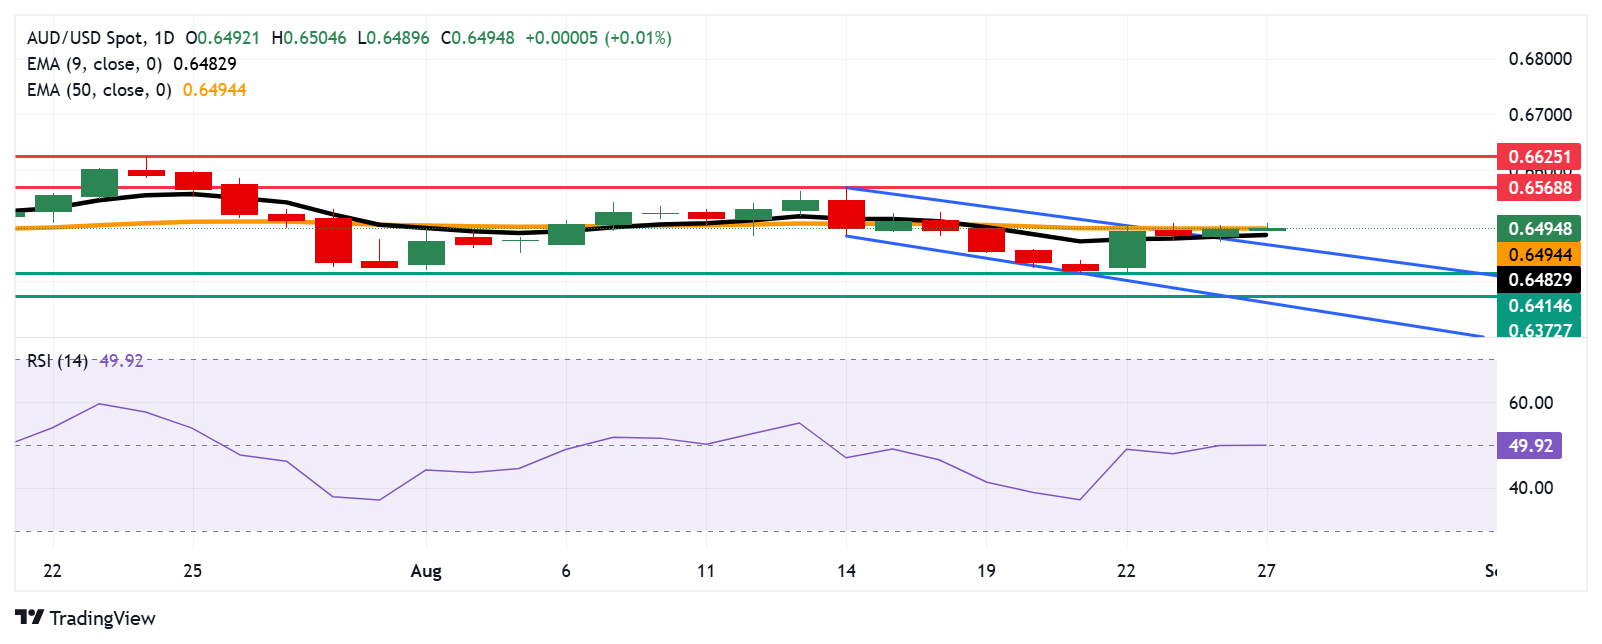
Australian Dollar tests confluence resistance zone around 0.6500
The AUD/USD pair is trading around 0.6500 on Wednesday. The technical analysis of the daily chart indicates that the pair is positioned slightly above the descending channel pattern, suggesting an emergence of a bullish bias. Additionally, the pair is trading above the nine-day EMA, indicating short-term price momentum is strengthening.
On the upside, a successful breach above the psychological level of 0.6500 could support the AUD/JPY pair to explore the region around the monthly high at 0.6568, reached on August 14. Further advances could prompt the pair to test the nine-month high of 0.6625, which was recorded on July 24.
The immediate support is appearing at the 50-day EMA of 0.6494, followed by the nine-day EMA of 0.6482. A break below these levels would weaken the medium- and short-term price momentum and put downward pressure on the pair to return to the descending channel and target the two-month low of 0.6414, recorded on August 21. Further declines would find support near the three-month low of 0.6372, reached on June 23, followed by the descending channel’s lower boundary.
AUD/USD: Daily Chart
Australian Dollar Price Today
The table below shows the percentage change of Australian Dollar (AUD) against listed major currencies today. Australian Dollar was the strongest against the Japanese Yen.
| USD | EUR | GBP | JPY | CAD | AUD | NZD | CHF | |
|---|---|---|---|---|---|---|---|---|
| USD | 0.14% | 0.15% | 0.27% | 0.02% | 0.06% | 0.18% | 0.10% | |
| EUR | -0.14% | 0.00% | 0.05% | -0.16% | -0.15% | 0.00% | -0.08% | |
| GBP | -0.15% | -0.00% | 0.10% | -0.12% | -0.04% | 0.04% | -0.04% | |
| JPY | -0.27% | -0.05% | -0.10% | -0.19% | -0.20% | -0.08% | -0.08% | |
| CAD | -0.02% | 0.16% | 0.12% | 0.19% | 0.04% | 0.18% | 0.08% | |
| AUD | -0.06% | 0.15% | 0.04% | 0.20% | -0.04% | 0.15% | 0.06% | |
| NZD | -0.18% | -0.00% | -0.04% | 0.08% | -0.18% | -0.15% | -0.08% | |
| CHF | -0.10% | 0.08% | 0.04% | 0.08% | -0.08% | -0.06% | 0.08% |
The heat map shows percentage changes of major currencies against each other. The base currency is picked from the left column, while the quote currency is picked from the top row. For example, if you pick the Australian Dollar from the left column and move along the horizontal line to the US Dollar, the percentage change displayed in the box will represent AUD (base)/USD (quote).
Economic Indicator
Monthly Consumer Price Index (YoY)
The Monthly Consumer Price Index (CPI), released by the Australian Bureau of Statistics on a monthly basis, measures the changes in the price of a fixed basket of goods and services acquired by household consumers. The indicator was developed to provide inflation data at a higher frequency than the quarterly CPI. The YoY reading compares prices in the reference month to the same month a year earlier. A high reading is seen as bullish for the Australian Dollar (AUD), while a low reading is seen as bearish.
Read more.Last release: Wed Aug 27, 2025 01:30
Frequency: Monthly
Actual: 2.8%
Consensus: 2.3%
Previous: 1.9%
Source: Australian Bureau of Statistics
Artigos Recomendados


