


US Dollar Index hits near a month high before reversing ahead of US-China trade talks
- The US Dollar Index extends gains to 100.86 on Friday before reversing course.
- The euphoria over the US-UK trade deal is quickly fading.
- The US Dollar Index looks set to test a vital earlier resistance at 100.22 now for support.
The US Dollar Index (DXY), which tracks the performance of the US Dollar (USD) against six major currencies, is quickly reversing course this Friday ahead of the United States (US) trade talks with China in Switzerland over the weekend. The DXY index trades near 100.45 at the time of writing after hitting a near-a-month high of 100.86 earlier in the day. The euphoria over the United Kingdom (UK) trade deal with the US is being written off as not a trade deal at all. The US gets to keep its 10% tariffs on UK goods while getting better and easier access to the UK consumer markets.
It was not at all a comprehensive and all-around trade deal that US President Donald Trump promised in the run-up to the announcement. Such a poor deal is being brokered with one of the smaller countries in terms of exposure to the US, and it sets the scene for trade talks this weekend with China not to go that smoothly. Although President Trump, according to sources, said tariffs could drop as low as 50% if China cooperates this weekend, it rather looks as if the US is not the strongest party sitting at the negotiating table, Bloomberg reports.
Daily digest market movers: Fed takes over agenda this Friday
- As already mentioned, China and the US will meet in Switzerland for trade talks over the weekend. However, no trade deal would be discussed, but only defusing the situation. Besides that, the Chinese Ministry of Commerce has reiterated several times this week that trade talks can only take place if the US unilaterally drops its tariffs.
- A slew of Fed speakers are lined up to speak this Friday:
- At 12:30 GMT, Federal Reserve Governor Adriana Kugler and New York Fed President John Williams deliver a speech about employment at the Reykjavik Economic Conference 2025 in Iceland.
- At 14:00 GMT, Federal Reserve Bank of Chicago President and CEO Austan Goolsbee shares opening remarks at the Fed Listens event, Perspectives from the Midwest, at the Federal Reserve Bank of Chicago.
- At 15:30 GMT, Federal Reserve Governor Christopher Waller participates in a panel discussion about monetary policy research at the Hoover Monetary Policy Conference in Stanford.
- At 22:45 GMT, Federal Reserve Governor Lisa Cook, Federal Reserve Bank of Cleveland President Beth Hammack, and St. Louis Fed President Alberto Musalem participate in a panel discussion about productivity dynamics at the Hoover Monetary Policy Conference in Stanford.
- Equities are in the green on Friday, though not massively. European indices are up 0.5% on average. US Futures are flat to marginally higher, less than 0.5%.
- The CME FedWatch tool shows the chance of an interest rate cut by the Federal Reserve in June’s meeting at 17.1%. Further ahead, the July 30 decision sees odds for rates being lower than current levels at 63.2%.
- The US 10-year yields trade around 4.37%, edging higher again after the mid-week dip.
US Dollar Index Technical Analysis: Is this really that good?
The US Dollar Index (DXY) has broken through substantial resistance at 100.22 and is starting to look bullish. However, there are a few questions, as the first trade deal after the ‘Liberation Day’ still sees US tariffs in place. This means elevated prices for US consumers who want to buy specific UK goods, which could still fuel a stagflationary scenario.
On the upside, the DXY’s first resistance comes in at 101.90, which acted as a pivotal level throughout December 2023 and as a base for the inverted head-and-shoulders (H&S) formation during the summer of 2024. In case Dollar bulls push the DXY even higher, the 55-day Simple Moving Average (SMA) at 102.47 comes into play.
On the other hand, the previous resistance at 100.22 should now act as support. The 97.73 support could quickly be tested on any substantial bearish headline. Further below, a relatively thin technical support comes in at 96.94 before looking at the lower levels of this new price range. These would be at 95.25 and 94.56, meaning fresh lows not seen since 2022.
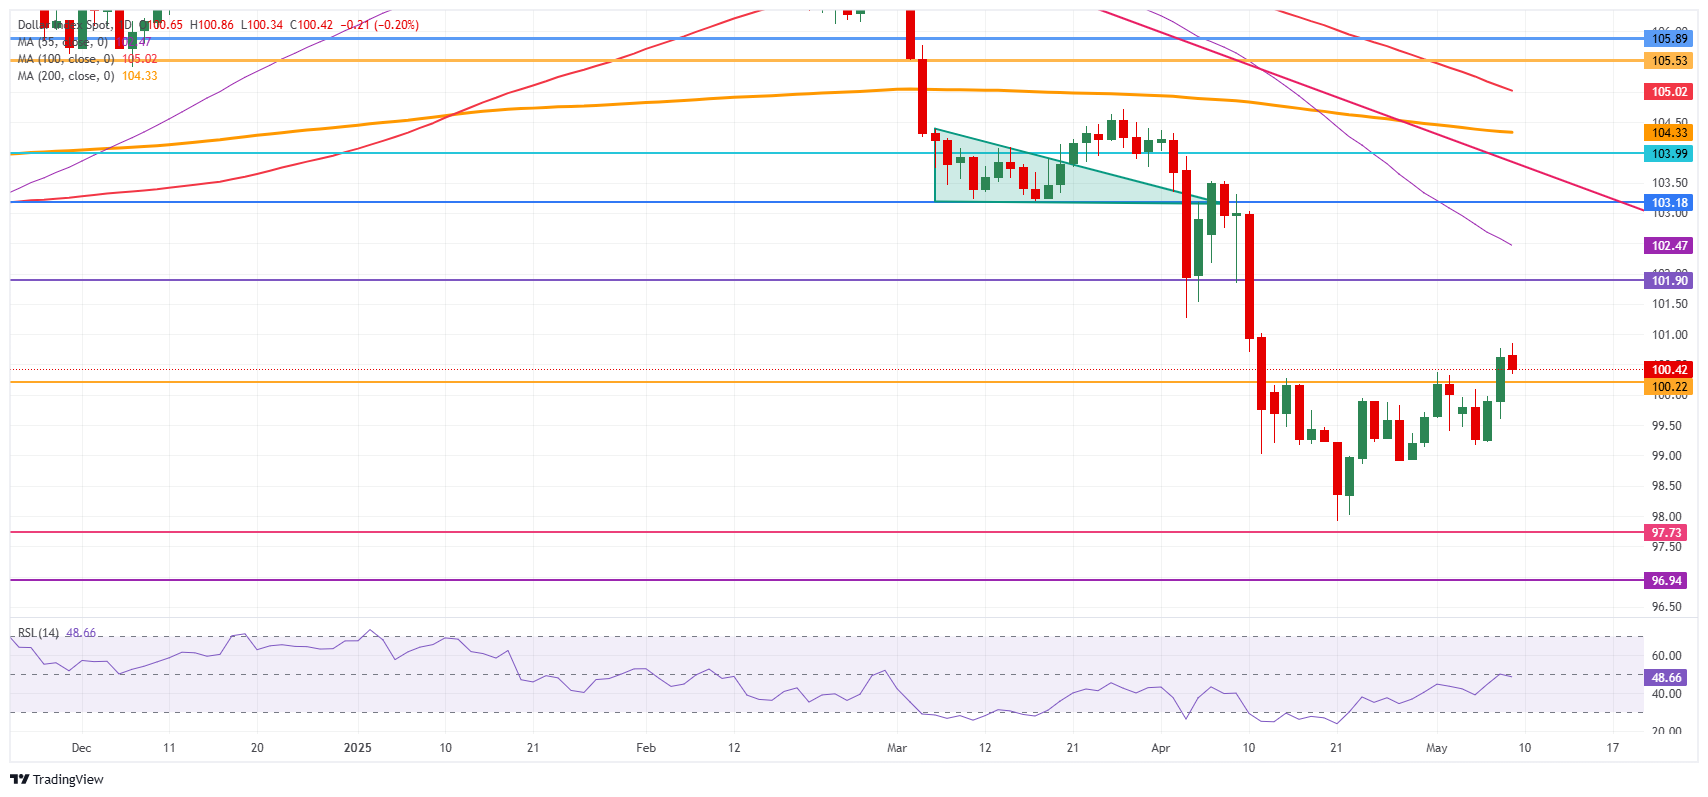
US Dollar Index: Daily Chart
US-China Trade War FAQs
Generally speaking, a trade war is an economic conflict between two or more countries due to extreme protectionism on one end. It implies the creation of trade barriers, such as tariffs, which result in counter-barriers, escalating import costs, and hence the cost of living.
An economic conflict between the United States (US) and China began early in 2018, when President Donald Trump set trade barriers on China, claiming unfair commercial practices and intellectual property theft from the Asian giant. China took retaliatory action, imposing tariffs on multiple US goods, such as automobiles and soybeans. Tensions escalated until the two countries signed the US-China Phase One trade deal in January 2020. The agreement required structural reforms and other changes to China’s economic and trade regime and pretended to restore stability and trust between the two nations. However, the Coronavirus pandemic took the focus out of the conflict. Yet, it is worth mentioning that President Joe Biden, who took office after Trump, kept tariffs in place and even added some additional levies.
The return of Donald Trump to the White House as the 47th US President has sparked a fresh wave of tensions between the two countries. During the 2024 election campaign, Trump pledged to impose 60% tariffs on China once he returned to office, which he did on January 20, 2025. With Trump back, the US-China trade war is meant to resume where it was left, with tit-for-tat policies affecting the global economic landscape amid disruptions in global supply chains, resulting in a reduction in spending, particularly investment, and directly feeding into the Consumer Price Index inflation.
추천 기사


