

Breaking: Bitcoin loses $70,000 amid institutional weakness
- Bitcoin slips below $70,000 on Tuesday, down roughly 15% over the last four straight weeks of losses.
- Momentum indicators signal increasing selling pressure, reaffirming the bearish technical outlook.
- Technical levels suggest BTC could test the April 12 low at $65,000 if selling pressure continues.
Bitcoin (BTC) price dips below $70,000 on Tuesday, extending the 3% decline from the previous day. Market momentum turned extremely bearish, with Exchange Traded Funds (ETFs) tied to BTC offloading roughly $4 billion since May 15. The technical indicators suggest that rising selling pressure could extend the breakout of the support trendline to test the $65,000 psychological level.
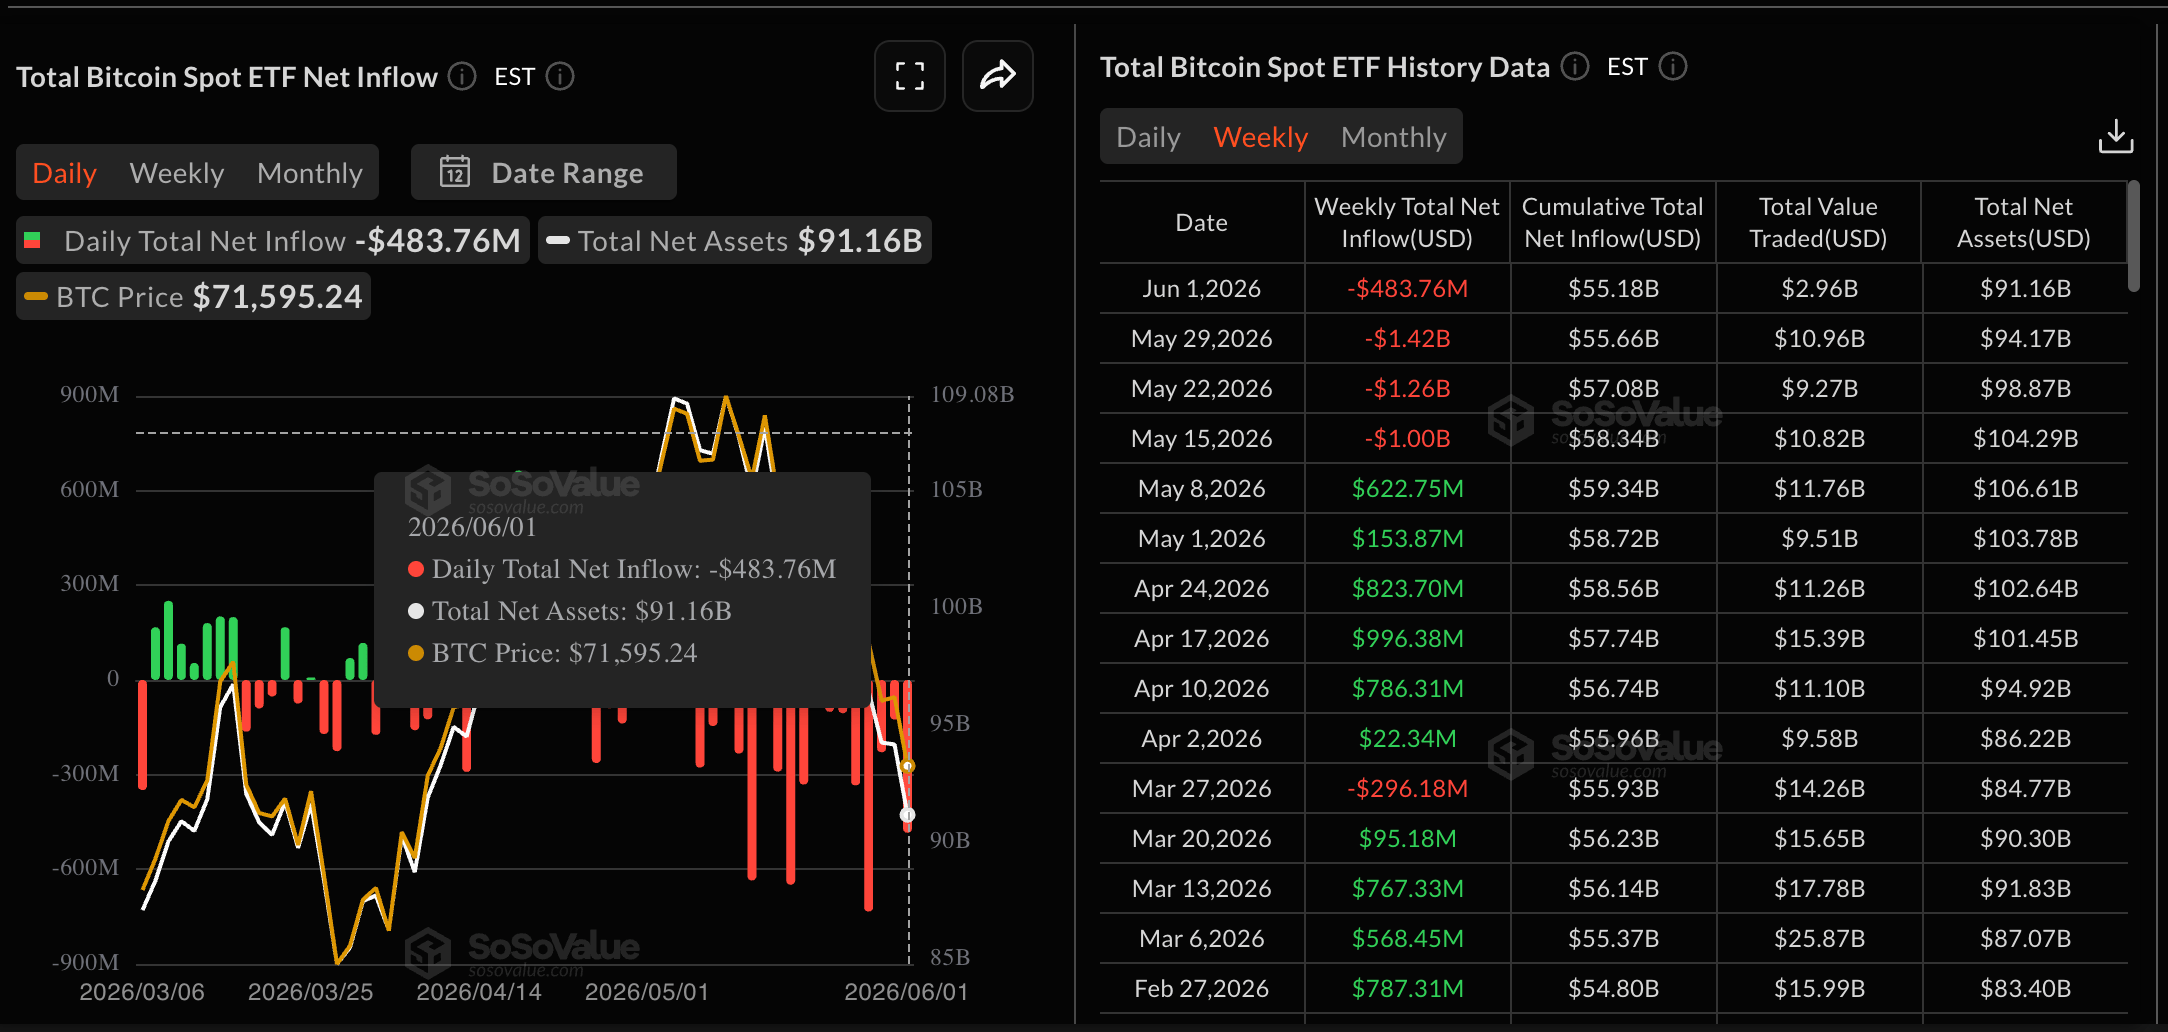
Bitcoin ETF outflows cross $4 billion since May 15
Bitcoin trades below $70,000 for the first time since April 7, likely driven by institutional offloading, with $2.43 billion in outflows recorded in May and Strategy's first-ever sale of 32 BTC on Monday in the last four years. SoSoValue Data shows that Bitcoin ETFs recorded $483.76 million in outflows on Monday, bringing total outflows since May 15 to over $4 billion.
Technical outlook: Downside risk in Bitcoin extends to $65,000
Bitcoin extends its fourth consecutive week of decline, representing roughly a 15% loss, clearing the downside toward $65,000, which previously served as a rebound level on March 29. The King Crypto holds a clear bearish bias as price extends below the rising four-month support trendline with the break area near $71,300. The 50-day and 100-day Exponential Moving Averages (EMAs) near $75,798 and $76,340 are significantly above the price, reinforcing the bearish tone.
Bitcoin risks further decline after losing altitude from recent highs and failing to hold above a crucial support trendline. The Relative Strength Index (RSI) around 27 on the daily chart has entered oversold territory, while the negative Moving Average Convergence Divergence (MACD) extends deeper into the negative zone, with its signal line reinforcing bearish momentum.

Looking up, a sustained recovery above $70,000 would first need to clear the 50-day EMA near $75,798, followed by the 100-day EMA around $76,340.
(The technical analysis of this story was written with the help of an AI tool.)
Bitcoin, altcoins, stablecoins FAQs
Bitcoin is the largest cryptocurrency by market capitalization, a virtual currency designed to serve as money. This form of payment cannot be controlled by any one person, group, or entity, which eliminates the need for third-party participation during financial transactions.
Altcoins are any cryptocurrency apart from Bitcoin, but some also regard Ethereum as a non-altcoin because it is from these two cryptocurrencies that forking happens. If this is true, then Litecoin is the first altcoin, forked from the Bitcoin protocol and, therefore, an “improved” version of it.
Stablecoins are cryptocurrencies designed to have a stable price, with their value backed by a reserve of the asset it represents. To achieve this, the value of any one stablecoin is pegged to a commodity or financial instrument, such as the US Dollar (USD), with its supply regulated by an algorithm or demand. The main goal of stablecoins is to provide an on/off-ramp for investors willing to trade and invest in cryptocurrencies. Stablecoins also allow investors to store value since cryptocurrencies, in general, are subject to volatility.
Bitcoin dominance is the ratio of Bitcoin's market capitalization to the total market capitalization of all cryptocurrencies combined. It provides a clear picture of Bitcoin’s interest among investors. A high BTC dominance typically happens before and during a bull run, in which investors resort to investing in relatively stable and high market capitalization cryptocurrency like Bitcoin. A drop in BTC dominance usually means that investors are moving their capital and/or profits to altcoins in a quest for higher returns, which usually triggers an explosion of altcoin rallies.
추천 기사


