


Dogecoin Forecast: DOGE risks sliding below $0.07 despite returning retail interest
- Dogecoin retains a bearish outlook, with the next key support at $0.07.
- Retail demand returns as perpetual futures Open Interest rises for the second consecutive day to 14 billion DOGE.
- Dogecoin momentum indicators extend weakness, with the RSI nearing oversold territory.
Dogecoin (DOGE) edges lower toward support at $0.07 at the time of writing on Wednesday. The meme coin reflects a broader sell-off in the crypto market, primarily attributed to uncertainty over tensions in the Middle East.
US and Iran exchange fire as risk-off sentiment persists
Iran launched attacks on American military bases in the Middle East on Wednesday in retaliation for attacks by the United States (US) on several places in Iran. The US has also reinstated sanctions on Iran’s Oil sales, saying that the developments were in response to Iranian attacks on ships in the Strait of Hormuz.
The latest wave of attacks has sparked renewed concerns across global markets over a potential escalation in the US-Iran conflict, which could introduce heightened volatility and risk-off sentiment.
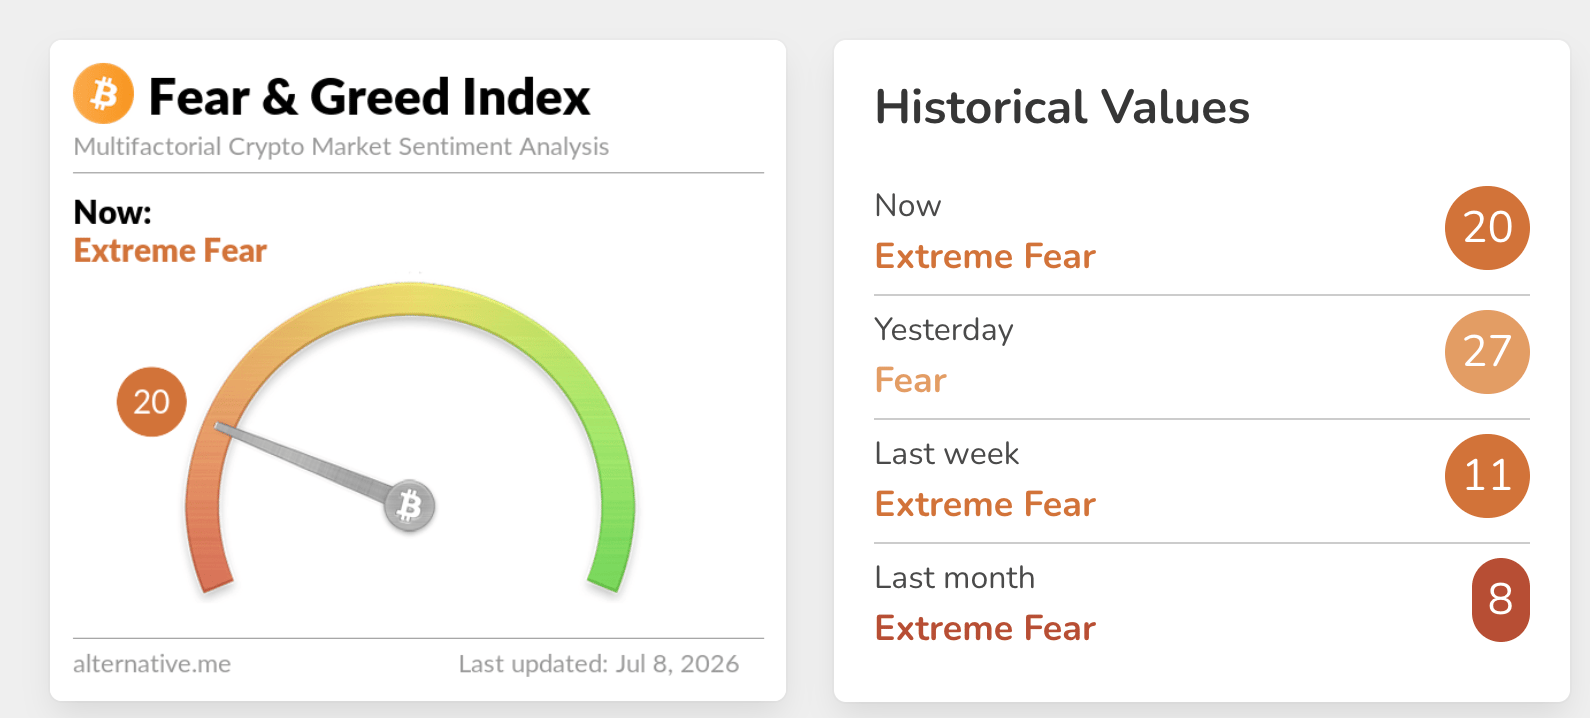
As tensions in the Middle East remain high, sentiment in the crypto market deteriorated. At 20, within the Extreme Fear territory, the crypto Fear & Greed Index indicates that appetite for risk assets is significantly suppressed.
Dogecoin outlook stays weak despite returning retail interest
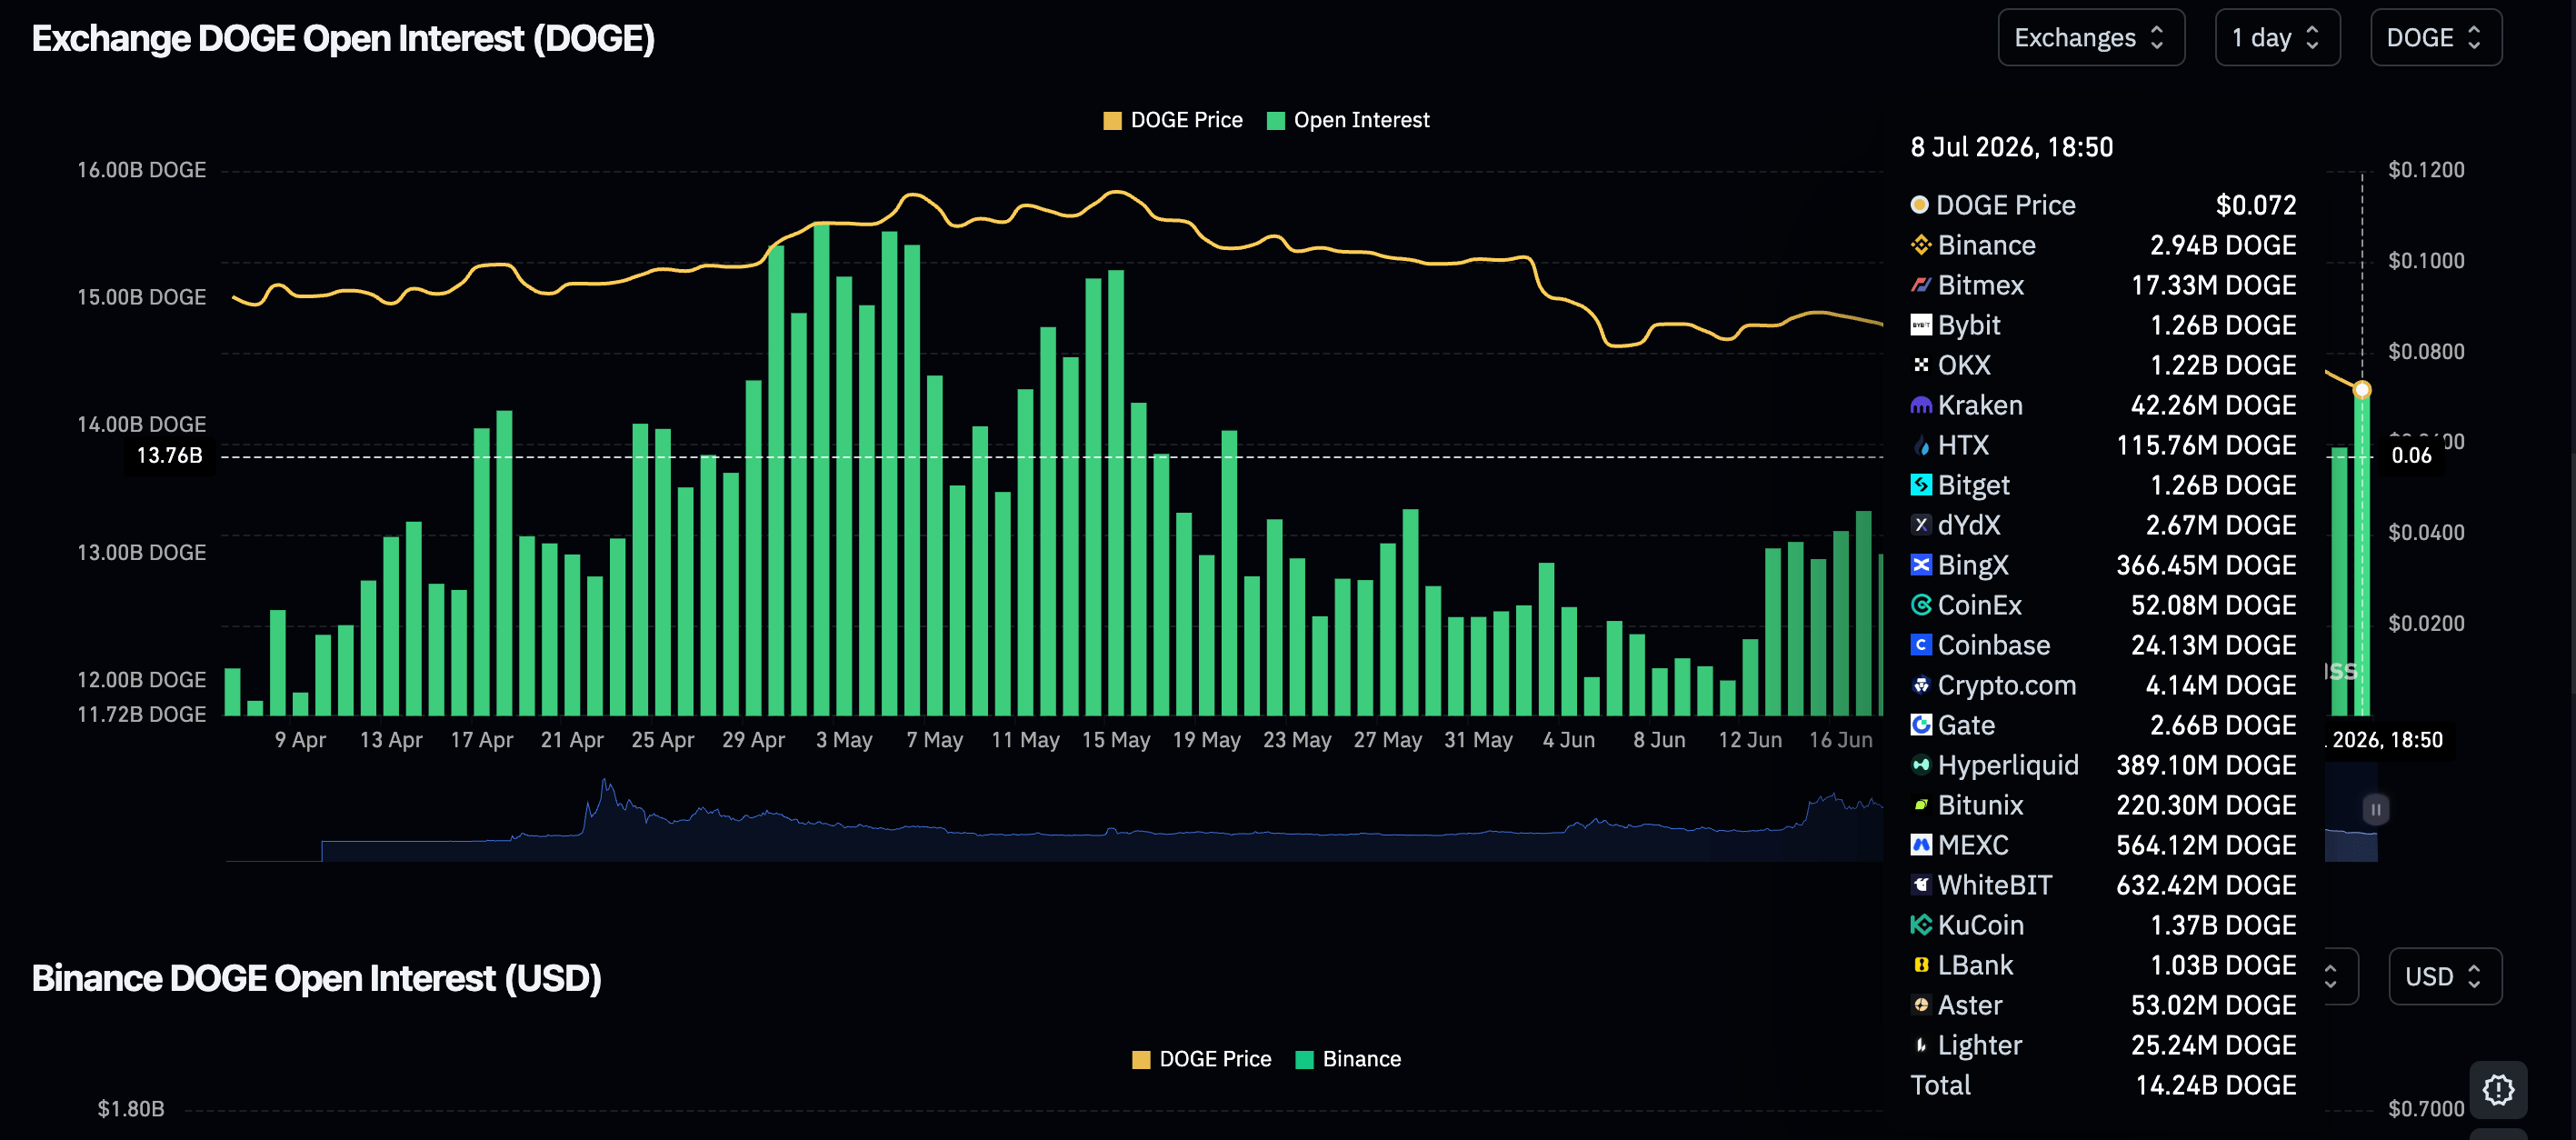
Dogecoin derivatives exhibit mild stability, with perpetual futures Open Interest (OI) rising to 14.24 billion DOGE on Wednesday, from 13.83 billion DOGE the previous day. CoinGlass data highlights a broad increase from the 12.01 billion DOGE recorded on June 12, affirming a long-term investor conviction in Dogecoin’s outlook despite persistent drawdowns.
Price analysis: Dogecoin risks extending losses
Dogecoin maintains a clear bearish near-term tone as price holds beneath the 50-day, 100-day and 200-day Moving Average Exponentials (EMAs) at $0.08, $0.09 and $0.11, respectively. The pair tracks a downward parallel channel, trading below its top boundary at $0.08, while the Relative Strength Index (RSI) near 31 stays close to neutral territory after recovering from oversold levels, and the Moving Average Convergence Divergence (MACD) histogram, mildly positive, hints at tentative but capped upside momentum within the broader downtrend.
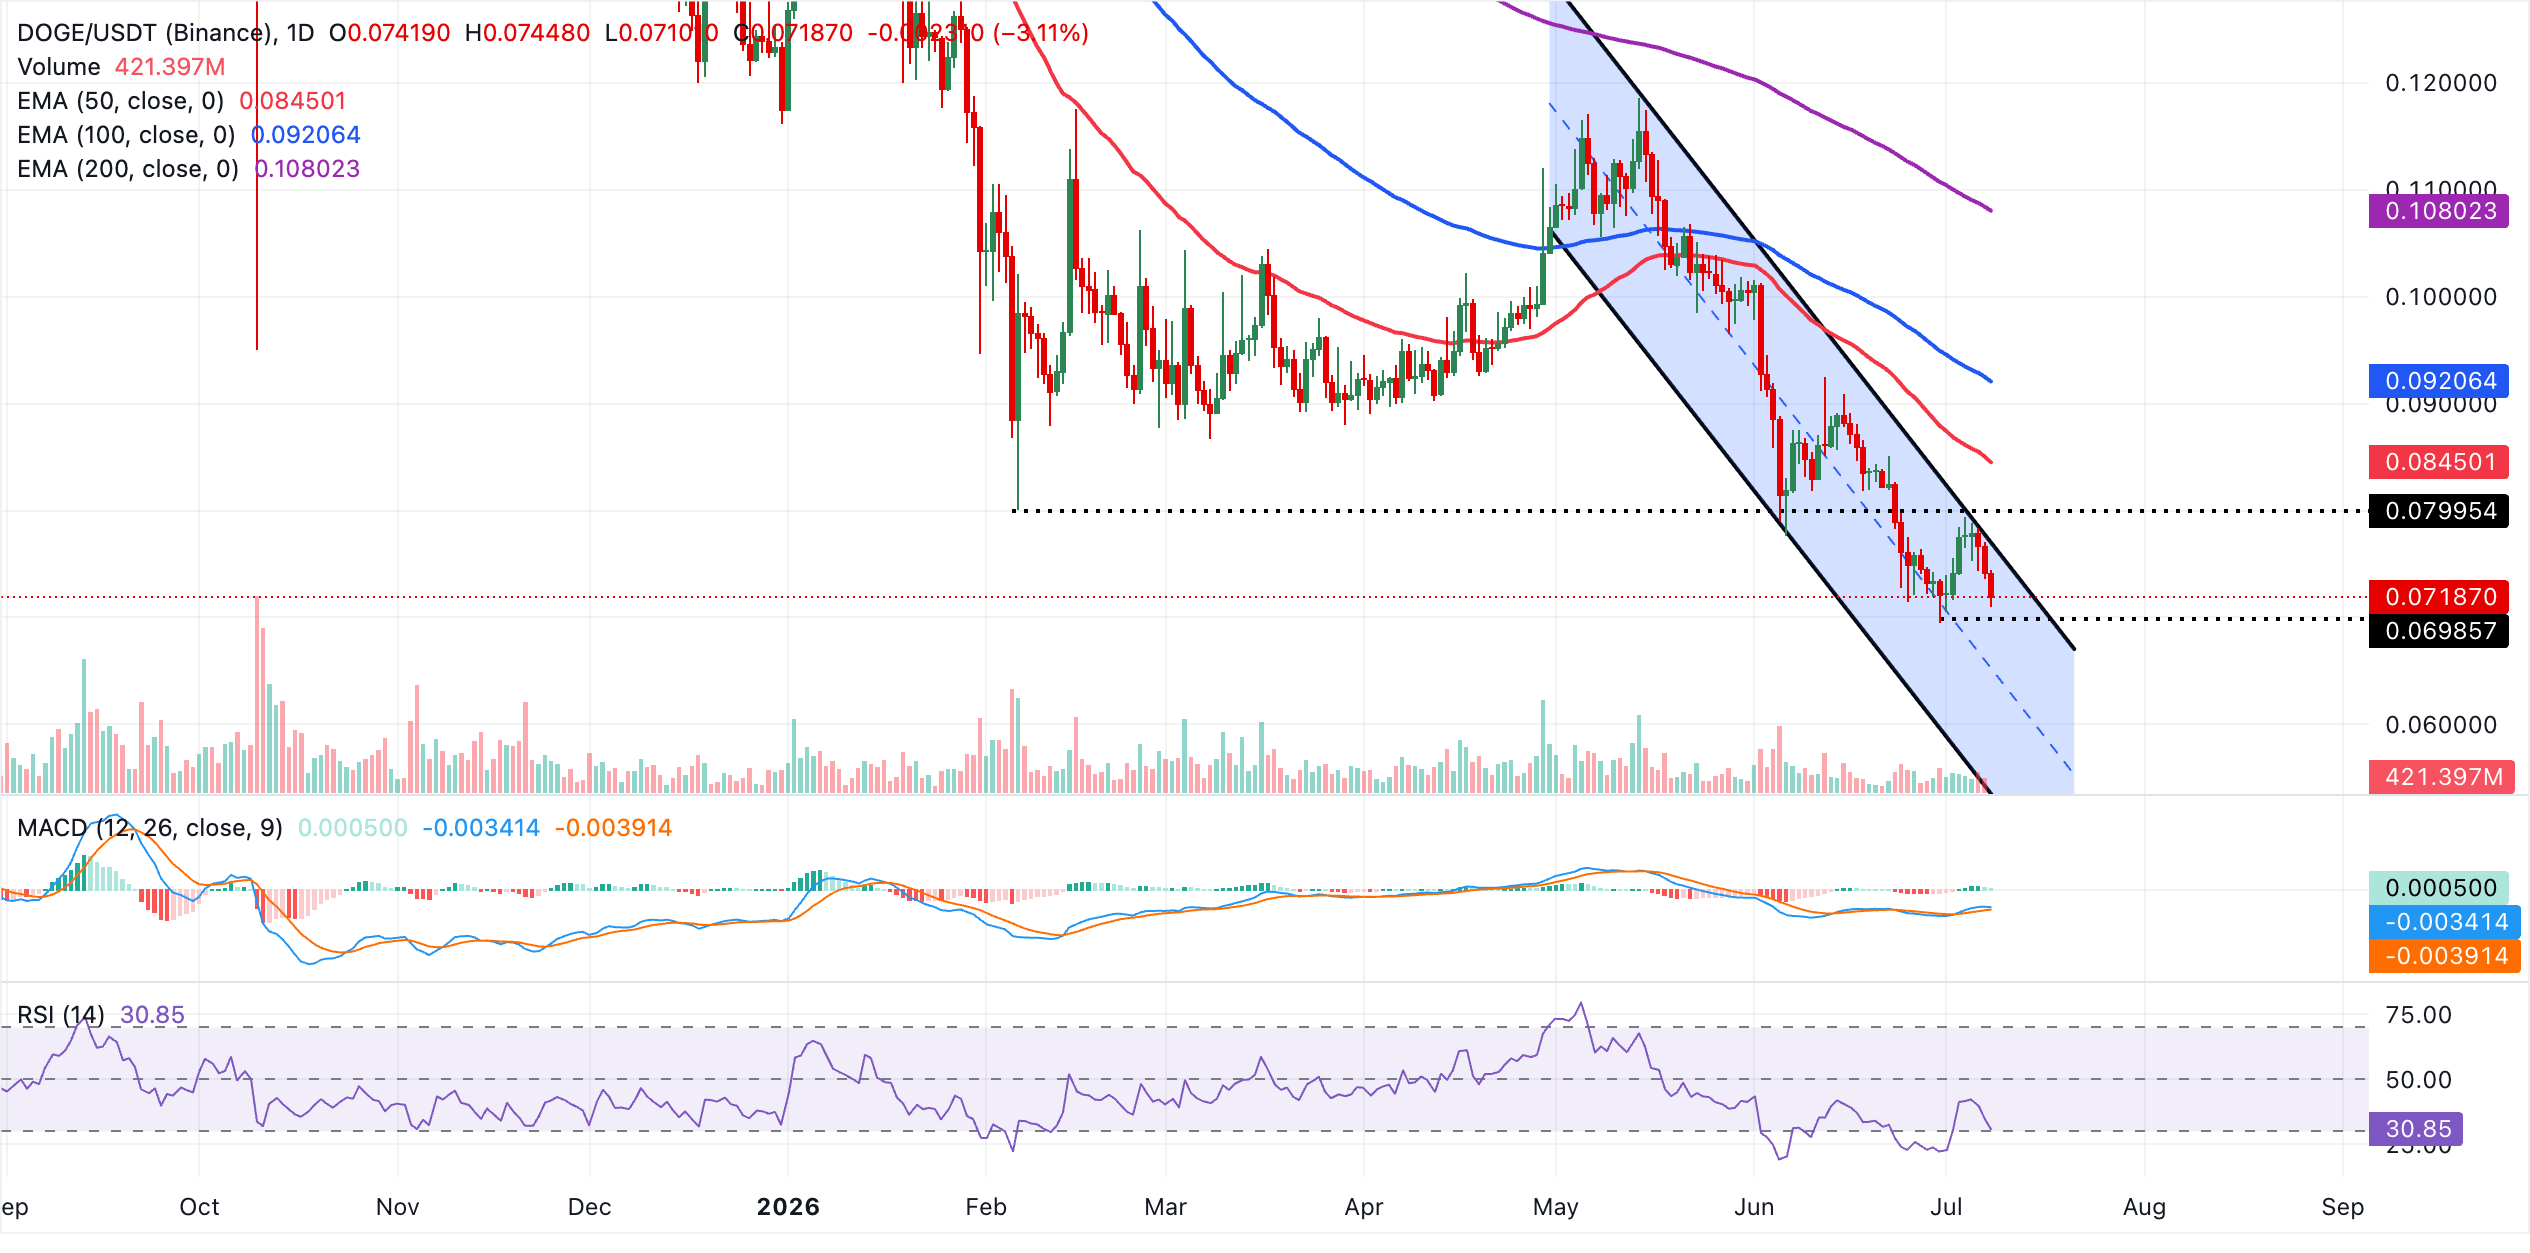
On the topside, initial resistance lies at the channel top near $0.08, with the 100-day EMA at $0.09 and the 200-day EMA at $0.11 reinforcing a dense overhead supply zone that would need to be reclaimed to ease selling pressure. On the flip side, the next notable support aligns with the lower boundary of the descending channel around $0.05, where buyers may attempt to defend the broader structure if the current slide extends.
(The technical analysis of this story was written with the help of an AI tool. Know more.)
Open Interest, funding rate FAQs
Higher Open Interest is associated with higher liquidity and new capital inflow to the market. This is considered the equivalent of increase in efficiency and the ongoing trend continues. When Open Interest decreases, it is considered a sign of liquidation in the market, investors are leaving and the overall demand for an asset is on a decline, fueling a bearish sentiment among investors.
Funding fees bridge the difference between spot prices and prices of futures contracts of an asset by increasing liquidation risks faced by traders. A consistently high and positive funding rate implies there is a bullish sentiment among market participants and there is an expectation of a price hike. A consistently negative funding rate for an asset implies a bearish sentiment, indicating that traders expect the cryptocurrency’s price to fall and a bearish trend reversal is likely to occur.
추천 기사


