


US Dollar Index Price Forecast: Hawkish Fed bets build case for more upside towards 102.85
- The US Dollar reflects broader strength against its peers due to multiple tailwinds.
- Hawkish Fed prospects and higher US Treasury Yields have strengthened the US Dollar.
- ING sees the US Dollar Index extending rally to 102.85.
The US Dollar (USD) trades broadly firm against its major currency peers amid elevated United States (US) Treasury Yields and hawkish Federal Reserve (Fed) interest rate expectations.
US Dollar Price This week
The table below shows the percentage change of US Dollar (USD) against listed major currencies this week. US Dollar was the strongest against the Euro.
| USD | EUR | GBP | JPY | CAD | AUD | NZD | CHF | |
|---|---|---|---|---|---|---|---|---|
| USD | 0.58% | 0.27% | 0.21% | -0.06% | -0.06% | 0.38% | 0.58% | |
| EUR | -0.58% | -0.31% | -0.27% | -0.65% | -0.62% | -0.20% | 0.00% | |
| GBP | -0.27% | 0.31% | 0.02% | -0.34% | -0.32% | 0.12% | 0.32% | |
| JPY | -0.21% | 0.27% | -0.02% | -0.29% | -0.18% | 0.22% | 0.40% | |
| CAD | 0.06% | 0.65% | 0.34% | 0.29% | 0.09% | 0.39% | 0.67% | |
| AUD | 0.06% | 0.62% | 0.32% | 0.18% | -0.09% | 0.44% | 0.64% | |
| NZD | -0.38% | 0.20% | -0.12% | -0.22% | -0.39% | -0.44% | 0.20% | |
| CHF | -0.58% | -0.01% | -0.32% | -0.40% | -0.67% | -0.64% | -0.20% |
The heat map shows percentage changes of major currencies against each other. The base currency is picked from the left column, while the quote currency is picked from the top row. For example, if you pick the US Dollar from the left column and move along the horizontal line to the Japanese Yen, the percentage change displayed in the box will represent USD (base)/JPY (quote).
As of writing, the US Dollar Index (DXY), which gauges the Greenback’s value against six major currencies, trades marginally higher to near 102.30, but is close to its annual high of 102.54 posted earlier this week. 10-year US Treasury Yields are up 0.9% to near 5.33%.
Analysts at ING highlight that the September Federal Open Market Committee (FOMC) minutes of the September policy meeting, released on Wednesday, “reflect a hawkish Fed”.
They have highlighted one line in particular: “Most participants assessed that another increase in the target range for the federal funds rate would likely be appropriate by year-end.” They note this came after a discussion of “frustratingly high inflation” and the Fed being “surprised about the pace and magnitude of the AI build-out.”
ING added that “a hawkish Fed is firmly priced by money markets at this stage.” After an expected “25bp hike to 4.25% in December, the market still looks for another 50bp of tightening next year.” The bank argued “we think that is too aggressive, but doubt the market will want to fight against that hawkish pricing this year.”
In this backdrop, ING says “this leaves the dollar well-supported and winning more friends in a slightly more difficult investment environment.” They point out that “elevated Treasury yields and rising volatility have sucked money out of the carry trade, where most Latam currencies have been hit quite hard,” and, “given events in Europe, we’re looking for the dollar to hold onto gains over the coming months.”
In terms of the broader Dollar index, ING concludes that “DXY can grind up towards a target at 102.85.”
Meanwhile, strategists at Danske Bank have projected 10Y and 30Y Treasuries hitting 6% as investors demand a higher premium.
US Dollar Index Technical Analysis
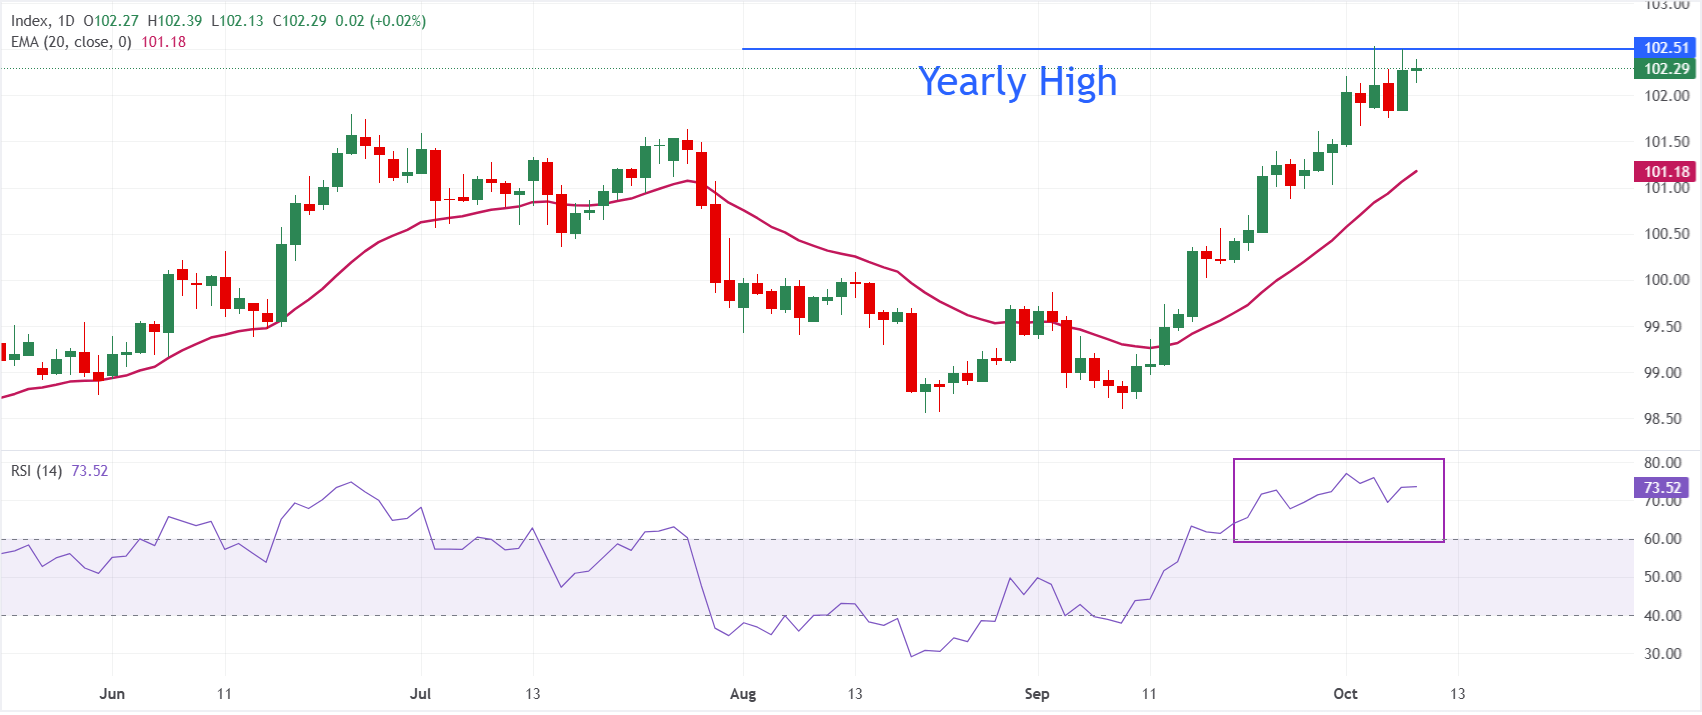
In the daily chart, Dollar Index Spot trades at 102.30. The near-term bias is bullish as price holds above the 20-day Exponential Moving Average (EMA) at 101.18, reinforcing a constructive short-term trend after the recent breakout above the 100.00 handle.
The Relative Strength Index (RSI) at 73.60 sits in overbought territory, suggesting stretched upside conditions that could slow the advance but do not yet show a clear reversal signal.
On the downside, initial support is seen at the 20-day EMA at 101.18, which would be a key level to watch on any pullback, as a sustained break below it would hint at waning bullish pressure. Looking up, the yearly high at 102.54 is the major hurdle; above that the asset could rallt to ING's target of 102.85
(The technical analysis of this story was written with the help of an AI tool. Know more.)
Economic Indicator
FOMC Minutes
FOMC stands for The Federal Open Market Committee that organizes 8 meetings in a year and reviews economic and financial conditions, determines the appropriate stance of monetary policy and assesses the risks to its long-run goals of price stability and sustainable economic growth. FOMC Minutes are released by the Board of Governors of the Federal Reserve and are a clear guide to the future US interest rate policy.
Last release: Wed Oct 07, 2026 18:00
Frequency: Irregular
Actual: -
Consensus: -
Previous: -
Source: Federal Reserve
Minutes of the Federal Open Market Committee (FOMC) is usually published three weeks after the day of the policy decision. Investors look for clues regarding the policy outlook in this publication alongside the vote split. A bullish tone is likely to provide a boost to the greenback while a dovish stance is seen as USD-negative. It needs to be noted that the market reaction to FOMC Minutes could be delayed as news outlets don’t have access to the publication before the release, unlike the FOMC’s Policy Statement.
추천 기사


