


Dow Jones Industrial Average huddles ahead of Fed action
- DJIA sits still just above 52,100, up 15 points, before a hike nobody doubts
- Retail sales up 1.2% against a 0.8% forecast, and the control group up 1.4%
- Fed projections of 3.6% next year against 4.15% priced into December futures
The Dow Jones Industrial Average trades just above 52,100 and has spent the morning going nowhere, on the day the Federal Reserve is expected to raise its rate for the first time since 2023. That is not indifference. A hike the market has expected for a month is worth nothing to the price, and the part it has not priced is the sheet of forecasts that arrives beside it. Ending a three-year pause has been worth 15 points so far.
The quarter-point nobody has to think about
At 18:00 GMT the Fed's rate moves from 3.50-3.75% to 3.75-4.00%, the first increase since 2023 and the first move in either direction since the cut in December 2025. Futures put the odds at 100%. A hike means banks pay more to borrow from each other overnight, and almost every other borrowing rate in the country is built on top of that one. So the extra cost is already sitting in the share price of all 30 companies that carry floating-rate debt, and in what JPMorgan (JPM) and Goldman Sachs (GS) earn on the gap between what they lend at and what they pay depositors. Futures price 0.259 of a point for a move that can only arrive in quarters.
Shoppers took away the last excuse
Retail sales rose 1.2% in August against a 0.8% forecast, reversing July's 0.5% fall. The survey counts dollars rather than items, so a record diesel price of $6.20 a gallon and the fuel bill behind it lift the total without anyone buying more of anything, and gas station sales duly rose 3.1%. Then there is the control group, which strips out fuel, cars and building materials. It rose 1.4%, more than the headline the fuel was supposed to be carrying.
The Dow owns the spending rather than the goods. Visa (V) takes a cut of dollars, so a higher fuel bill is revenue whatever it does to the number of gallons sold. Walmart (WMT) gets the 2.6% rise in online sales, McDonald's (MCD) gets the strength in bars and restaurants, and Home Depot (HD) gets the building materials the control group throws away. A consumer spending at that rate is a consumer the committee can raise rates on again.
The Fed and the futures market are a point apart
The forecasts released alongside the decision are the part worth waiting for. In the committee's last set, where each official writes down where they think the rate should sit, the middle estimate had it at 3.8% by the end of this year and 3.6% by the end of next. That is one hike and then a slow walk back down. Futures have it at 4.15% by December and 4.52% by the summer of 2027, which is a different policy entirely.
The outcome nobody owns is a hold. The White House has spent weeks pressing for rates to stay where they are, and a committee that obliged would buy the index a few minutes of relief and then a bond market that has decided the Fed takes instructions. Long yields cost the 30 companies more than a quarter-point of overnight money ever will.
One of those two paths gets rewritten this afternoon, and the index is priced for neither. A rate walking up to 4.5% is two more increases than the 30 companies have budgeted for, and it lands on top of a 10-year Treasury yield already near 5%, which is the number that actually sets the mortgage. The committee published a path down. The market has spent the summer buying the path up.
What Thursday costs Home Depot
Housing is where a 5% government bond reaches the index first, and Thursday brings the read on it. Housing starts are forecast at 1.31 million against 1.239 million in July, and building permits at 1.41 million against 1.433 million. Home Depot and Sherwin-Williams (SHW) sell into both. Starts are the permits builders pulled months ago and permits are the starts they have yet to commit to, and only one of the two is expected to go up. Jobless claims are forecast at 208K, and a Fed governor speaks Friday at 07:30 GMT.
Levels and bias
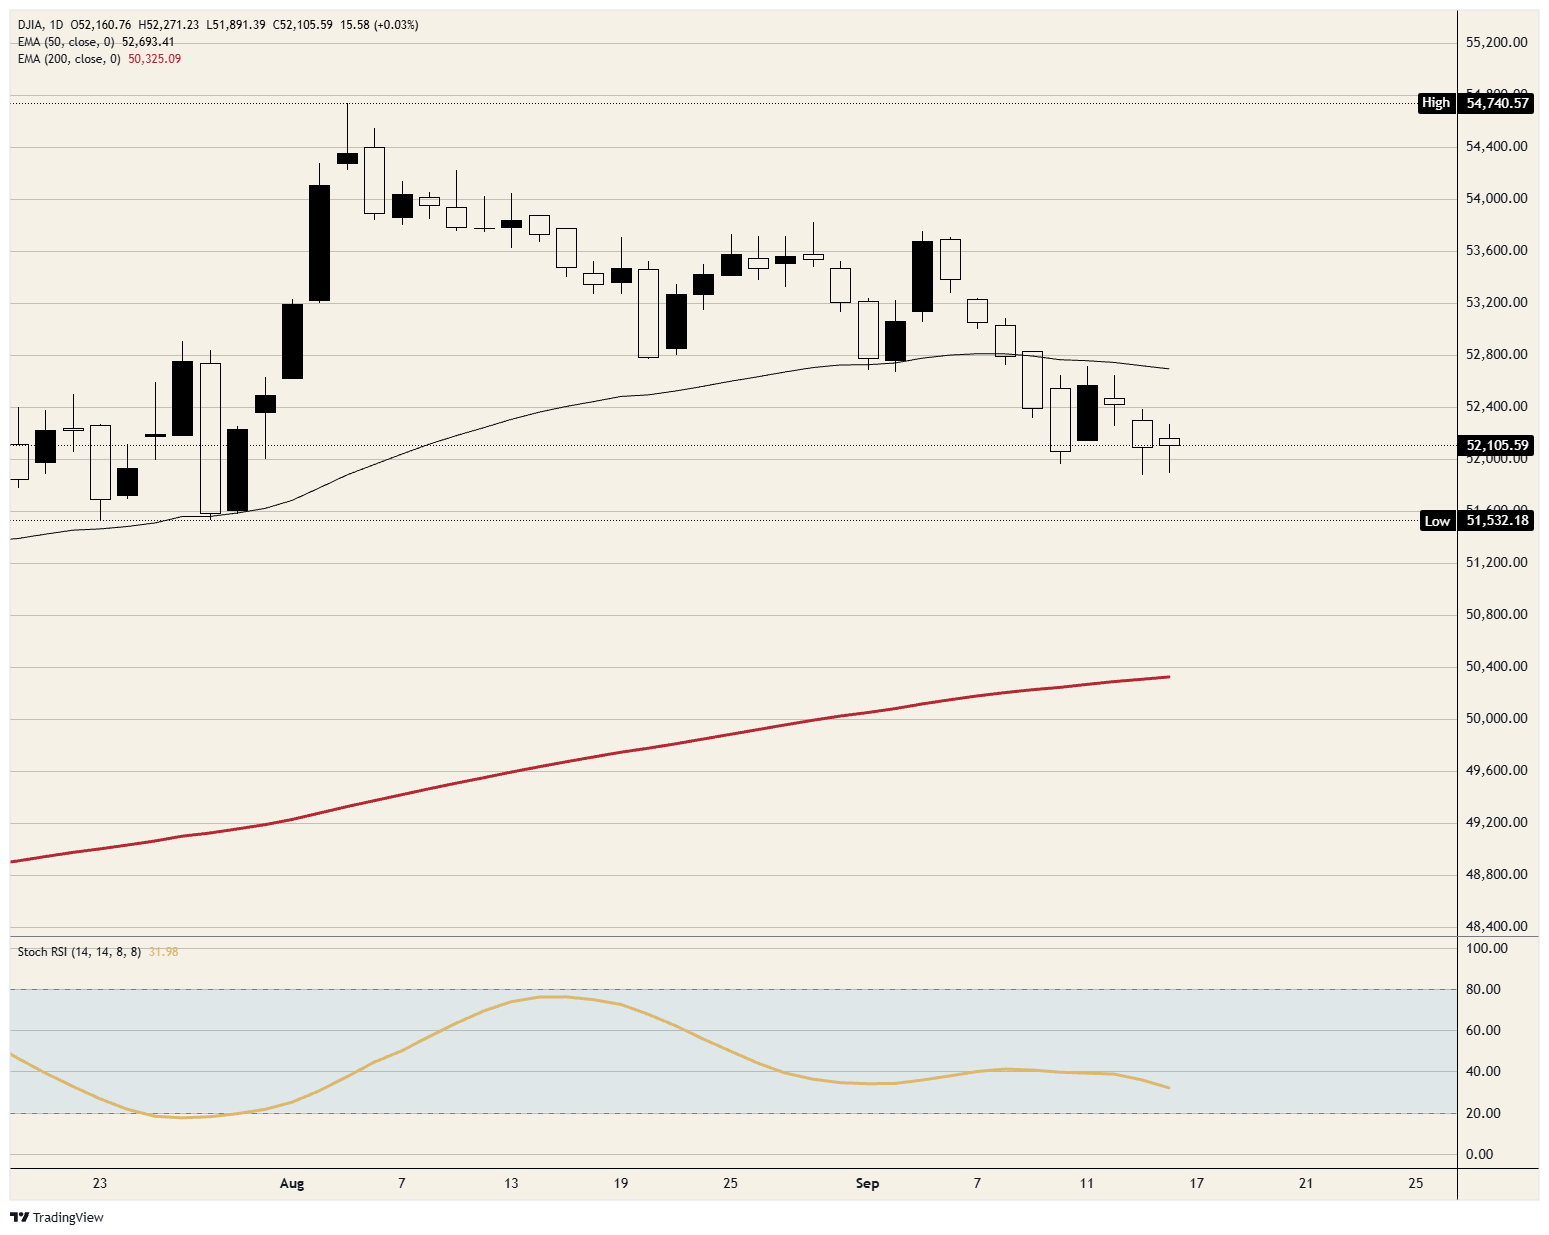
Resistance: Today's high just above 52,250 is the first thing overhead, and the 50-day Exponential Moving Average (EMA) near 52,700 is the one that counts. The index has spent a week failing to get back above it and the average has rolled over. Above that sits 53,000.
Support: Today's low just under 51,900 is the first floor, and it sits below the 52,000 area that held through last week. Under it, the late-July low near 51,500 is where the index stopped falling before the run to the August peak.
Bias: Bearish while 52,700 caps, with the late-July low near 51,500 the first objective and 51,000 behind it. The daily Stochastic Relative Strength Index (Stoch RSI), a momentum gauge, reads near 32 and is still pointing down, so the selling has room left. A daily close back above 53,000 voids the case.
Dow Jones daily chart
Dow Jones FAQs
The Dow Jones Industrial Average, one of the oldest stock market indices in the world, is compiled of the 30 most traded stocks in the US. The index is price-weighted rather than weighted by capitalization. It is calculated by summing the prices of the constituent stocks and dividing them by a factor, currently 0.152. The index was founded by Charles Dow, who also founded the Wall Street Journal. In later years it has been criticized for not being broadly representative enough because it only tracks 30 conglomerates, unlike broader indices such as the S&P 500.
Many different factors drive the Dow Jones Industrial Average (DJIA). The aggregate performance of the component companies revealed in quarterly company earnings reports is the main one. US and global macroeconomic data also contributes as it impacts on investor sentiment. The level of interest rates, set by the Federal Reserve (Fed), also influences the DJIA as it affects the cost of credit, on which many corporations are heavily reliant. Therefore, inflation can be a major driver as well as other metrics which impact the Fed decisions.
Dow Theory is a method for identifying the primary trend of the stock market developed by Charles Dow. A key step is to compare the direction of the Dow Jones Industrial Average (DJIA) and the Dow Jones Transportation Average (DJTA) and only follow trends where both are moving in the same direction. Volume is a confirmatory criteria. The theory uses elements of peak and trough analysis. Dow’s theory posits three trend phases: accumulation, when smart money starts buying or selling; public participation, when the wider public joins in; and distribution, when the smart money exits.
There are a number of ways to trade the DJIA. One is to use ETFs which allow investors to trade the DJIA as a single security, rather than having to buy shares in all 30 constituent companies. A leading example is the SPDR Dow Jones Industrial Average ETF (DIA). DJIA futures contracts enable traders to speculate on the future value of the index and Options provide the right, but not the obligation, to buy or sell the index at a predetermined price in the future. Mutual funds enable investors to buy a share of a diversified portfolio of DJIA stocks thus providing exposure to the overall index.
추천 기사


