


Dow Jones Industrial Average finds no bid under confirmed strikes
- DJIA trades near 52,750, roughly 450 points lower, at fresh session lows.
- Central Command confirms strikes on Guard Corps targets inside Iran.
- September hike priced near 70%, with no cut anywhere on the 2027 strip.
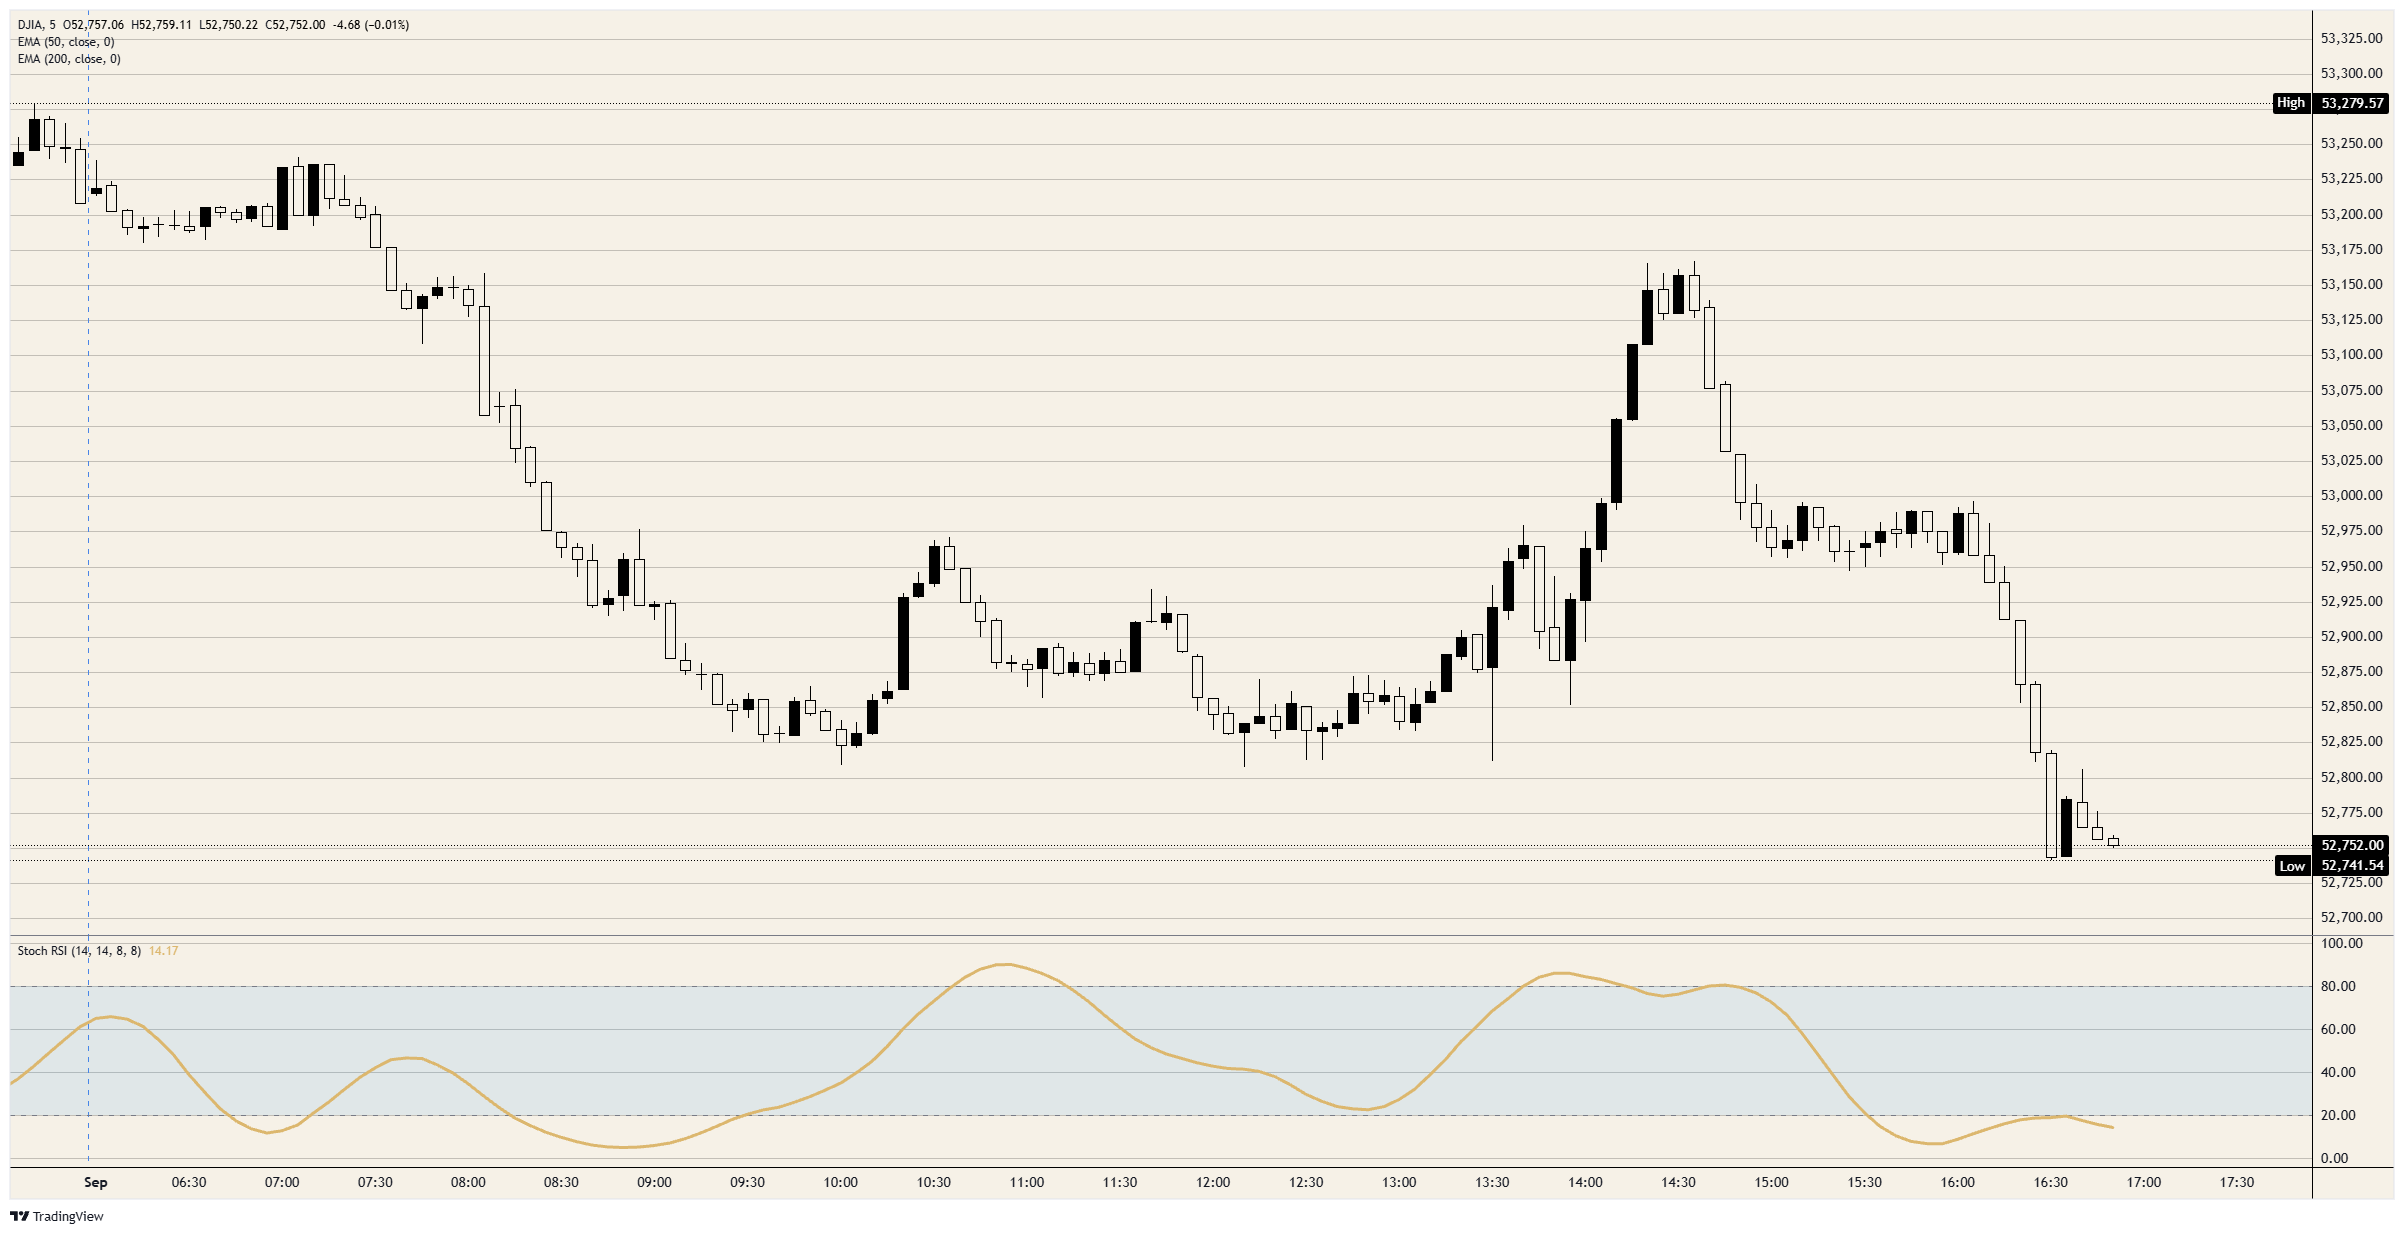
The Dow Jones Industrial Average trades near 52,750, roughly 450 points and 0.85% lower, at fresh session lows made after Central Command confirmed that American forces had begun striking Islamic Revolutionary Guard Corps (IRGC) targets inside Iran. A recovery that had carried the index back above the 53,000 handle and stalled short of 53,200 was gone inside the hour. Nothing in Tuesday's American data left a bid underneath it.
Dow Jones 5-minute chart
What the confirmation changed
Two tankers, one Saudi and one South Korean-owned, were hit by projectiles in the Strait of Hormuz overnight, and the American answer arrived as an announced operation rather than an inference drawn from wire chatter. Sunday's exchange could be filed as a one-off. A second round inside 48 hours, confirmed on the record and aimed at the Guard Corps directly, is a cadence.
That cadence is what the tape repriced. Roughly six months into a conflict that has produced no resolution, Persian Gulf output runs near two-thirds of pre-war levels and Crude Oil is bid again. Every escalation in the strait feeds the input-cost line the central bank says it is watching, which leaves this index exposed to the war twice over, once through sentiment and again through the discount rate the war keeps propping up.
A miss that came without price relief
The Institute for Supply Management (ISM) manufacturing Purchasing Managers Index (PMI) landed at 54.6 for August against a 55.2 consensus and 55.6 in July, with new orders down to 53.7 from 56.7 and the employment component at 51.2 from 52.8. July job openings came in at 7.271 million against 7.3 million expected. On the growth side, every line moved the way a market hoping for a slower central bank would want.
The prices paid index did not move at all. It printed 71.1 for a second month, a shade under the 72 consensus, which means the survey delivered cooling activity and static input costs in the same release. That is the arrangement that produces a hike into a slowdown rather than a pause, and it is why a real data miss bought the index about half an hour and nothing further.
The bond market is writing the discount rate
Yields did the rest of the work. The 10-year Treasury note traded up to 4.78%, its highest intraday level since January 2025, with the 30-year back near 5.30% and the two-year around 4.34%. The selling was not confined to the United States, with short-dated European and Japanese paper marked lower alongside it.
What matters for equity valuation is that the long end kept rising after the Treasury expanded its buyback operation last month, which says the pressure is not purely an expectation about policy. Heavy issuance, an elevated term premium and competition for capital all sit inside that number. A monthly factory survey does not out-argue a discount rate being set by supply.
No cut left on the board
Futures put the odds of a hike at the September 16 meeting near 68%, up from roughly 35% before the Jackson Hole keynote, and the October 28 meeting carries a 95% probability of a target range at 3.75% to 4.00% or higher. December splits close to evenly on a second move, and by the January 27 meeting the higher range is 81% priced.
The part that matters for a price-weighted index of large American companies is what the strip does beyond that. From December onward the current 3.50% to 3.75% range carries no probability at all, and every 2027 meeting on the board prices a floor of 4.00% to 4.25% or above. This is not a market discounting one hike into a passing inflation scare. It has taken the cut off a two-year horizon.
Official commentary is pulling the same way. A voting Federal Reserve governor said Tuesday morning that if inflation does not appear to be moderating sufficiently, the committee should act decisively to raise rates, and pointed at the September 15-16 meeting as the place to weigh it. The Treasury Secretary argued the opposite in public, calling this a supply shock into which a central bank does not traditionally tighten.
The numbers that carry the week
Private payrolls land Wednesday at 12:15 GMT with 48K forecast against 44K, followed by July factory orders at 14:00 GMT at 0.7% MoM after a 0.3% decline, and the Beige Book at 18:00 GMT. None of that alters a reaction function.
Thursday carries the release that does. The ISM services index arrives at 14:00 GMT with a 54.3 forecast against 54.1, its prices paid line last at 70.3 and its employment component in contraction at 47.4. Friday's August employment report is forecast at 58K after a 23K contraction, the unemployment rate held at 4.1%, and average hourly earnings accelerating to 0.3% MoM from 0.1% against 3% YoY from 3.2%. Payrolls are the advertised event, and the services price line is the one that moves the September vote.
Levels to watch
Resistance: The 53,000 handle capped the recovery attempt and now sits above the tape. Beyond it the session high area near 53,250 is the first real test, with 53,500 and the record just short of 54,750 further out.
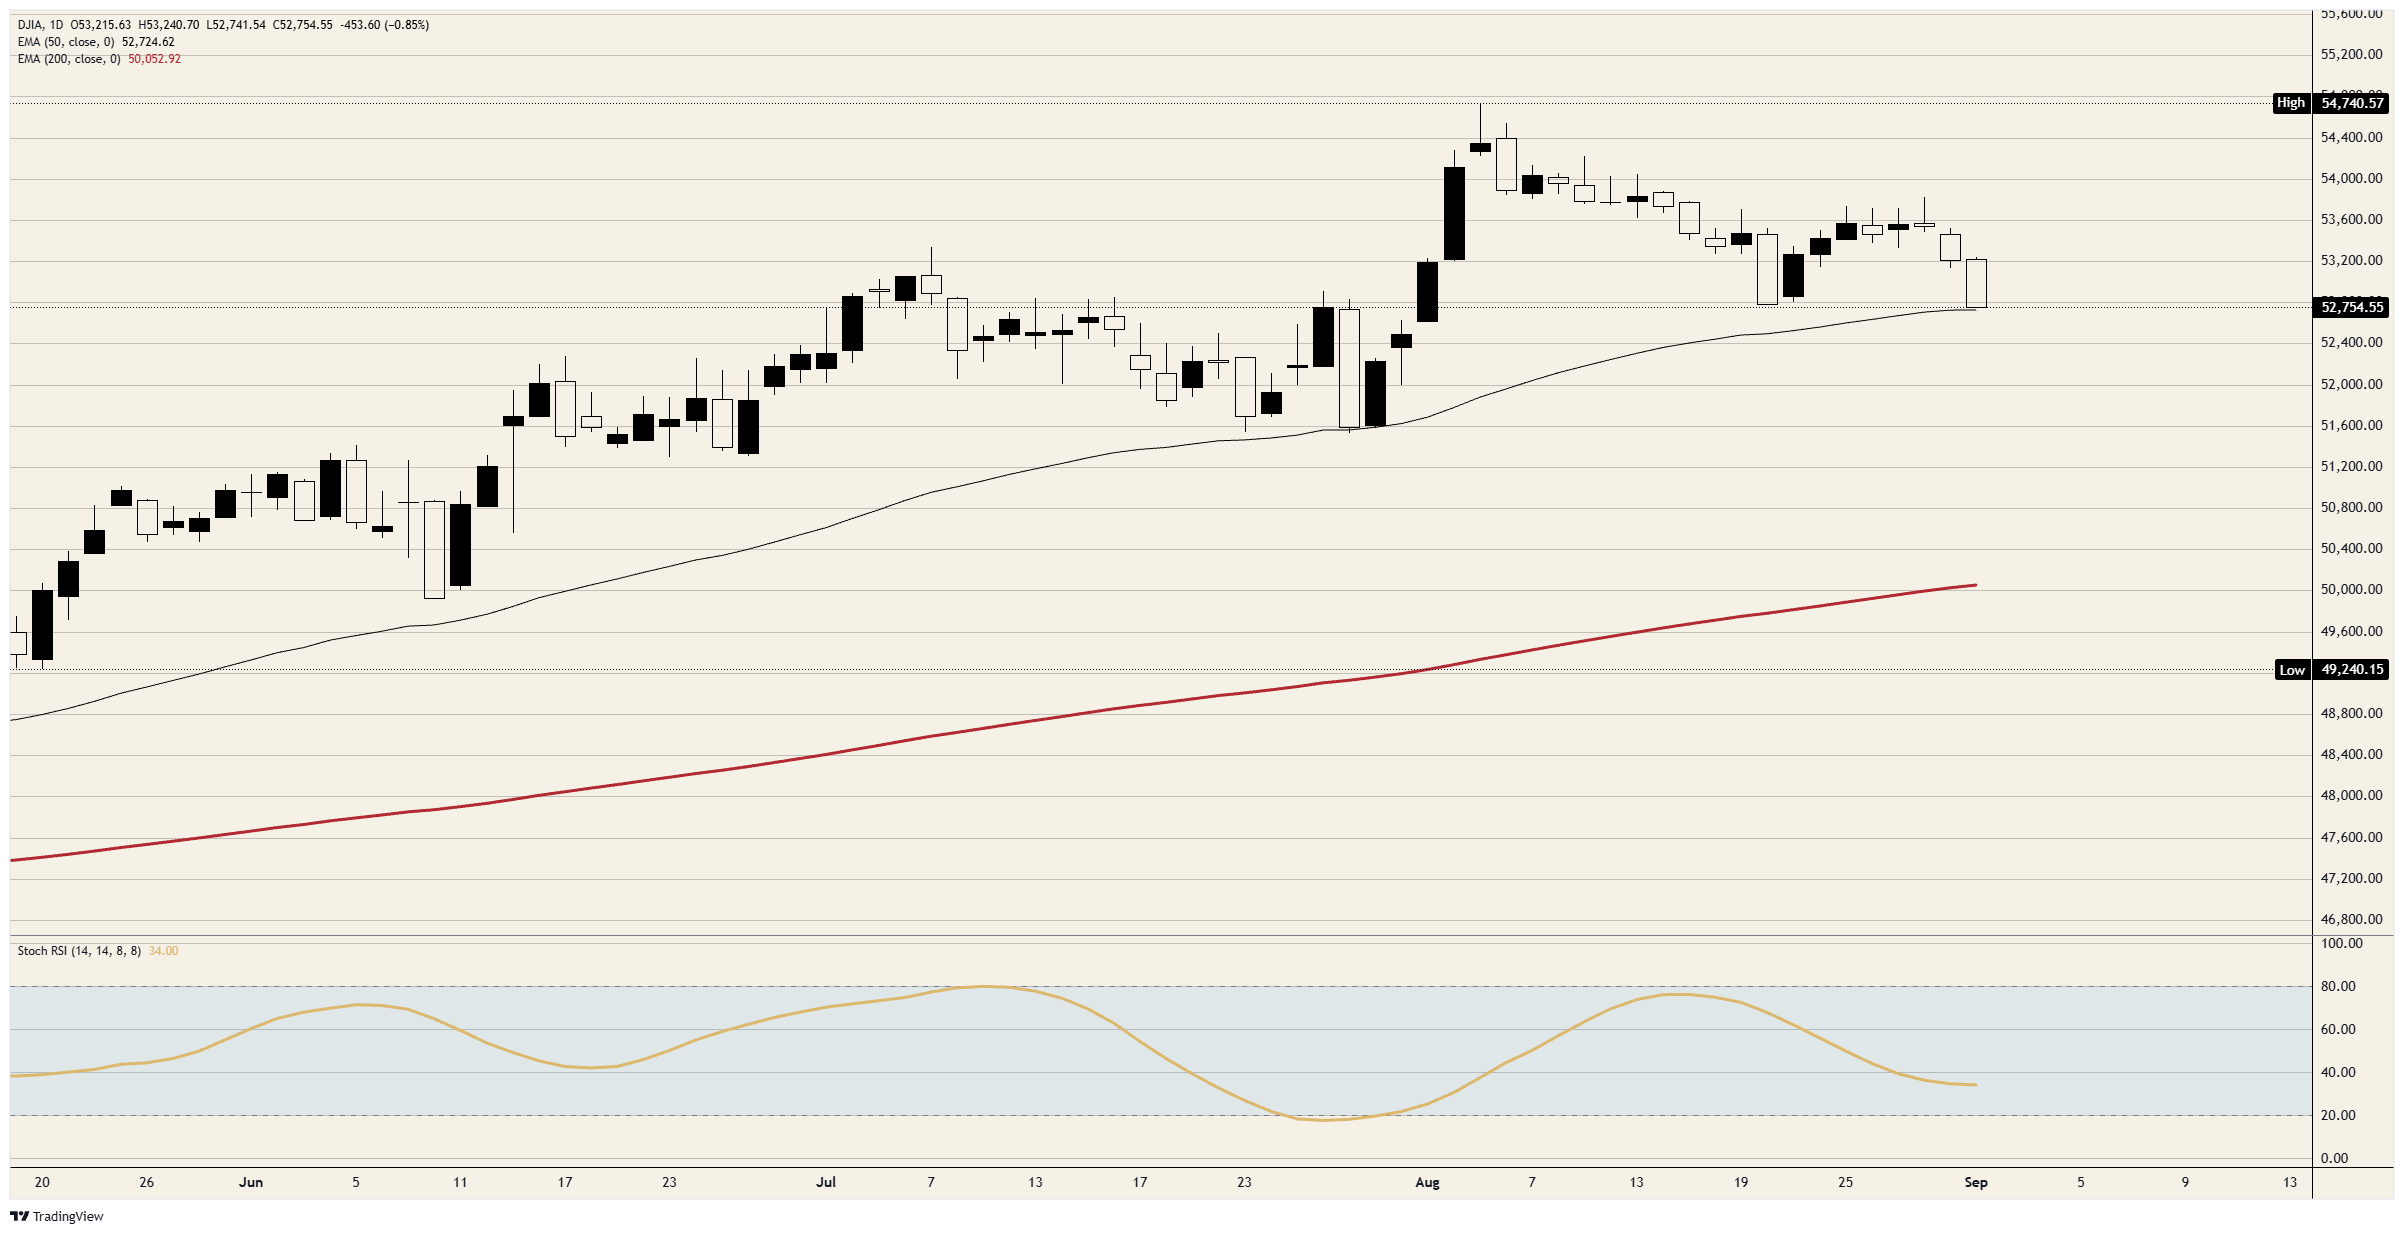
Support: The session floor sits in the 52,750 area, with the rising 50-day Exponential Moving Average (EMA) near 52,700 immediately beneath it. Losing that line removes the structure the entire August advance was built on and opens 52,500 and then the 52,000 handle, with the 200-day EMA near 50,000 nowhere in play.
Bias: Bearish. Objectives at 52,500 and then the 52,000 handle, with a daily close back above 53,250 the level that breaks the sequence. The daily Stochastic Relative Strength Index (Stoch RSI) near 34 is falling with room beneath it, and the intraday reading near 14 argues for a bounce that gets sold rather than a floor.
Dow Jones daily chart
Dow Jones FAQs
The Dow Jones Industrial Average, one of the oldest stock market indices in the world, is compiled of the 30 most traded stocks in the US. The index is price-weighted rather than weighted by capitalization. It is calculated by summing the prices of the constituent stocks and dividing them by a factor, currently 0.152. The index was founded by Charles Dow, who also founded the Wall Street Journal. In later years it has been criticized for not being broadly representative enough because it only tracks 30 conglomerates, unlike broader indices such as the S&P 500.
Many different factors drive the Dow Jones Industrial Average (DJIA). The aggregate performance of the component companies revealed in quarterly company earnings reports is the main one. US and global macroeconomic data also contributes as it impacts on investor sentiment. The level of interest rates, set by the Federal Reserve (Fed), also influences the DJIA as it affects the cost of credit, on which many corporations are heavily reliant. Therefore, inflation can be a major driver as well as other metrics which impact the Fed decisions.
Dow Theory is a method for identifying the primary trend of the stock market developed by Charles Dow. A key step is to compare the direction of the Dow Jones Industrial Average (DJIA) and the Dow Jones Transportation Average (DJTA) and only follow trends where both are moving in the same direction. Volume is a confirmatory criteria. The theory uses elements of peak and trough analysis. Dow’s theory posits three trend phases: accumulation, when smart money starts buying or selling; public participation, when the wider public joins in; and distribution, when the smart money exits.
There are a number of ways to trade the DJIA. One is to use ETFs which allow investors to trade the DJIA as a single security, rather than having to buy shares in all 30 constituent companies. A leading example is the SPDR Dow Jones Industrial Average ETF (DIA). DJIA futures contracts enable traders to speculate on the future value of the index and Options provide the right, but not the obligation, to buy or sell the index at a predetermined price in the future. Mutual funds enable investors to buy a share of a diversified portfolio of DJIA stocks thus providing exposure to the overall index.
추천 기사


