


Crude Oil goes vertical on fresh explosions in southern Iran
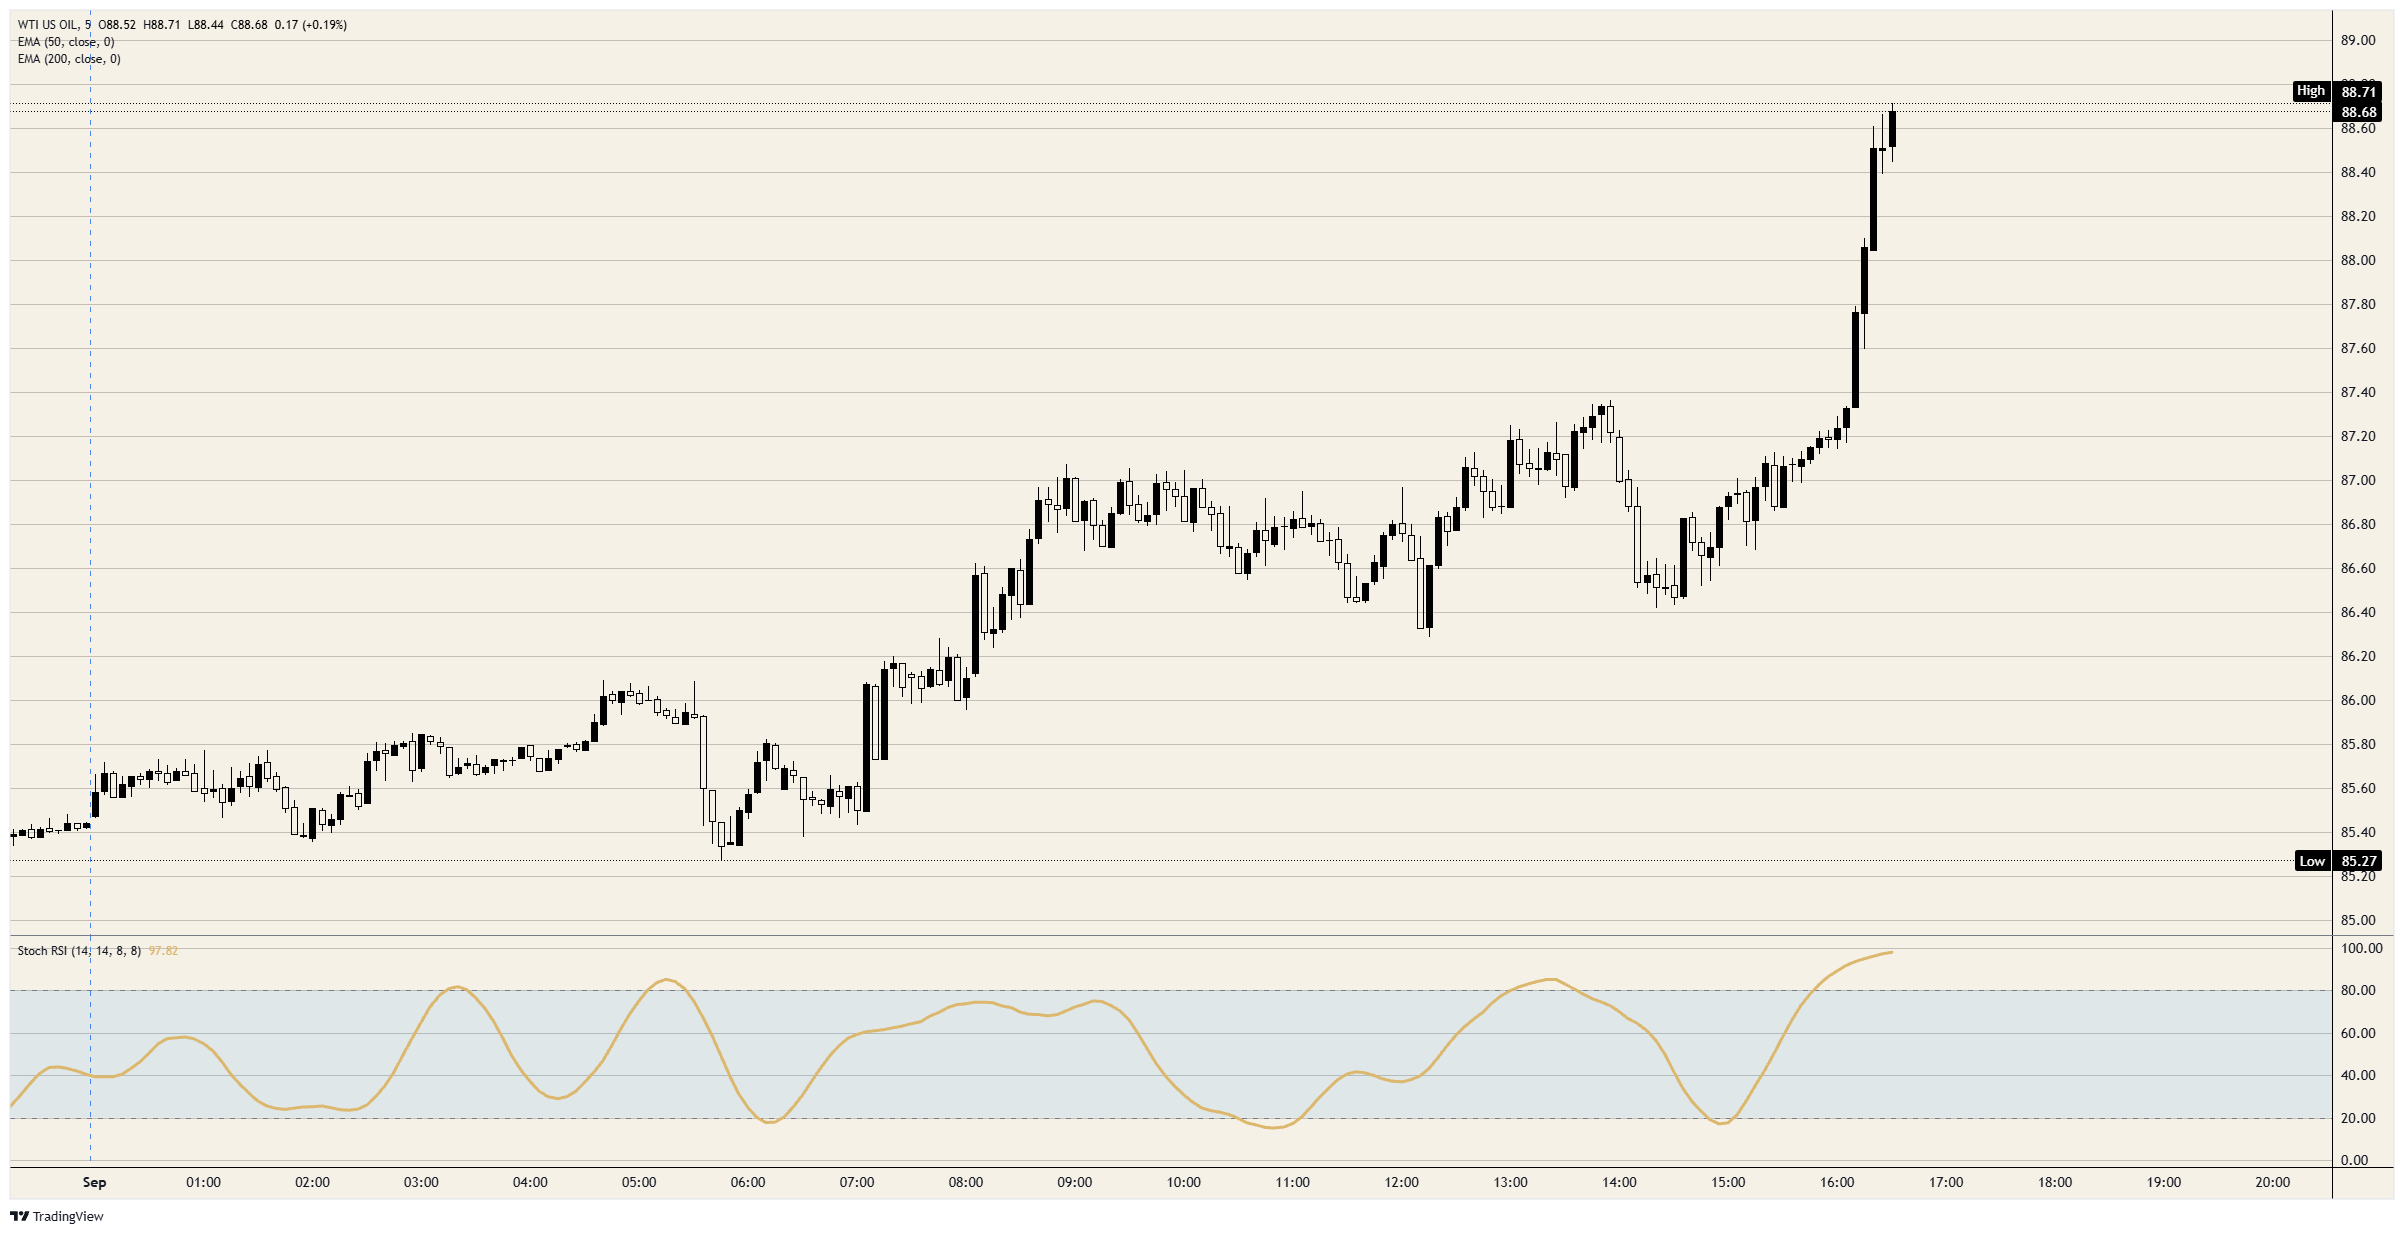
- WTI prints the session high just above $88.70, its best since late July.
- Better than a dollar and a quarter added in three five-minute bars.
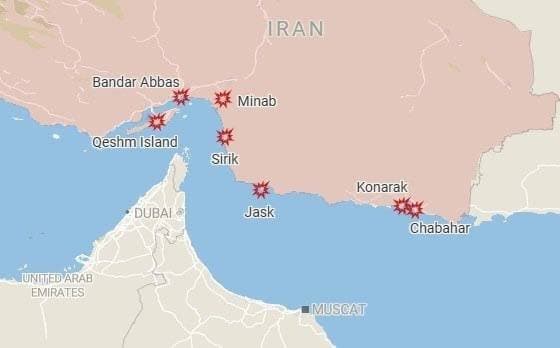
- Explosions reported at Chabahar, the one Iranian port outside the strait.
Crude Oil reached its session high in a straight line, with West Texas Intermediate (WTI) pinned near $87.50 through the afternoon before taking better than a dollar and a quarter in three consecutive five-minute bars to trade just above $88.50. Reports of explosions at Chabahar, Qeshm Island and Bandar Abbas landed inside that same window, and Brent ran with it to near $93.50.
WTI, 5-minute chart
The market is buying a programme, not a night
A vertical repricing on unconfirmed damage reports is odd until the reporting behind it is read. Coverage sourced to three United States officials has the president weighing a Central Command plan for limited strikes inside the Strait of Hormuz, aimed at stopping Iran rebuilding the radar and missile capability it uses to threaten shipping. The explosions reported today look like that plan starting.
A campaign with a stated military objective and no announced end date prices very differently from a single retaliatory night, which is why the move arrived all at once rather than in a grind. The awkward part for anyone chasing it is the objective itself. The plan exists to make the strait passable, so a version of it that works ends with more barrels moving, not fewer.
The tell sits in the spread
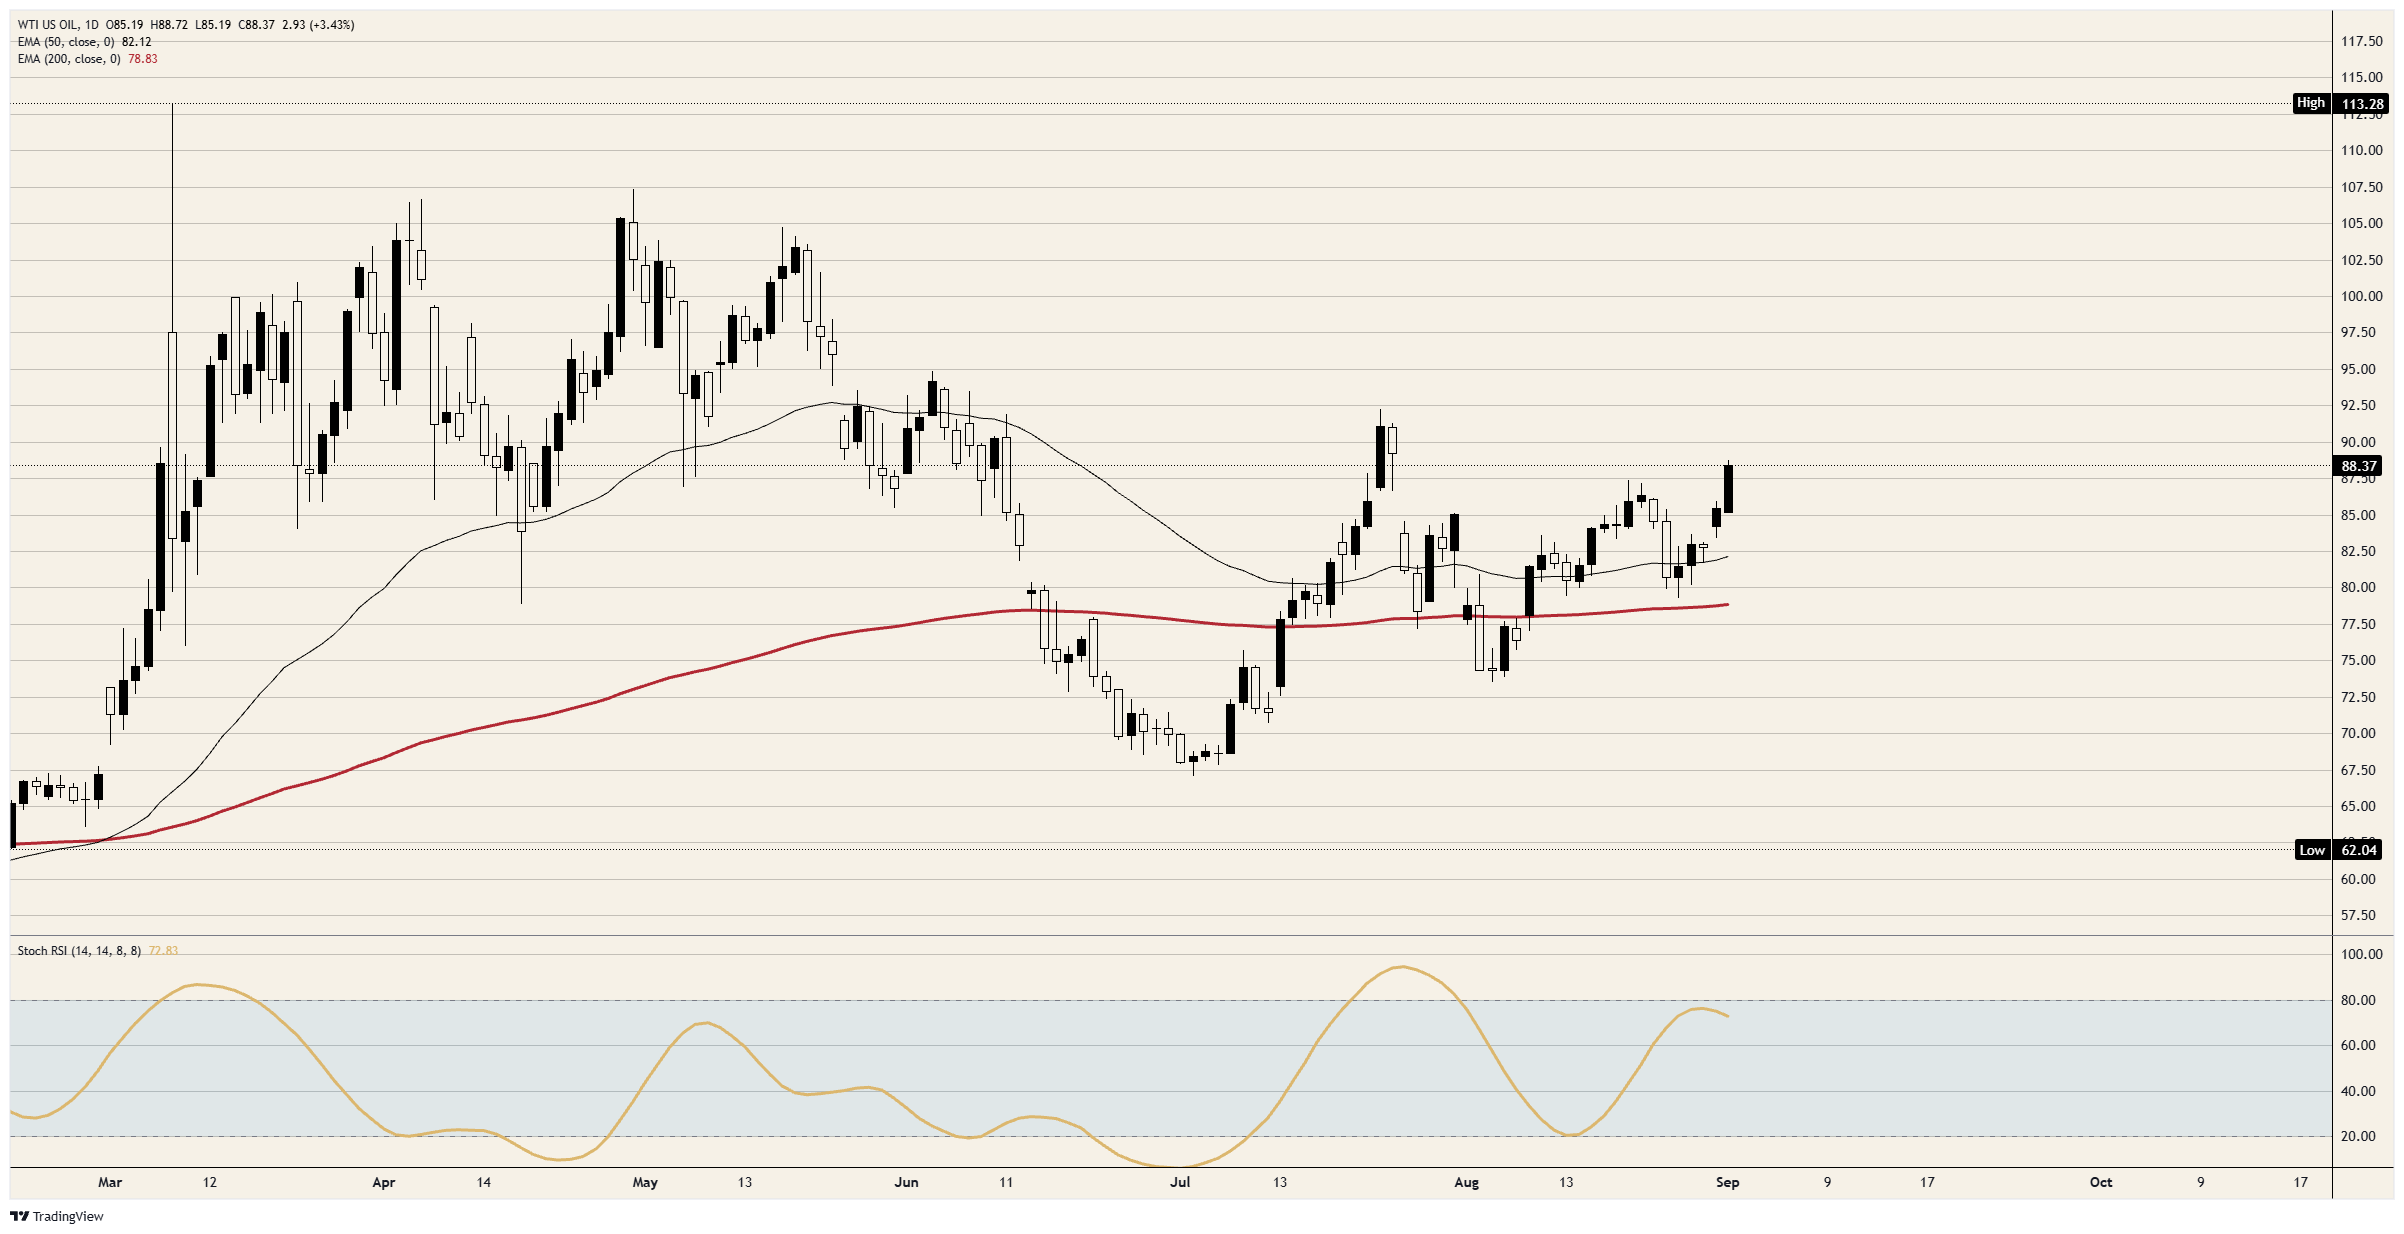
Brent prices the seaborne barrel and WTI prices the landlocked one at Cushing, so a genuine Gulf supply loss shows up first as Brent pulling away from its American counterpart. It has not. WTI cleared its August ceiling by better than a dollar while Brent cleared its own by under half of one, and the gap between them still sits just short of $5.00.
What was hit makes that flat spread stranger still, because Chabahar is Iran's only ocean port outside the Persian Gulf, sitting east of the Strait of Hormuz on the Gulf of Oman, and it has served as the workaround to the naval blockade since April, with supertankers gathering offshore and cargoes moving ship to ship beyond the patrol line. Striking it attacks export capacity rather than transit capacity, which is the difference between barrels delayed and barrels gone.
Tehran has already framed the reply, with the country's parliament speaker warning this week that if Iran is barred from exporting through the Persian Gulf, no other producer will export either. Attribution remains unconfirmed and no damage assessment exists, so the market is buying an intention rather than a shortfall.
Levels to watch
Resistance: The session high just above $88.70 caps the move, with the $89.00 handle the first round number above it. Beyond that, the late-July spike just above $92.00 is the next real mark, and Brent's equivalent sits near $96.00.
Support: The reclaimed August ceiling just short of $87.50 is the level a genuine breakout has to defend on the retest, with the session low just above $85.00 beneath it. Further back, the 50-day Exponential Moving Average (EMA) near $82.00 carries the whole August advance.
Bias: Higher while $87.50 holds on the pullback, with the late-July peak above $92.00 the objective. The 5-minute Stochastic Relative Strength Index (Stoch RSI) near 98 says the spike itself is spent and the next move is lower before it is higher, while the daily reading near 73 still has room above it. Invalidation on a daily close beneath $87.00.
WTI daily chart
WTI Oil FAQs
WTI Oil is a type of Crude Oil sold on international markets. The WTI stands for West Texas Intermediate, one of three major types including Brent and Dubai Crude. WTI is also referred to as “light” and “sweet” because of its relatively low gravity and sulfur content respectively. It is considered a high quality Oil that is easily refined. It is sourced in the United States and distributed via the Cushing hub, which is considered “The Pipeline Crossroads of the World”. It is a benchmark for the Oil market and WTI price is frequently quoted in the media.
Like all assets, supply and demand are the key drivers of WTI Oil price. As such, global growth can be a driver of increased demand and vice versa for weak global growth. Political instability, wars, and sanctions can disrupt supply and impact prices. The decisions of OPEC, a group of major Oil-producing countries, is another key driver of price. The value of the US Dollar influences the price of WTI Crude Oil, since Oil is predominantly traded in US Dollars, thus a weaker US Dollar can make Oil more affordable and vice versa.
The weekly Oil inventory reports published by the American Petroleum Institute (API) and the Energy Information Agency (EIA) impact the price of WTI Oil. Changes in inventories reflect fluctuating supply and demand. If the data shows a drop in inventories it can indicate increased demand, pushing up Oil price. Higher inventories can reflect increased supply, pushing down prices. API’s report is published every Tuesday and EIA’s the day after. Their results are usually similar, falling within 1% of each other 75% of the time. The EIA data is considered more reliable, since it is a government agency.
OPEC (Organization of the Petroleum Exporting Countries) is a group of 12 Oil-producing nations who collectively decide production quotas for member countries at twice-yearly meetings. Their decisions often impact WTI Oil prices. When OPEC decides to lower quotas, it can tighten supply, pushing up Oil prices. When OPEC increases production, it has the opposite effect. OPEC+ refers to an expanded group that includes ten extra non-OPEC members, the most notable of which is Russia.
추천 기사


