


Bitcoin and Gold Outlook: Bitcoin broadly consolidates, Gold falls as US JOLTS Job Openings rise
- Bitcoin hovers above $78,000, supported by $3.2 billion in crypto fund inflows last week.
- Gold extends its decline from August’s $4,697 peak, falling 7% to below $4,400 on Tuesday.
- US JOLTS Job Openings rise slightly to 7.271 million in July from 7.182 million in June, below the 7.3 million market expectation.
Bitcoin (BTC) maintains sideways trading around the immediate $78,000 support on Tuesday. The Crypto King outlook shows signs of cooling after the recent rally above $81,000. However, its downside remains protected, with major moving averages providing support and steady capital inflows absorbing some selling pressure.
Meanwhile, Gold (XAU/USD) maintains a neutral-to-bearish technical outlook, trading slightly below $4,400. This marks a 7% drop from its August peak of $4,697 and exerts pressure on support established by the main moving averages.
US JOLTS Job Openings tick up
United States (US) job openings edged up to 7.271 million in July from 7.182 million in June, according to the latest Bureau of Labor Statistics (BLS) release, marginally missing consensus forecasts of 7.3 million.
The BLS also noted that hires and total separations were largely unchanged at 5.1 million, with quits (3.1 million) and layoffs/discharges (1.7 million) showing minimal movement.
JOLTS figures help gauge labor demand in the world’s largest economy. However, the data is a month delayed. Although the increase is slight, it could reinforce the Federal Reserve’s (Fed) likelihood of raising interest rates, especially with inflation still above the 2% target.
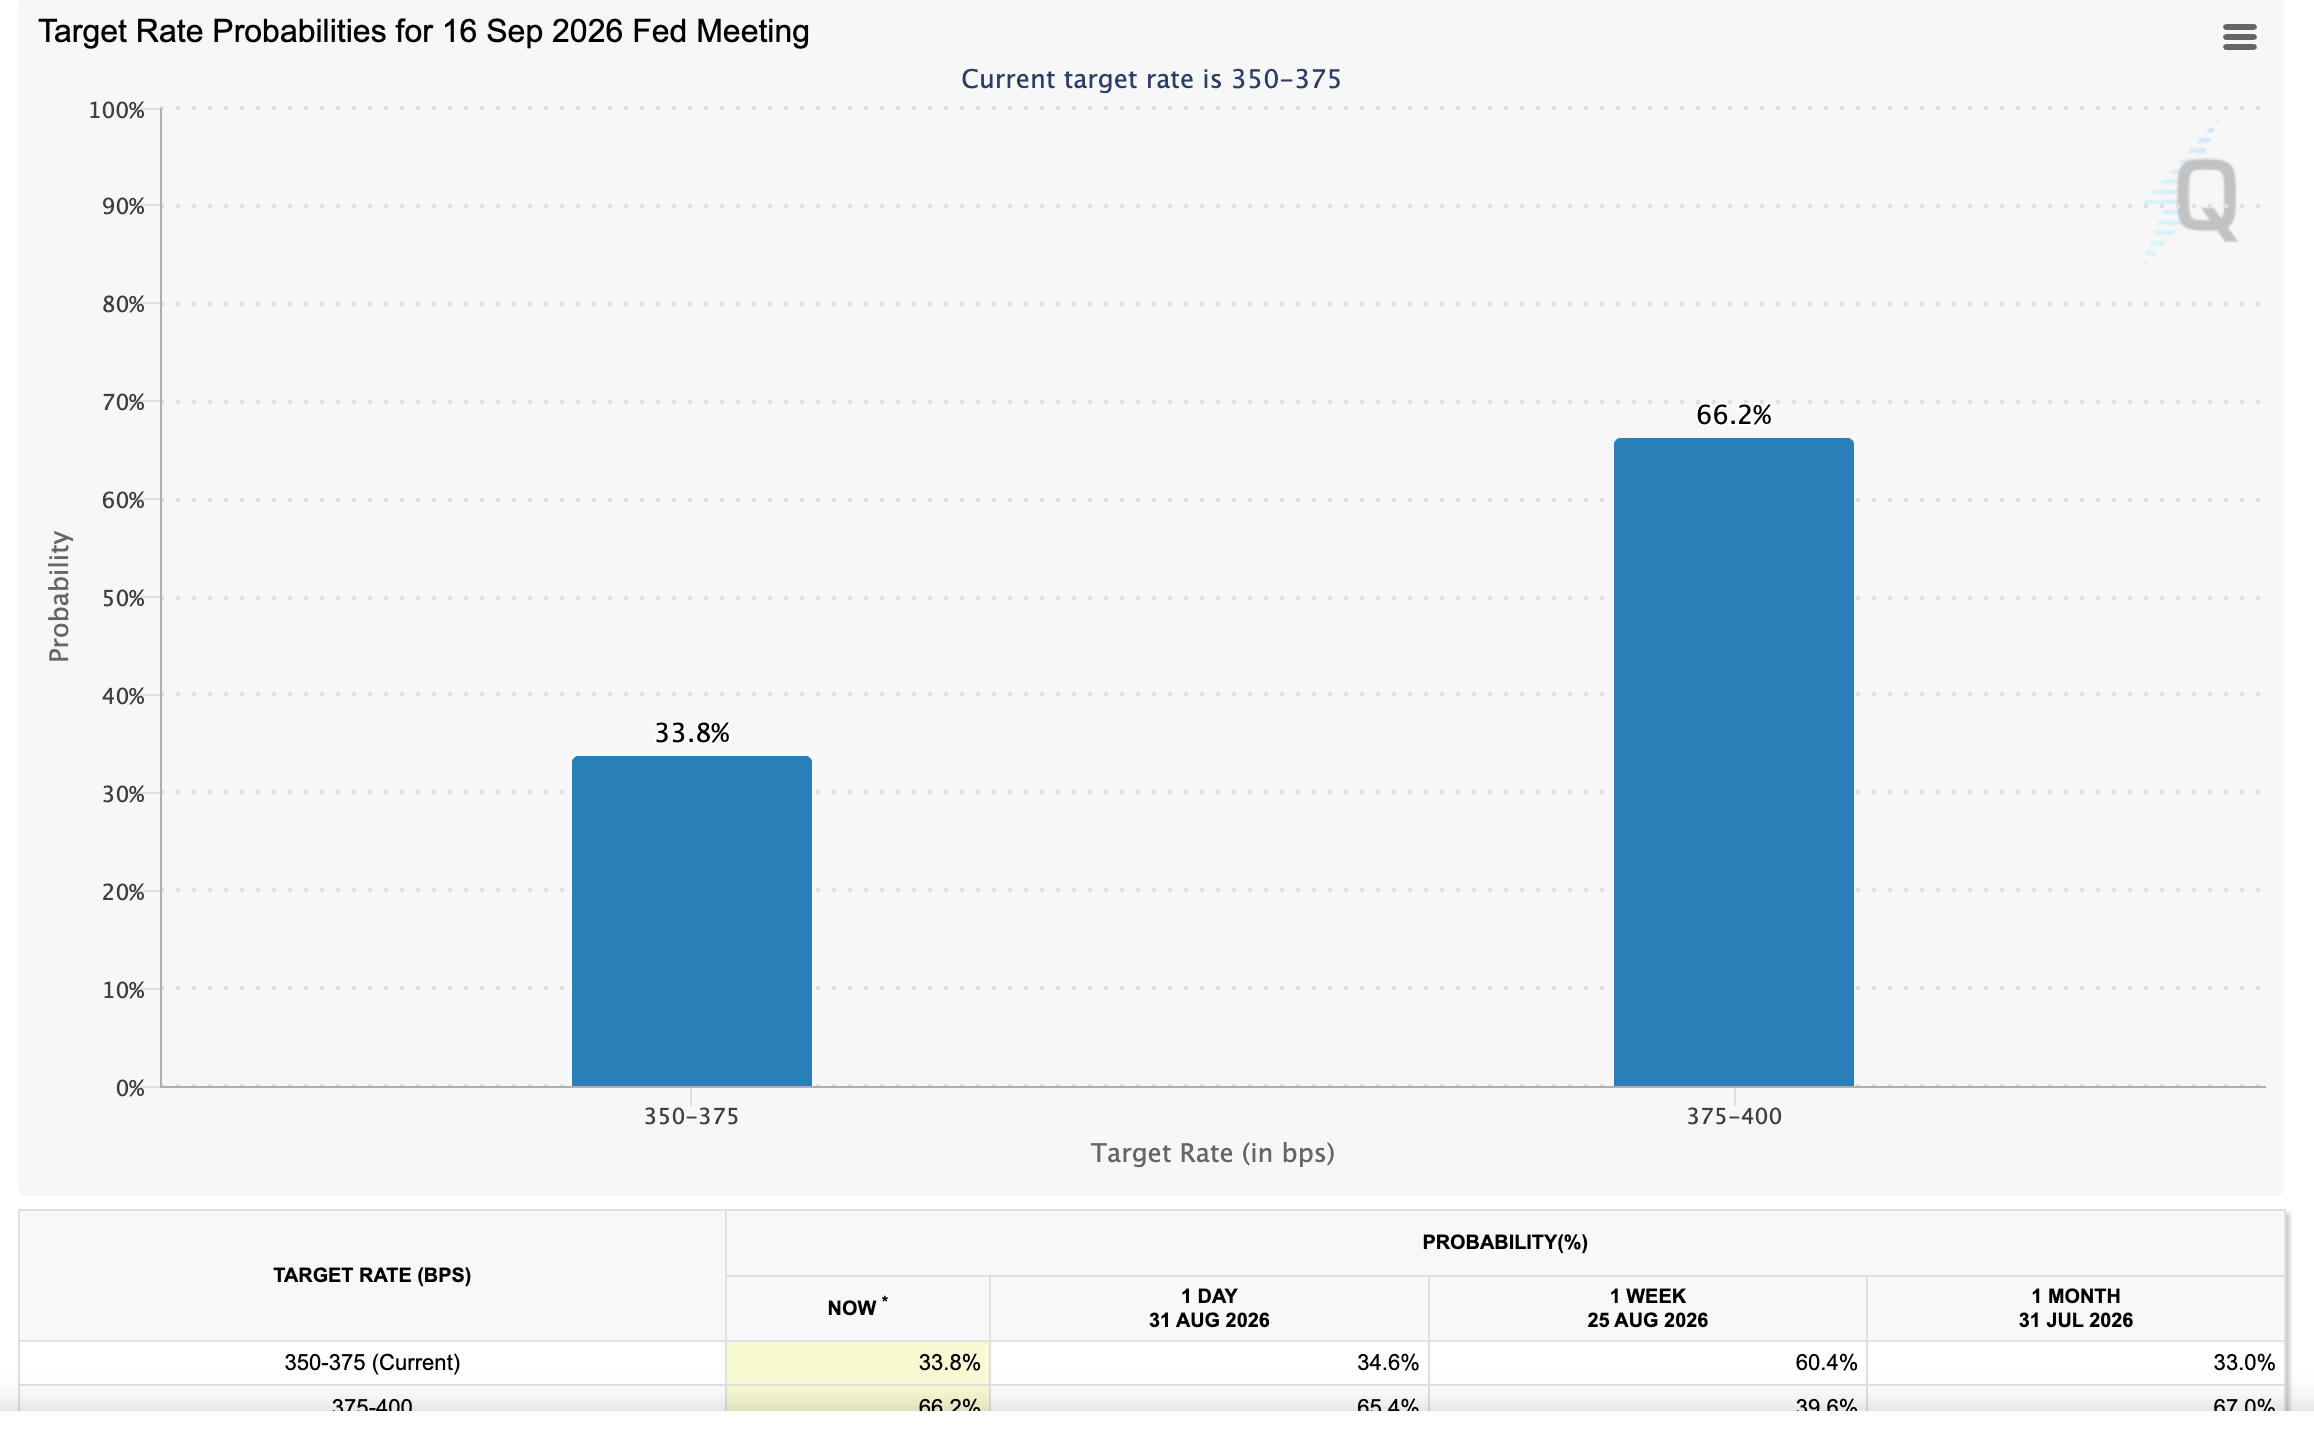
Market participants are currently pricing in a 66% probability that the Fed will increase the rates to the 3.75%-4.00% range in September’s review cycle, up from 60% last week and 33% the previous month, according to CME's FedWatch tool.
Capital inflows surge as Bitcoin stalls
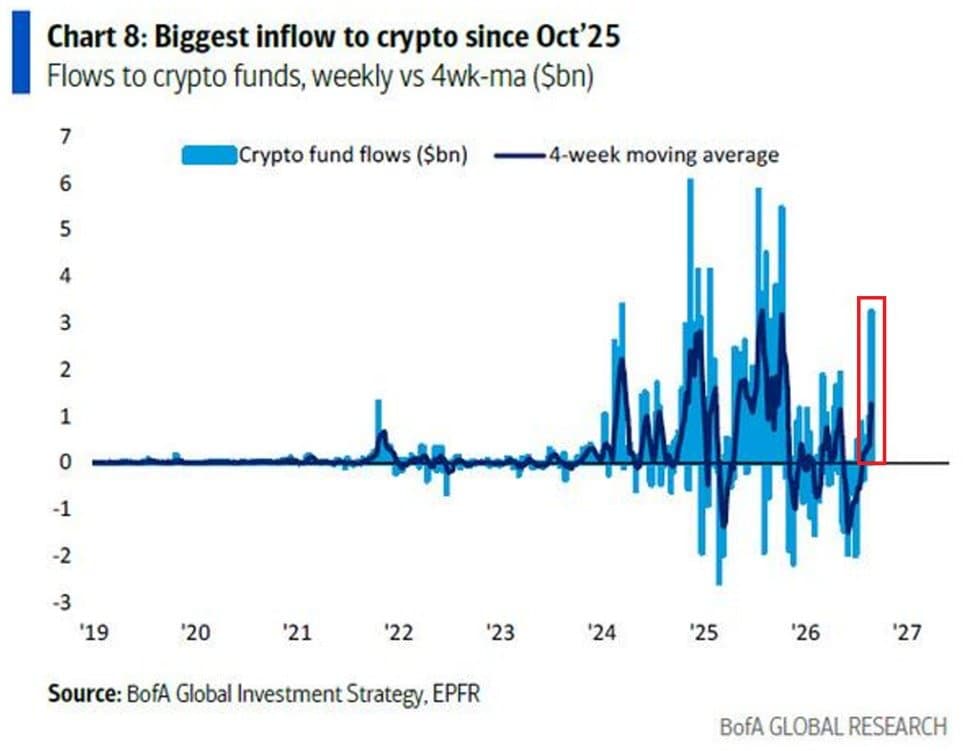
Cryptocurrency-related funds experienced a notable increase in inflows last week to more than $3.2 billion, their largest weekly intake since October 2025. BlackRock’s IBIT, the largest crypto Exchange-Traded Fund (ETF), recorded $928 million in inflows last week, building on the previous week’s $1.3 billion and marking its strongest two-week run since October 2025.
“As a result, crypto funds have averaged over $1.3 billion in weekly inflows over the last four weeks, their largest four-week average in ten months,” The Kobeissi Letter highlighted in an X post.
Meanwhile, Gold funds recorded more than $7.3 billion in inflows last week, also their largest uptake in ten months.
“Market signals remain healthy overall, with soft derivatives activity, encouraging ETF flows and spot volumes cooling from last week’s extreme levels,” K33 Research said in a weekly market report, adding “BTC is also behaving more like Gold than US equities, with its 90-day Gold correlation at an all-time high and its Nasdaq correlation near yearly lows.”
Technical analysis: Bitcoin tests short-term support
Bitcoin trades at $78,251, extending its advance well above the key Exponential Moving Averages (EMAs), suggesting a firmly bullish near-term bias with layered trend support beneath the price. Momentum remains constructive, as the Moving Average Convergence Divergence (MACD) indicator holds in positive territory with a still-above-zero line and a fading but positive profile, while the Relative Strength Index (RSI) at 69 hovers just below overbought, hinting at strong but maturing upside pressure.
-1788274172069.png)
On the downside, initial support lies at the $72,348 region marked by the 200-day EMA, which underpins the broader uptrend, followed by the 50-day EMA at $70,044 and the 100-day EMA at $69,089 as a deeper demand zone if a corrective pullback unfolds.
With no nearby technical resistance in the current dataset on the daily chart, the pair’s topside remains open, and traders will likely monitor price around the immediate $78,000 support area for signs of consolidation, especially as RSI flirts with overbought levels and MACD momentum gradually cools.
Gold technical analysis: XAU slides as support flips into resistance
Gold holds a bullish near-term bias as the metal remains above the 50-day, 100-day and 200-day EMAs, clustered between roughly $4,315 and $4,364, suggesting a still-supported uptrend despite the recent pullback.
The descending trendline now runs below the spot price, with its break point around $4,271 acting as an additional structural floor, while the RSI has eased to 48, hinting at consolidative rather than impulsive downside.
At the same time, the Moving Average Convergence Divergence (MACD) has retreated into negative territory, reinforcing waning bullish momentum rather than a full trend reversal as long as price holds above these underlying averages.
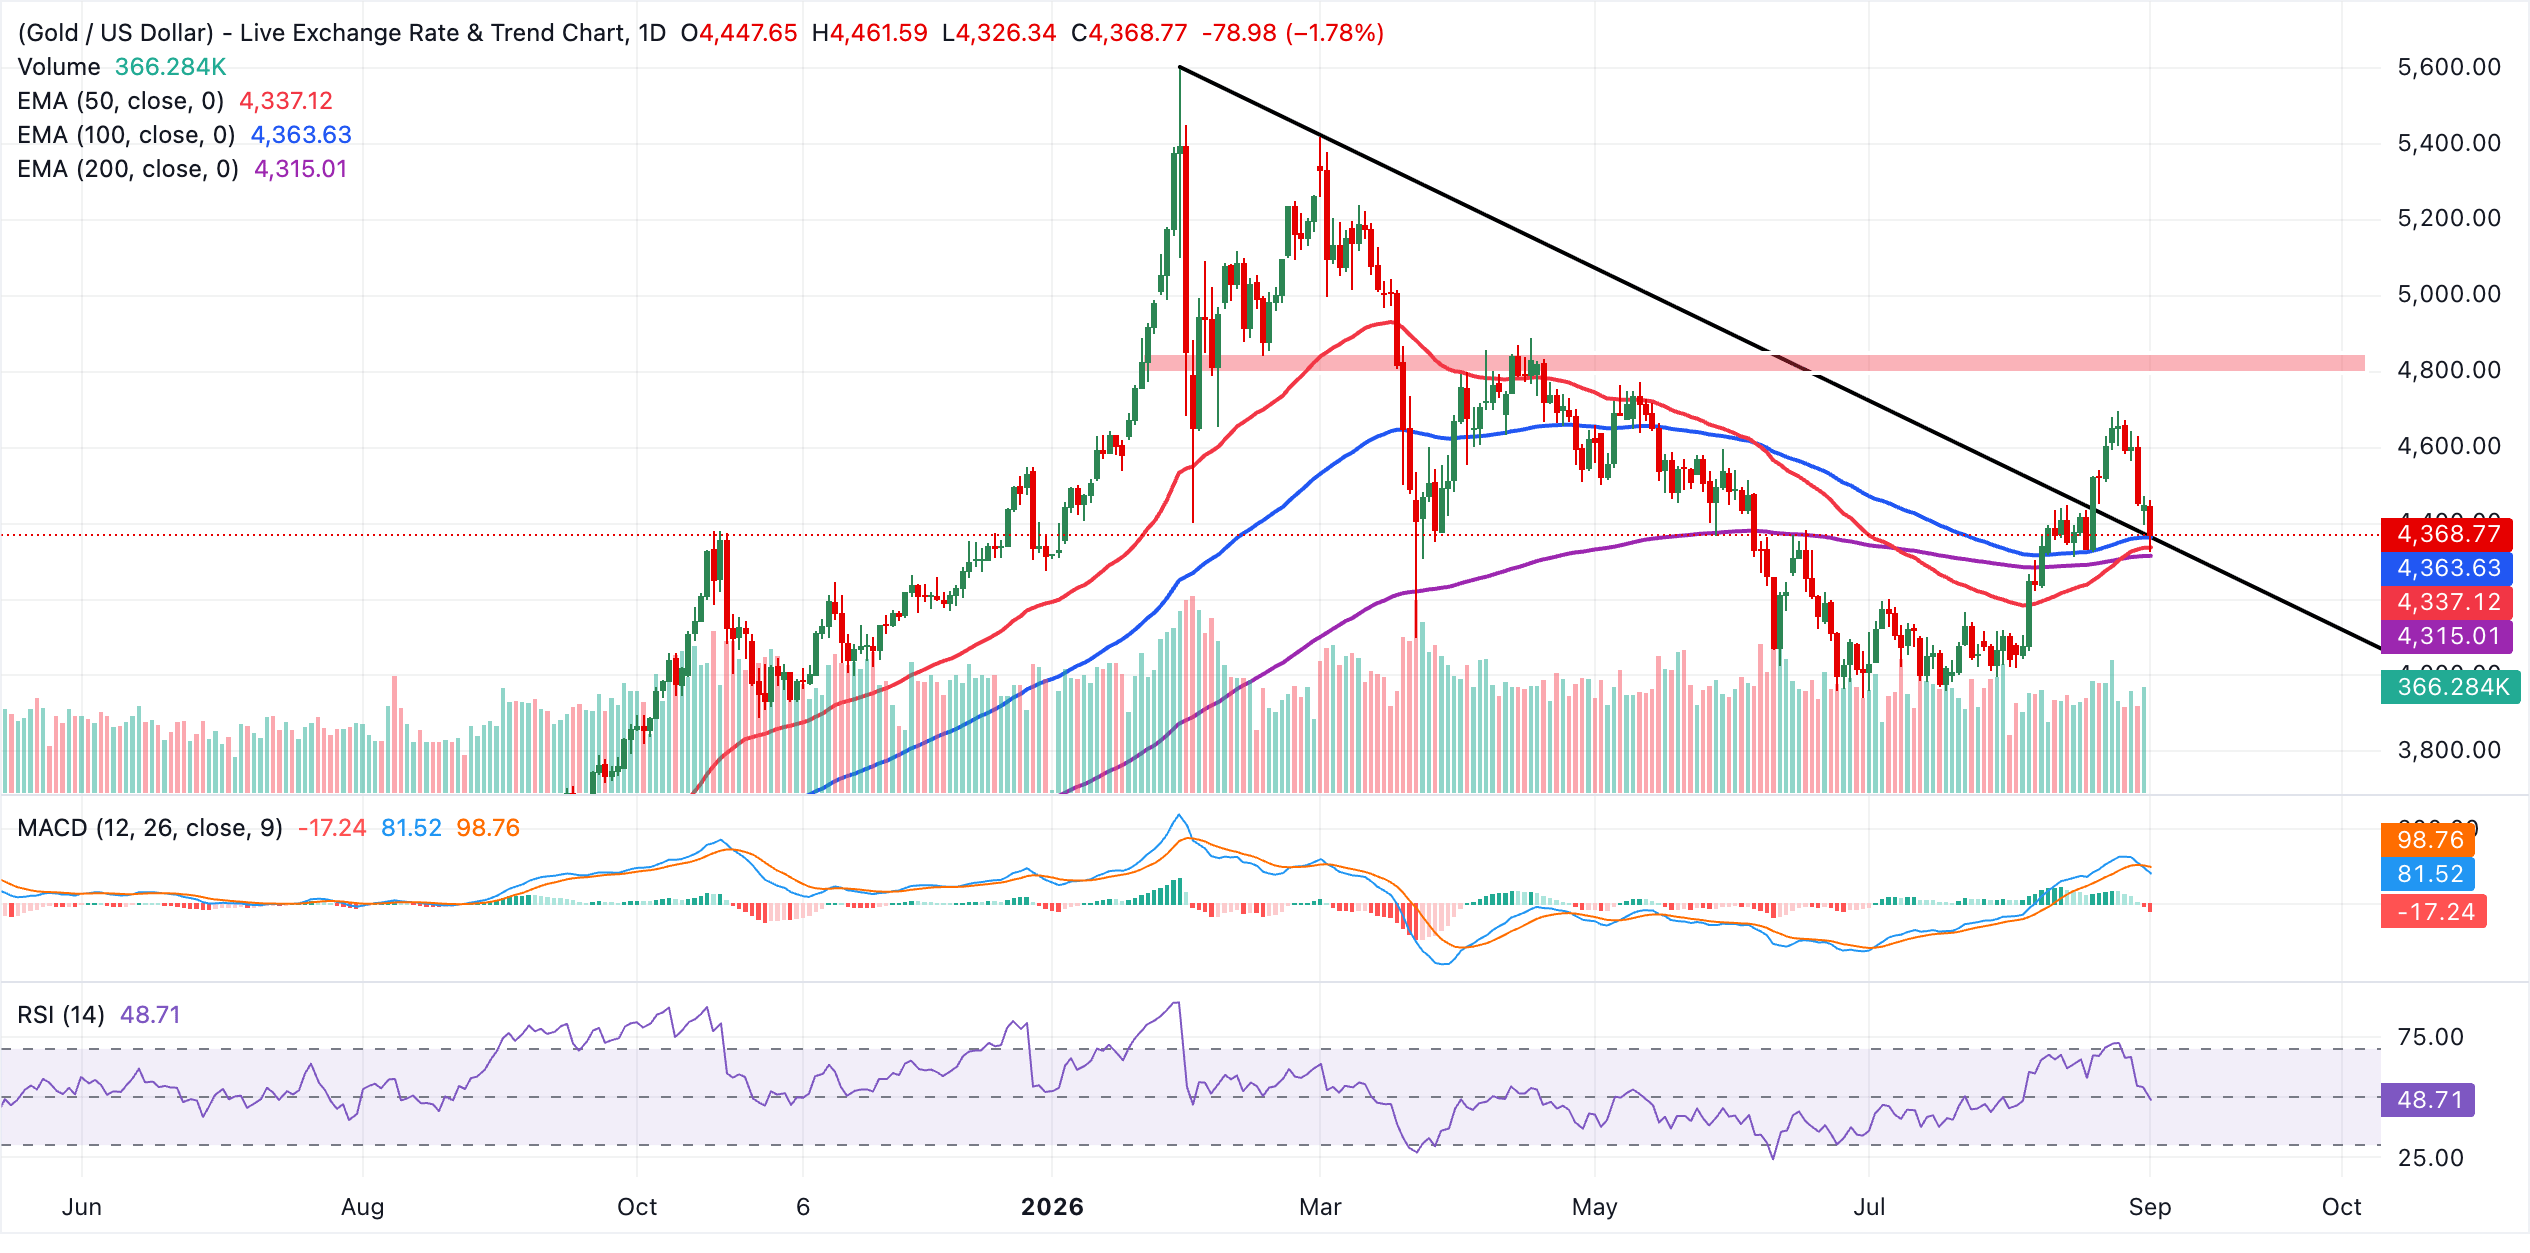
Immediate support lies at the 100-day EMA near $4,364, followed by the 50-day EMA at $4,337 and the 200-day EMA at $4,315, all forming a dense demand zone that could attract dip buyers on further weakness. Below this cluster, the descending trendline break around $4,271 is the next key level to watch, where a daily close under that area would significantly weaken the bullish structure and open the door to a deeper correction.
(The technical analysis of this story was written with the help of an AI tool. Know more.)
Bitcoin, altcoins, stablecoins FAQs
Bitcoin is the largest cryptocurrency by market capitalization, a virtual currency designed to serve as money. This form of payment cannot be controlled by any one person, group, or entity, which eliminates the need for third-party participation during financial transactions.
Altcoins are any cryptocurrency apart from Bitcoin, but some also regard Ethereum as a non-altcoin because it is from these two cryptocurrencies that forking happens. If this is true, then Litecoin is the first altcoin, forked from the Bitcoin protocol and, therefore, an “improved” version of it.
Stablecoins are cryptocurrencies designed to have a stable price, with their value backed by a reserve of the asset it represents. To achieve this, the value of any one stablecoin is pegged to a commodity or financial instrument, such as the US Dollar (USD), with its supply regulated by an algorithm or demand. The main goal of stablecoins is to provide an on/off-ramp for investors willing to trade and invest in cryptocurrencies. Stablecoins also allow investors to store value since cryptocurrencies, in general, are subject to volatility.
Bitcoin dominance is the ratio of Bitcoin's market capitalization to the total market capitalization of all cryptocurrencies combined. It provides a clear picture of Bitcoin’s interest among investors. A high BTC dominance typically happens before and during a bull run, in which investors resort to investing in relatively stable and high market capitalization cryptocurrency like Bitcoin. A drop in BTC dominance usually means that investors are moving their capital and/or profits to altcoins in a quest for higher returns, which usually triggers an explosion of altcoin rallies.
추천 기사


