


Dow Jones Industrial Average fades its own good news as the hawks take the last word
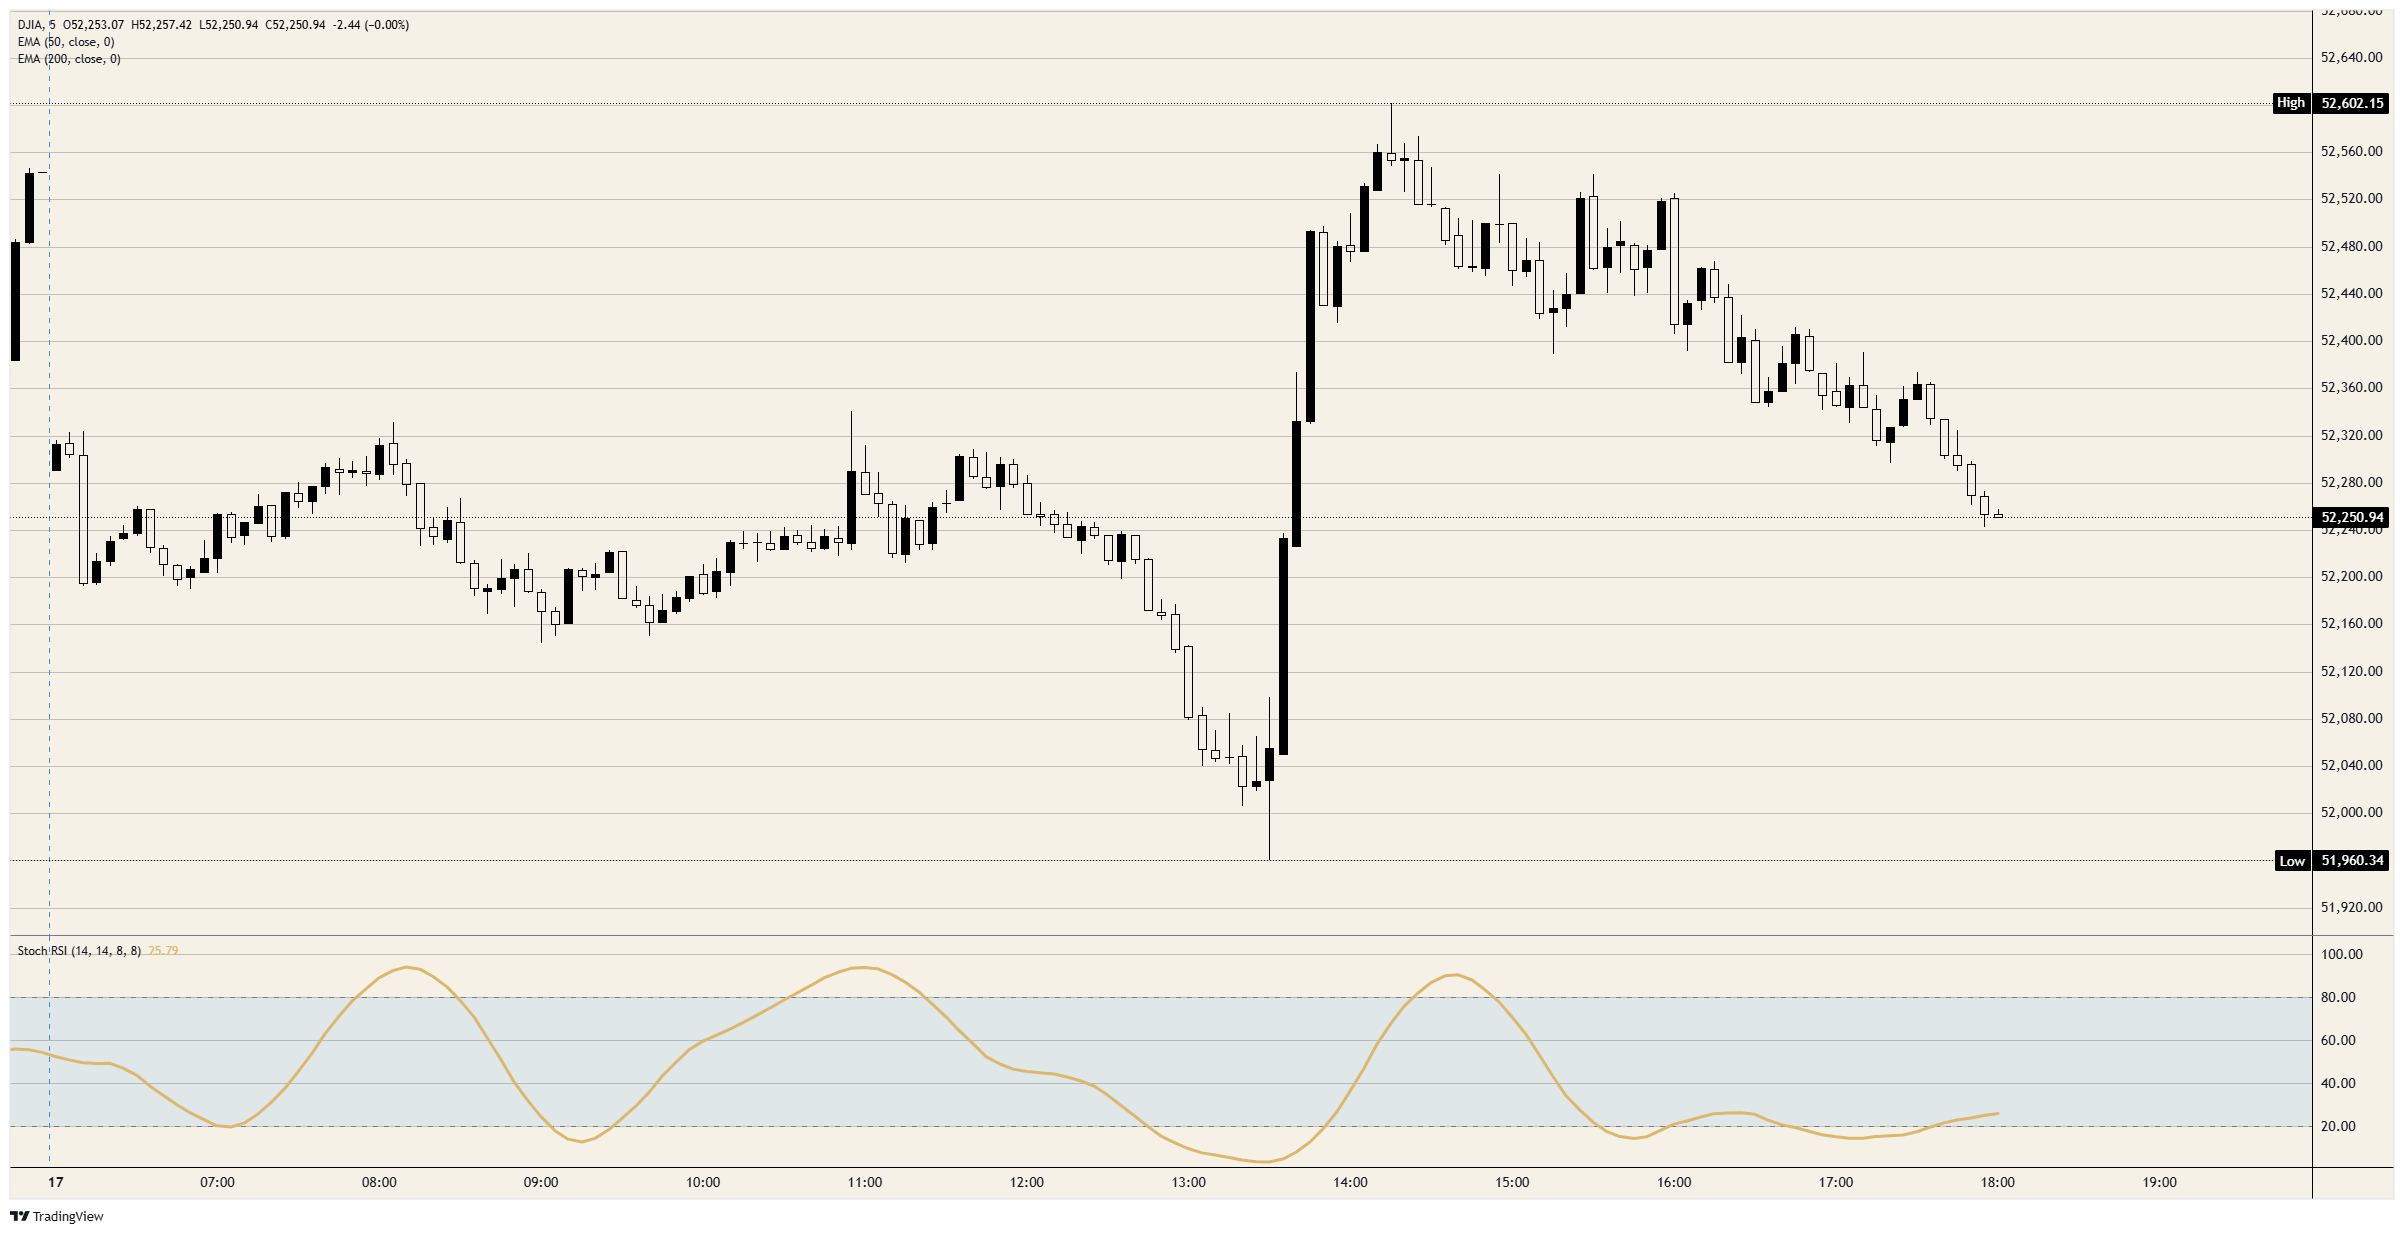
- DJIA trades near 52,250, down nearly 300 points, after fading a rally of more than 600 points sparked by the strongest consumer sentiment print since the war began.
- The final scheduled Federal Reserve speech before the pre-meeting blackout lands hawkish, with rate futures pricing close to four-in-five odds of a hike by December.
- A sixth consecutive night of American strikes and widening Iranian attacks across the Persian Gulf hold Crude Oil above $81.00 into a heavy earnings week.
The Dow Jones Industrial Average trades near 52,250 on Friday, down nearly 300 points late in the month's strangest session. The index slid to the 52,000 handle through the first half of the day, rallied more than 600 points on the strongest consumer sentiment reading since February, and has spent the afternoon handing the entire pop back to the morning range. The average still hovers near flat on the week while the broader benchmarks bleed.
Good news, promptly confiscated
The morning data offered little direction. Housing starts ran at a 1.43 million annualized pace against a 1.31 million consensus, building permits softened to roughly 1.37 million, and industrial production rose just 0.1% MoM against the 0.2% expected. The tape ground lower regardless, printing its session low just under 52,000 ahead of the 14:00 GMT slate.
The 14:00 GMT releases rewrote the session, with the University of Michigan's preliminary July sentiment index jumping to 54.4 against a 51 consensus, its strongest level since the war began in February. One-year inflation expectations fell to 4.2%, the lowest since March, while the five-year measure held at 3.3%. Algorithms did the obvious thing first and drove the index more than 600 points off the low to the 52,600 area within the hour.
The reversal came out of the same time slot. A voting Federal Reserve committee member used the final scheduled speech before the pre-meeting blackout to relay that business contacts now want action on inflation, one day after another voter argued for modestly higher rates. A cheerier consumer with cooling inflation expectations is not a reason to relax; it is permission to move.
Rate futures agree with that reading. Pricing shows roughly 86% odds of a hold on July 29, near 57% odds of at least one hike by September, and close to four-in-five odds of at least one by December. The blackout begins Saturday, which leaves Friday's hawkish read standing unanswered into the decision.
The index that skipped the problem
The weekly scoreboard explains the rotation. The S&P 500 is down more than 1% on the week and the Nasdaq more than 2%, while the semiconductor complex has shed more than 17% this month after a Chinese startup claimed its new open-source model narrows the gap with leading American artificial intelligence systems. Netflix (NFLX) trades more than 8% lower on guidance that failed to calm slowing-growth fears.
The Dow Jones Industrial Average owns almost none of that exposure, and what it does own is working. Travelers (TRV) trades more than 8% higher after reporting earnings per share of $10.04 against a $5.41 consensus on net income near $2.2 billion, the kind of print that moves a price-weighted average more than any chipmaker's apology. Even the index's tech sleeve spent the day reshuffling, with Apple (AAPL) overtaking Nvidia (NVDA) as the most valuable American company.
The macro backdrop to that rotation is a conflict widening rather than cooling. The United States Central Command (CENTCOM) reports a sixth consecutive night of strikes on dozens of targets, with the campaign now reaching bridges and interior supply routes, additional fighter aircraft moving into theatre, and the naval blockade of Iranian ports back in effect.
Iran answers across the Gulf with claimed attacks on American forces in Syria and Bahrain, a strike on a Kuwaiti desalination plant, and threats to target shipping unless American forces leave the Strait of Hormuz. Last month's ceasefire is functionally gone, and West Texas Intermediate Crude Oil holds above $81.00 with Brent above $86.00: high enough to feed the inflation story, not yet high enough to break equities, and exactly the mix that favours industrial cash flow over long-duration tech.
One real print buried in an earnings pile
Next week's calendar belongs to earnings first, with 3M (MMM) on Tuesday, IBM (IBM) on Wednesday, Honeywell (HON) on Thursday, and American Express (AXP) alongside Verizon (VZ) on Friday, all reporting after an insurer just reset the bar for what a Dow beat looks like. Wednesday's results from Alphabet (GOOGL) and Tesla (TSLA) are the events the wider tape trades against, and any fresh wobble in artificial intelligence capital spending lands on the Nasdaq's side of the ledger.
The macro slate is thinner but carries the week's only decisive print. A four-week ADP payroll average arrives Tuesday at 12:15 GMT and jobless claims follow Thursday at 12:30 GMT with a 212K consensus against 208K previously. The red-band events, the preliminary S&P Global Manufacturing and Services Purchasing Managers Index (PMI) readings, land Friday at 13:45 GMT against priors of 53.9 and 51.2, with June new home sales due at 14:00 GMT.
With the committee silent until the July 29 decision, Friday's PMI prints are the last top-tier evidence either camp receives. A hot manufacturing number with Crude Oil input costs at these levels would harden the hike case into the meeting, while a miss hands the doves their only scheduled lifeline.
Resistance, support, and bias
Resistance: The 52,600 area capped Friday's rally and stands as the first hurdle, ahead of the 52,800 shelf that has turned the tape back since the record run. Beyond that, the all-time high just above 53,300 remains the level the bulls surrendered earlier this month.
Support: Friday's dip just under 52,000 is the level that matters into next week. Losing it opens the 51,400 area, where the rising 50-day Exponential Moving Average (EMA) offers the first dynamic floor.
Bias: Bearish. The daily Stochastic Relative Strength Index curls lower from the overbought boundary, the index prints lower highs beneath its record, and the rate story now works against equities into a silent central bank. Rallies toward the 52,600 area are for selling, and only a daily close above 52,800 puts the record back in play.
Dow Jones 5-minute chart
Dow Jones FAQs
The Dow Jones Industrial Average, one of the oldest stock market indices in the world, is compiled of the 30 most traded stocks in the US. The index is price-weighted rather than weighted by capitalization. It is calculated by summing the prices of the constituent stocks and dividing them by a factor, currently 0.152. The index was founded by Charles Dow, who also founded the Wall Street Journal. In later years it has been criticized for not being broadly representative enough because it only tracks 30 conglomerates, unlike broader indices such as the S&P 500.
Many different factors drive the Dow Jones Industrial Average (DJIA). The aggregate performance of the component companies revealed in quarterly company earnings reports is the main one. US and global macroeconomic data also contributes as it impacts on investor sentiment. The level of interest rates, set by the Federal Reserve (Fed), also influences the DJIA as it affects the cost of credit, on which many corporations are heavily reliant. Therefore, inflation can be a major driver as well as other metrics which impact the Fed decisions.
Dow Theory is a method for identifying the primary trend of the stock market developed by Charles Dow. A key step is to compare the direction of the Dow Jones Industrial Average (DJIA) and the Dow Jones Transportation Average (DJTA) and only follow trends where both are moving in the same direction. Volume is a confirmatory criteria. The theory uses elements of peak and trough analysis. Dow’s theory posits three trend phases: accumulation, when smart money starts buying or selling; public participation, when the wider public joins in; and distribution, when the smart money exits.
There are a number of ways to trade the DJIA. One is to use ETFs which allow investors to trade the DJIA as a single security, rather than having to buy shares in all 30 constituent companies. A leading example is the SPDR Dow Jones Industrial Average ETF (DIA). DJIA futures contracts enable traders to speculate on the future value of the index and Options provide the right, but not the obligation, to buy or sell the index at a predetermined price in the future. Mutual funds enable investors to buy a share of a diversified portfolio of DJIA stocks thus providing exposure to the overall index.
추천 기사


