
Dow Jones Industrial Average slows to a crawl as investors watch shutdown headlines
- The Dow Jones remains stuck in a near-term range near 46,500.
- Equity markets have hit a slow patch as the US government shutdown grinds on.
- Key US economic data may be suspended or delayed amid federal closures.
The Dow Jones Industrial Average (DJIA) flattened on Thursday, sticking close to the 46,500 region as equity markets hunker down to wait out the US federal government’s shutdown. This week’s key US labor and wages data dump is unlikely to be released after the Bureau of Labor Statistics (BLS) warned that a government shutdown would result in the latest Nonfarm Payrolls (NFP) jobs report being delayed or suspended until government operations resume.
Government shutdown limits data releases
Investors are banking on the latest government shutdown having a limited impact on economic factors. Traders largely expect this closure to be short-lived, and overall market focus remains pinned firmly on Federal Reserve (Fed) interest rate cuts through the remainder of the calendar year.
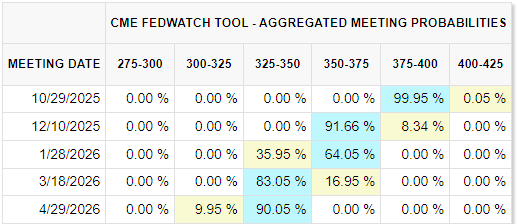
According to the CME’s FedWatch Tool, rate markets have fully priced in a follow-up interest rate cut on October 29, with over 90% odds of getting a third straight rate trim on December 10. Rate traders are also expecting the Fed to deliver a fourth quarter-point rate cut in either March or April of next year.
According to various sources, the latest NFP jobs report is ready to be released, but BLS operational guidelines mean labor data will be withheld during a government shutdown. The latest weekly Initial Jobless Claims data was not reported this week, despite being collected and compiled prior to the government shutdown. Unless the Trump administration specifically moves to publish the latest jobs figures, this week’s NFP print will remain in limbo pending the return of the US government.
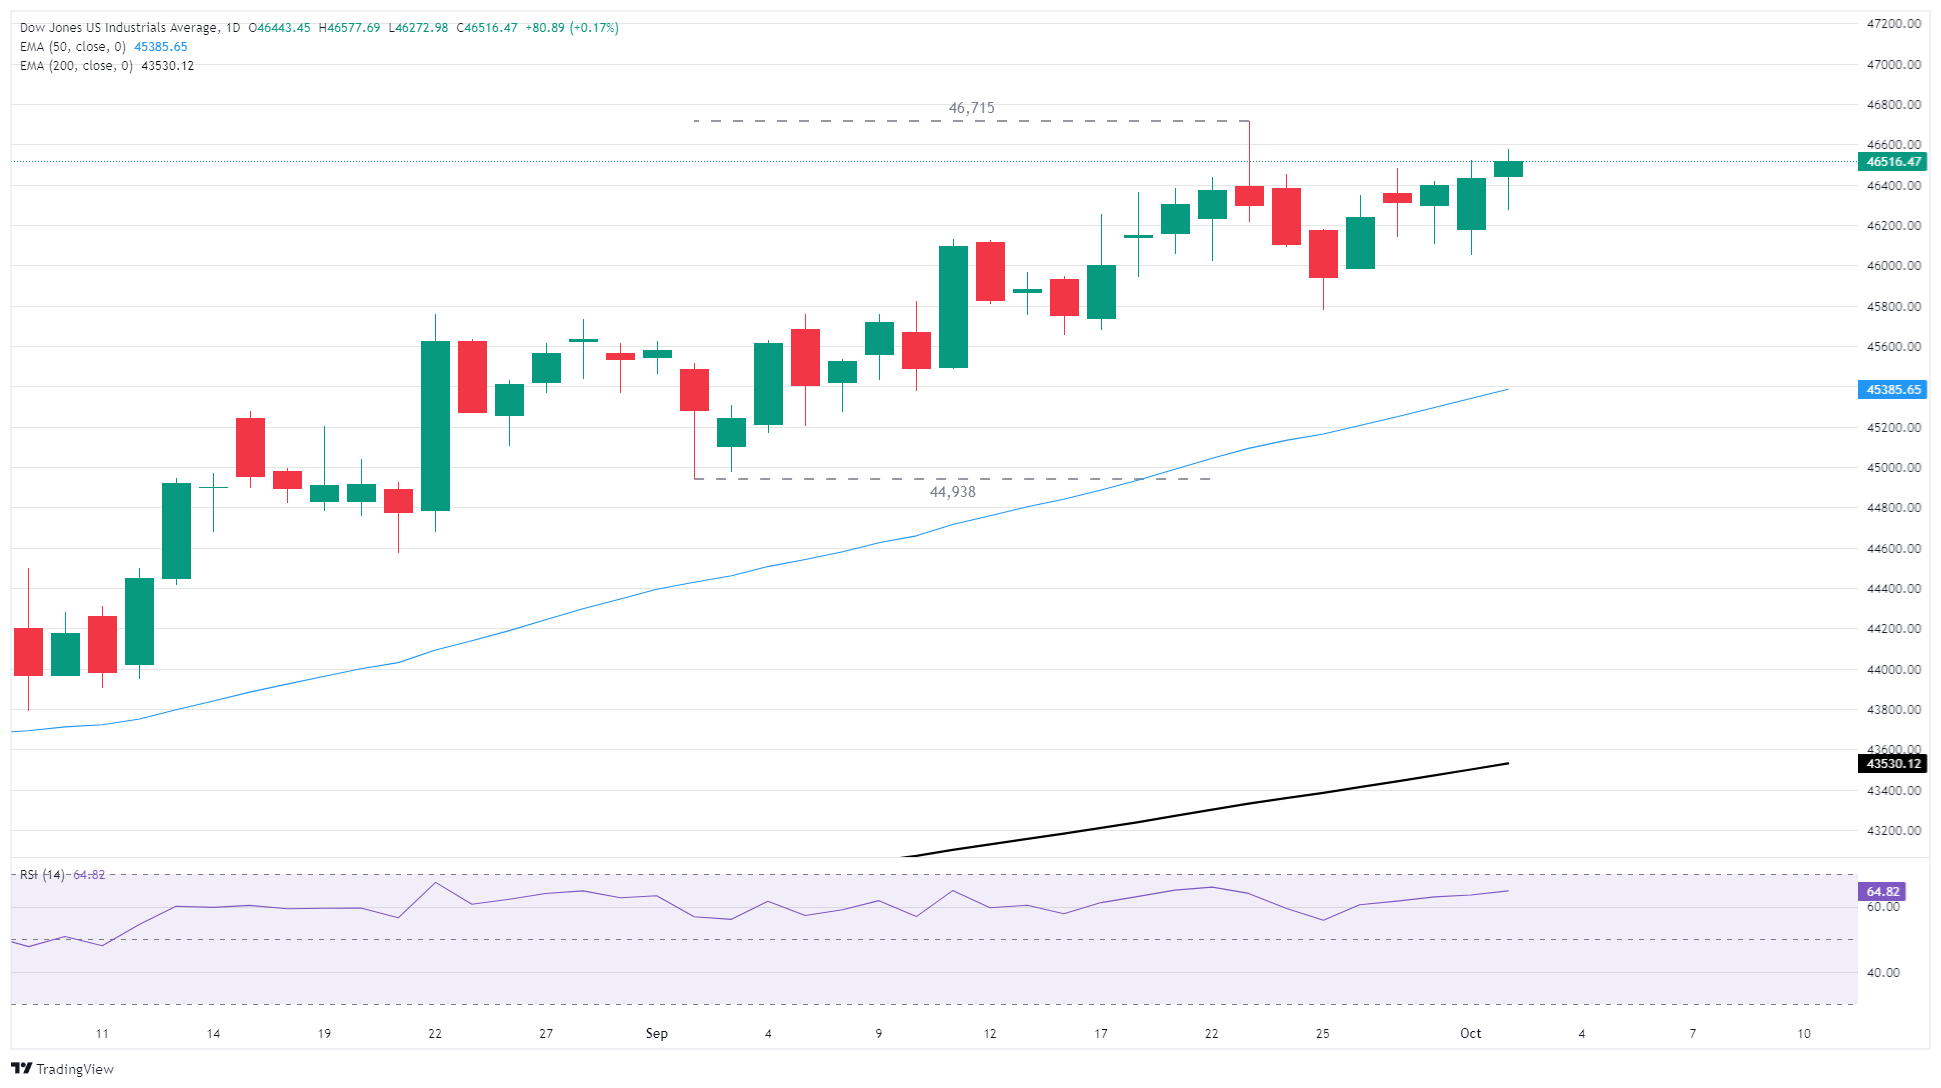
Dow Jones daily chart
Dow Jones FAQs
The Dow Jones Industrial Average, one of the oldest stock market indices in the world, is compiled of the 30 most traded stocks in the US. The index is price-weighted rather than weighted by capitalization. It is calculated by summing the prices of the constituent stocks and dividing them by a factor, currently 0.152. The index was founded by Charles Dow, who also founded the Wall Street Journal. In later years it has been criticized for not being broadly representative enough because it only tracks 30 conglomerates, unlike broader indices such as the S&P 500.
Many different factors drive the Dow Jones Industrial Average (DJIA). The aggregate performance of the component companies revealed in quarterly company earnings reports is the main one. US and global macroeconomic data also contributes as it impacts on investor sentiment. The level of interest rates, set by the Federal Reserve (Fed), also influences the DJIA as it affects the cost of credit, on which many corporations are heavily reliant. Therefore, inflation can be a major driver as well as other metrics which impact the Fed decisions.
Dow Theory is a method for identifying the primary trend of the stock market developed by Charles Dow. A key step is to compare the direction of the Dow Jones Industrial Average (DJIA) and the Dow Jones Transportation Average (DJTA) and only follow trends where both are moving in the same direction. Volume is a confirmatory criteria. The theory uses elements of peak and trough analysis. Dow’s theory posits three trend phases: accumulation, when smart money starts buying or selling; public participation, when the wider public joins in; and distribution, when the smart money exits.
There are a number of ways to trade the DJIA. One is to use ETFs which allow investors to trade the DJIA as a single security, rather than having to buy shares in all 30 constituent companies. A leading example is the SPDR Dow Jones Industrial Average ETF (DIA). DJIA futures contracts enable traders to speculate on the future value of the index and Options provide the right, but not the obligation, to buy or sell the index at a predetermined price in the future. Mutual funds enable investors to buy a share of a diversified portfolio of DJIA stocks thus providing exposure to the overall index.
추천 기사


