
Bitcoin Weekly Forecast: Slow but positive start
- Bitcoin price edges slightly down, trading around $96,500 on Friday after recovering over 2.5% this week.
- Bitcoin’s historical monthly returns data shows BTC generally yielded modest returns for traders in January, averaging 3.35%.
- On-chain data suggests the bull market is still intact, and the current phase appears to be a cooling-off period rather than a cycle peak.
Bitcoin (BTC) edges slightly lower, trading around $96,500 on Friday after an over 2.5% recovery this week, with historical data showing modest average January returns of 3.35%. On-chain metrics suggest the bull market remains intact, indicating a cooling-off phase rather than a cycle peak.
Bitcoin’s January returns were historically modest, followed by weakening demand this week
Bitcoin began the year with a modest recovery, trading above $96,000 on Friday, following a more than 10% drop over the past two weeks after reaching a record high of $108,353 on December 17, 2024.
According to Bitcoin’s historical monthly returns, BTC generally yielded modest returns for traders in January, with an average of 3.35%.
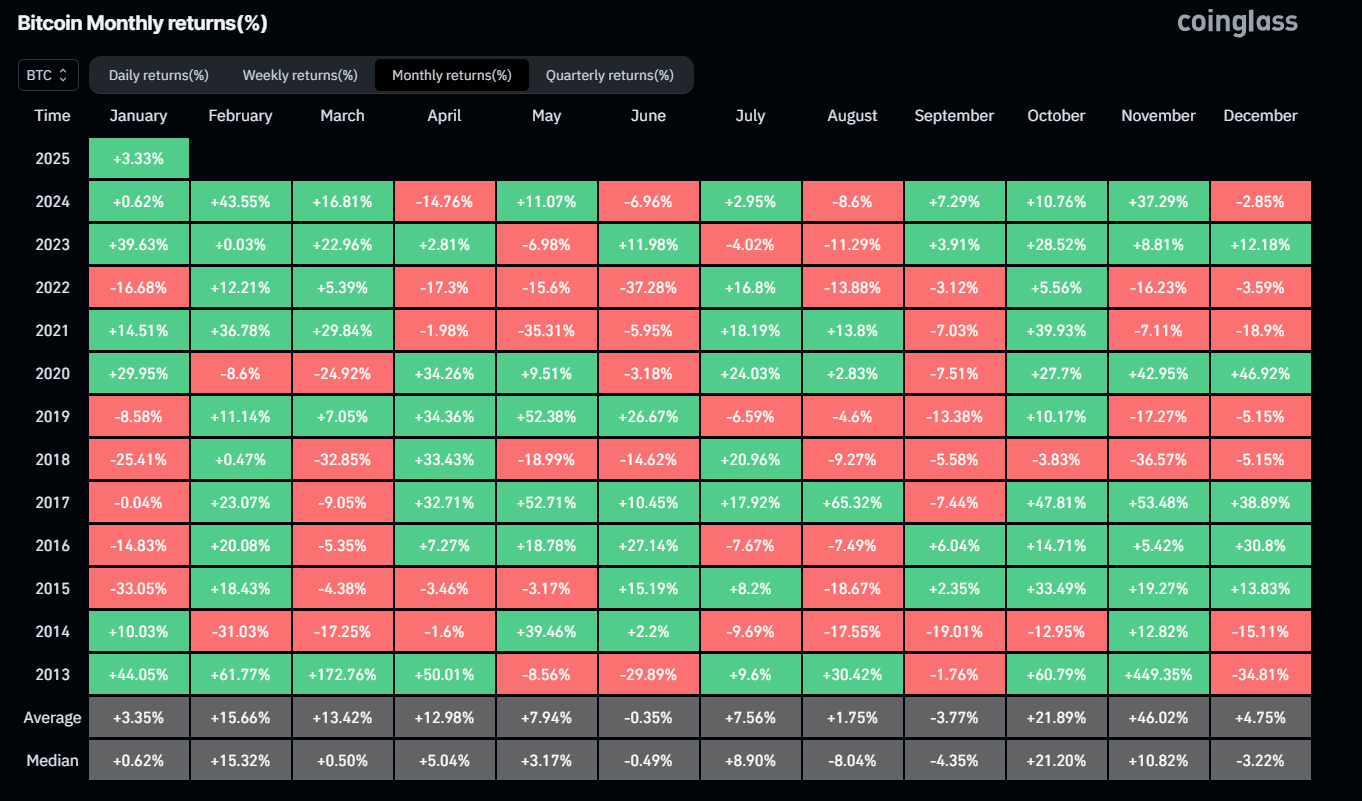
Bitcoin Monthly returns chart. Source: Coinglass
Institutional demand continued to weaken this week. According to Coinglass, Bitcoin Spot Exchange Traded Funds (ETF) data recorded a total net outflow of $657.6 million until Thursday, after a $377.6 million outflow last week. If the outflow intensifies or persists, it could lead to a decline in Bitcoin’s price.
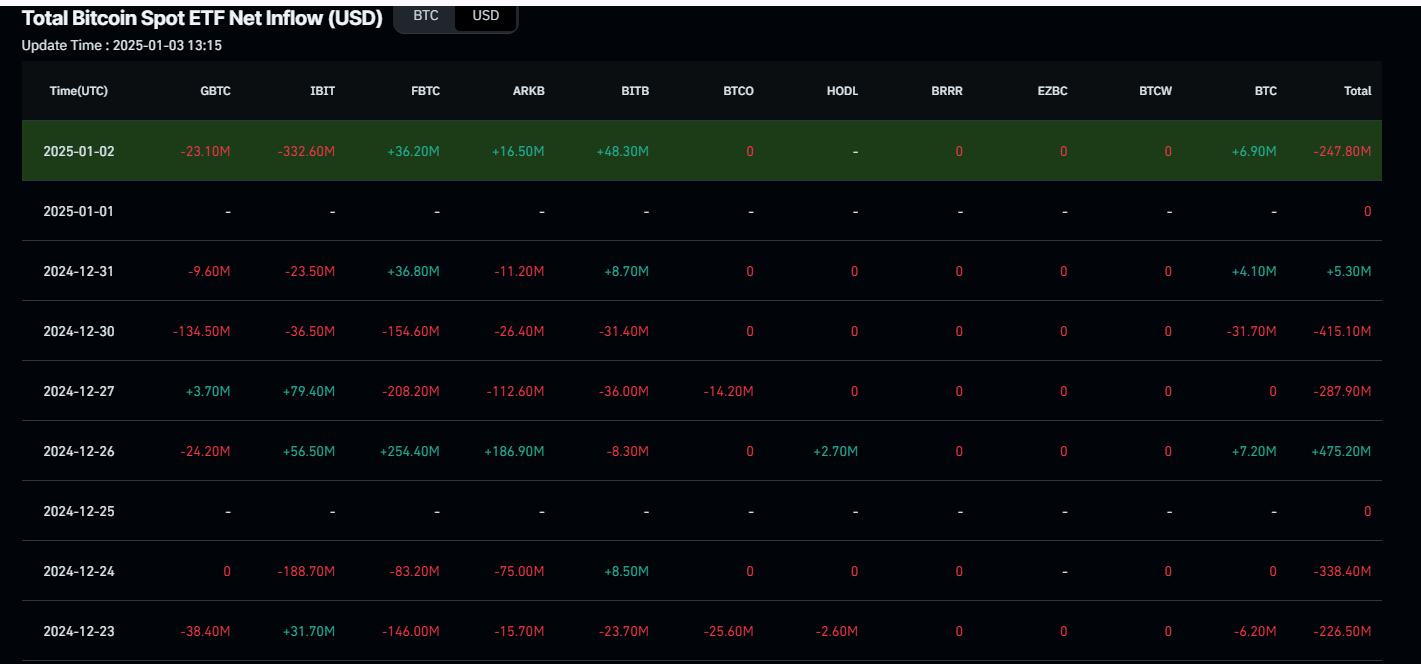
Total Bitcoin Spot ETF Net Inflow chart. Source: Coinglass
Bitcoin bull market holds steady: Cooling-off phase, not cycle peak
CryptoQuant’s on-chain data suggests the bull market is still intact, and the current phase appears to be a cooling-off period rather than a cycle peak. However, short-term price movements remain indecisive, and traders should remain cautious about minor dips.
Bitcoin Adjusted SOPR (Spent Output Profit Ratio) metric removes short-term noise by excluding transactions under one hour and applies a 7-day Simple Moving Average (SMA) for clarity. Currently, the SOPR (7-SMA) metric is above one but trending downward, indicating decreasing profits for market participants. Historically, when SOPR drops below one, Bitcoin often rebounds as selling at a loss triggers reversals — common in bull market patterns.
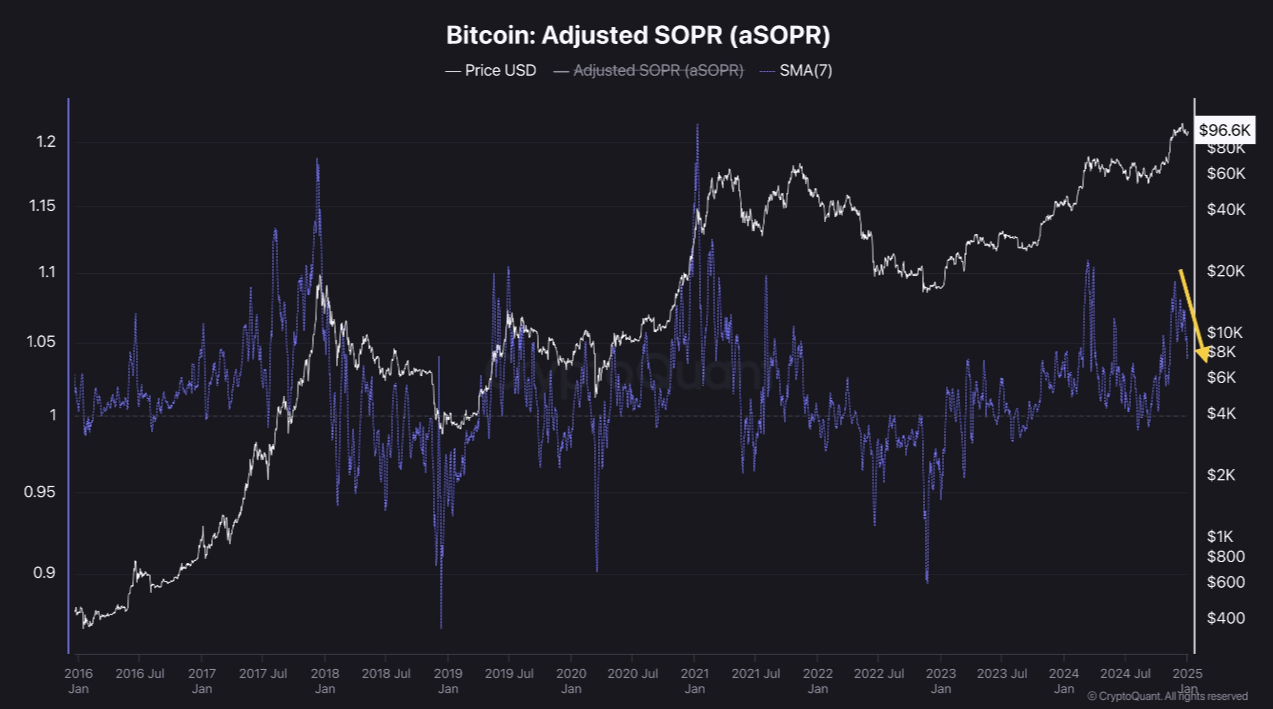
Bitcoin Adjusted SOPR chart. Source: CryptoQuant
Additionally, the Miner Position Index (MPI), analyzed with a 7-day SMA, shows miner behavior regarding Bitcoin sales. Historically, miners sell before halving events or near cycle peaks. Currently, the MPI indicator is trending downward, with no signs of mass transfers to exchanges. This suggests that large mining firms hold Bitcoin as part of their assets. However, traders should remain cautious as periodic sell-offs for operational costs are expected to continue.
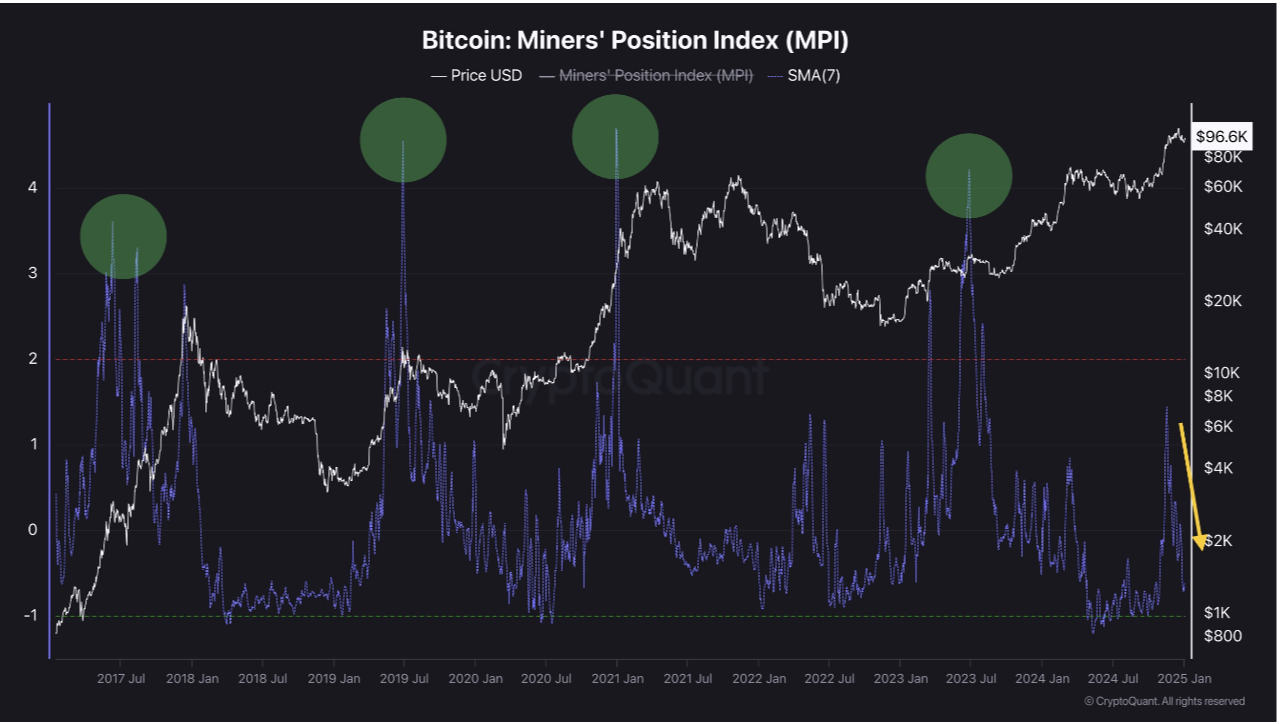
Bitcoin Miners Position Index chart. Source: CryptoQuant
Bitcoin bulls aim for $100K mark
Bitcoin price found support around the 38.2% Fibonacci retracement level, drawn from the November 4 low of $66,835 to the December 17 high of $108,353, at $92,493 on Monday and rose 4.5% in the next three days. This level roughly coincides with the 50-day Exponential Moving Average (EMA) at $93,550, making it a key zone. At the time of writing on Friday, BTC trades at around $96,500.
If the $92,493 level continues to hold as support, BTC could extend its rally to retest its key psychological importance level of $100,000. A successful close above that level would extend an additional rally to retest its December 17, 2024, all-time high of $108,353.
The Relative Strength Index (RSI) on the daily chart reads 49, below its neutral value of 50, and it is pointing downwards, suggesting weakness in bullish momentum. However, the Moving Average Convergence Divergence (MACD) indicator on the daily chart is about to flip a bullish crossover. If the MACD (blue line) crosses over the signal line (orange line), it will give a buy signal, suggesting an upward trend.
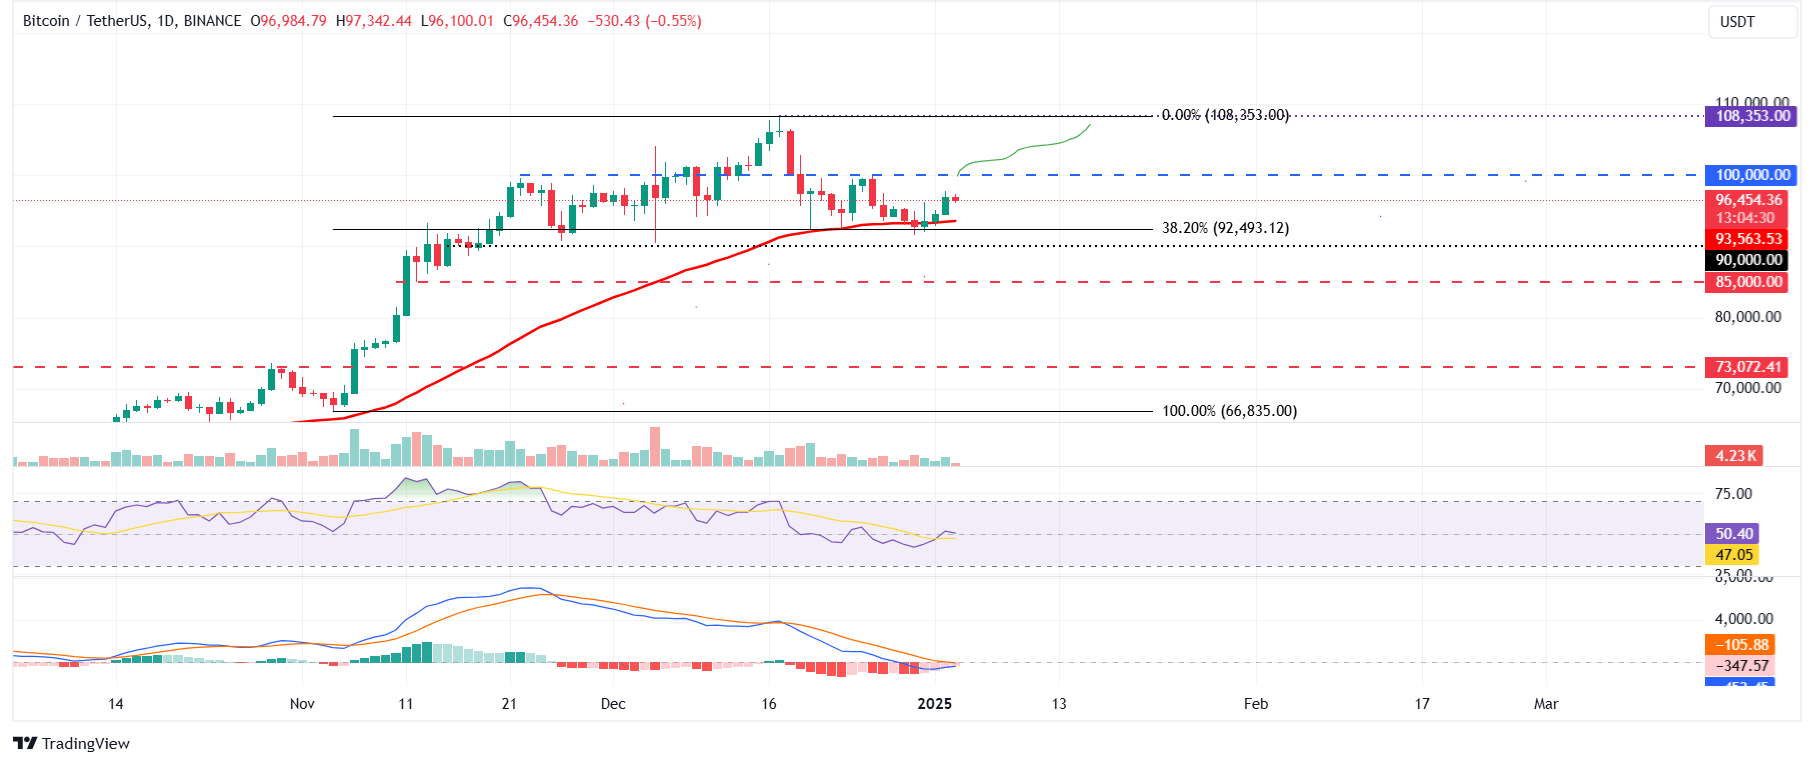
BTC/USDT daily chart
However, if BTC closes below the $92,493 level, it would extend the decline to retest its key support level at $90,000.
Bitcoin, altcoins, stablecoins FAQs
Bitcoin is the largest cryptocurrency by market capitalization, a virtual currency designed to serve as money. This form of payment cannot be controlled by any one person, group, or entity, which eliminates the need for third-party participation during financial transactions.
Altcoins are any cryptocurrency apart from Bitcoin, but some also regard Ethereum as a non-altcoin because it is from these two cryptocurrencies that forking happens. If this is true, then Litecoin is the first altcoin, forked from the Bitcoin protocol and, therefore, an “improved” version of it.
Stablecoins are cryptocurrencies designed to have a stable price, with their value backed by a reserve of the asset it represents. To achieve this, the value of any one stablecoin is pegged to a commodity or financial instrument, such as the US Dollar (USD), with its supply regulated by an algorithm or demand. The main goal of stablecoins is to provide an on/off-ramp for investors willing to trade and invest in cryptocurrencies. Stablecoins also allow investors to store value since cryptocurrencies, in general, are subject to volatility.
Bitcoin dominance is the ratio of Bitcoin's market capitalization to the total market capitalization of all cryptocurrencies combined. It provides a clear picture of Bitcoin’s interest among investors. A high BTC dominance typically happens before and during a bull run, in which investors resort to investing in relatively stable and high market capitalization cryptocurrency like Bitcoin. A drop in BTC dominance usually means that investors are moving their capital and/or profits to altcoins in a quest for higher returns, which usually triggers an explosion of altcoin rallies.
추천 기사


