Three signs that Ethereum could rally 20% after Monday’s crypto crash
- Ethereum active addresses are on the rise, alongside capitulation in Ether.
- Jump Crypto was seen liquidating over $277 million in Ether in the past ten days, driving capitulation in the altcoin.
- Over $909 million in realized losses on Monday marked the largest single-day capitulation event in Ether since September 2023.
- Ether could rally nearly 20%, back to its $3,000 psychologically important level.
Ethereum (ETH) on-chain metrics show signs of potential gains in the second-largest cryptocurrency by market capitalization. Ether has noted a spike in active addresses, a capitulation, and negative MVRV, indicative of a recovery in ETH’s price in the coming days.
Ether trades at $2,526, rising by 2.5% at the time of writing on Wednesday.
Three signs that support bullish thesis for Ethereum
The Active Addresses metric represents the relevance of the asset and its demand among traders. In Ethereum’s case, Active Addresses climbed by 15% from 410,560 on Monday to 472,640 at the time of writing on Wednesday. The surge in active addresses signals rising demand for Ether after the crypto crash on Monday.
 [15.32.26, 07 Aug, 2024]-638586265439989538.png)
Active Addresses vs. Ethereum price
The Network Realized Profit/Loss metric shows the net realized gains or losses of all trades on a given day. Negative spikes are indicative of realized losses and large signs are considered a typical sign of capitulation.
Jump Crypto, a crypto market-making firm, has been aggressively liquidating its Ether holdings in the past ten days. Data shows over $277 million in Ether has been moved to exchanges via Jump Crypto. The firm is likely realizing losses on its Ether holdings, represented by the large negative spike on Monday.
Ether holders realized over $909 million in a single day on Monday, according to Santiment data, the largest single-day capitulation event in Ether since September 2023.
 [15.03.01, 07 Aug, 2024]-638586265725674166.png)
Ether Network Realized Profit/Loss
Typically, large negative spikes are followed by a recovery in the asset’s price. Therefore, it is likely Ether will recover from the recent correction.
Market Value to Realized Value (MVRV) in the 30-day time frame is negative 15.54%, meaning the altcoin is undervalued on average. This generates a buy signal for sidelined traders prior to the asset’s recovery.
Ether targets $3,000, nearly 20% gains
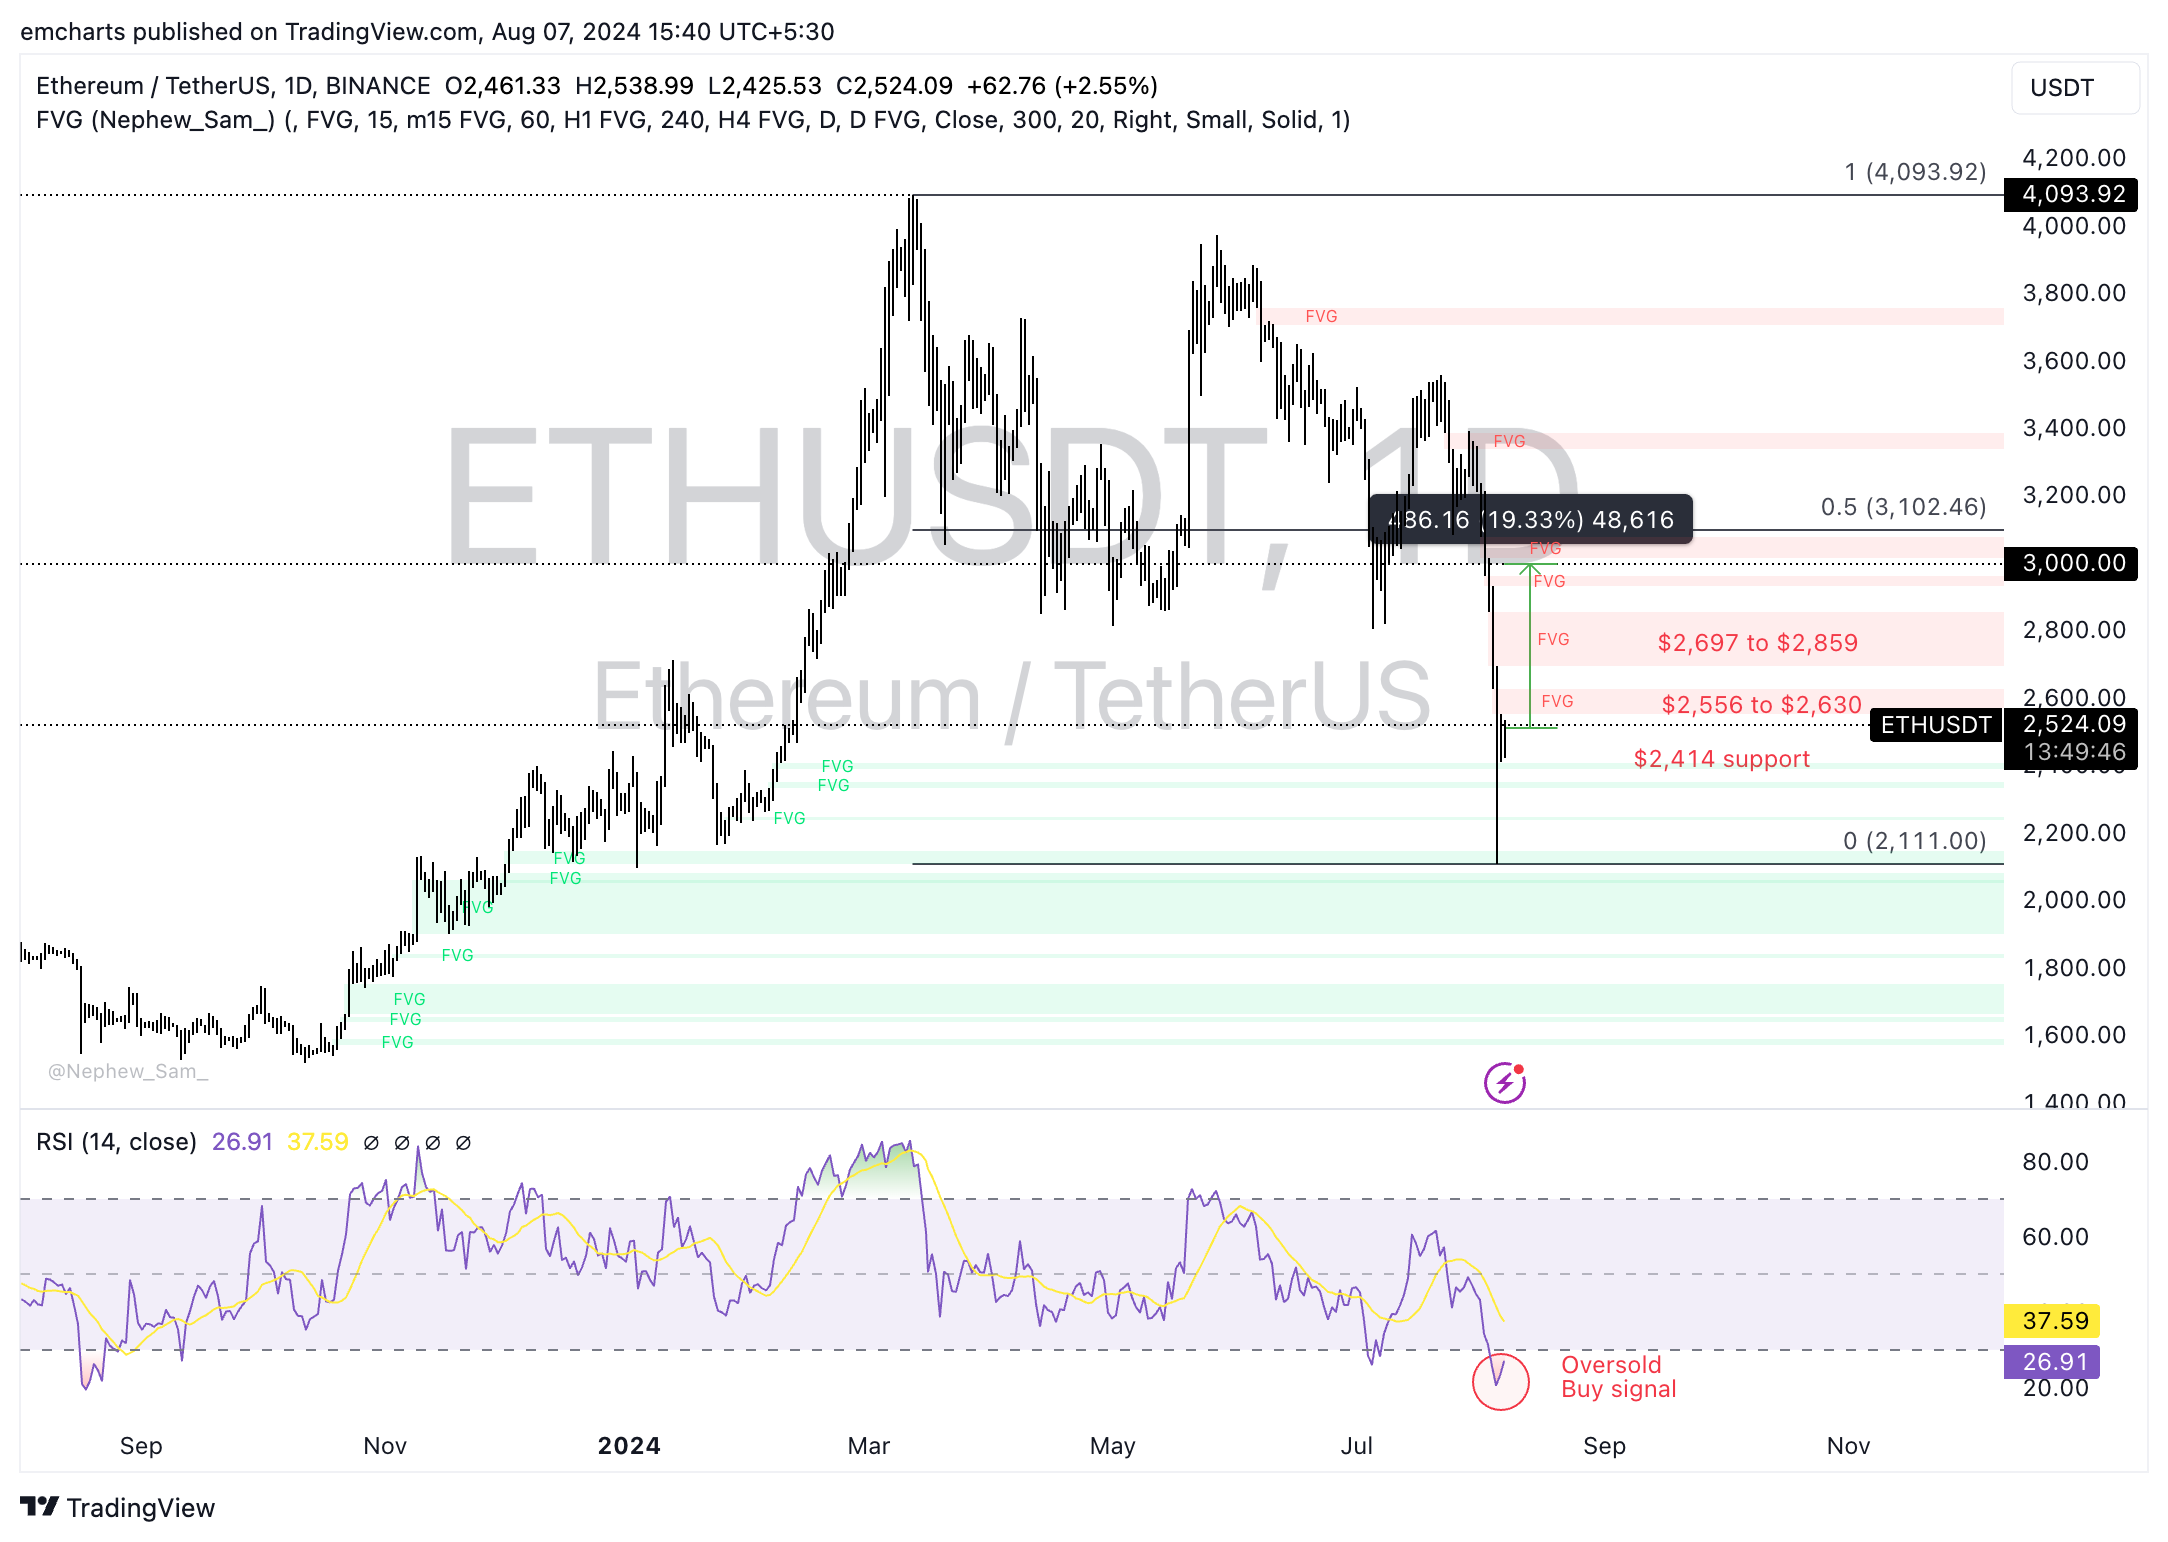
Ethereum’s price targets the psychological $3,000 level. On its way up, ETH faces resistance in two Fair Value Gaps (FVGs) areas, between $2,556 and $2,630 and between $2,697 and $2,859. Ether could extend gains by nearly 20% and rally to the $3,000 level.
The Relative Strength Index (RSI) momentum indicator shows Ether is currently oversold in the daily chart. This could generate a buy signal for the altcoin.

ETH/USDT daily chart
On the contrary, if bearish momentum persists, Ether could find support at the $2,414 level and the August 5 low of $2,111, as seen in the ETH/USDT daily chart above.
Ethereum FAQs
Ethereum is a decentralized open-source blockchain with smart contracts functionality. Serving as the basal network for the Ether (ETH) cryptocurrency, it is the second largest crypto and largest altcoin by market capitalization. The Ethereum network is tailored for scalability, programmability, security, and decentralization, attributes that make it popular among developers.
Ethereum uses decentralized blockchain technology, where developers can build and deploy applications that are independent of the central authority. To make this easier, the network has a programming language in place, which helps users create self-executing smart contracts. A smart contract is basically a code that can be verified and allows inter-user transactions.
Staking is a process where investors grow their portfolios by locking their assets for a specified duration instead of selling them. It is used by most blockchains, especially the ones that employ Proof-of-Stake (PoS) mechanism, with users earning rewards as an incentive for committing their tokens. For most long-term cryptocurrency holders, staking is a strategy to make passive income from your assets, putting them to work in exchange for reward generation.
Ethereum transitioned from a Proof-of-Work (PoW) to a Proof-of-Stake (PoS) mechanism in an event christened “The Merge.” The transformation came as the network wanted to achieve more security, cut down on energy consumption by 99.95%, and execute new scaling solutions with a possible threshold of 100,000 transactions per second. With PoS, there are less entry barriers for miners considering the reduced energy demands.

