


Solana Price Forecast: SOL reclaims $75 as ETFs report first inflow in three weeks
- Solana hovers around $75 on Wednesday, taking a breather after a 5% rebound the previous day.
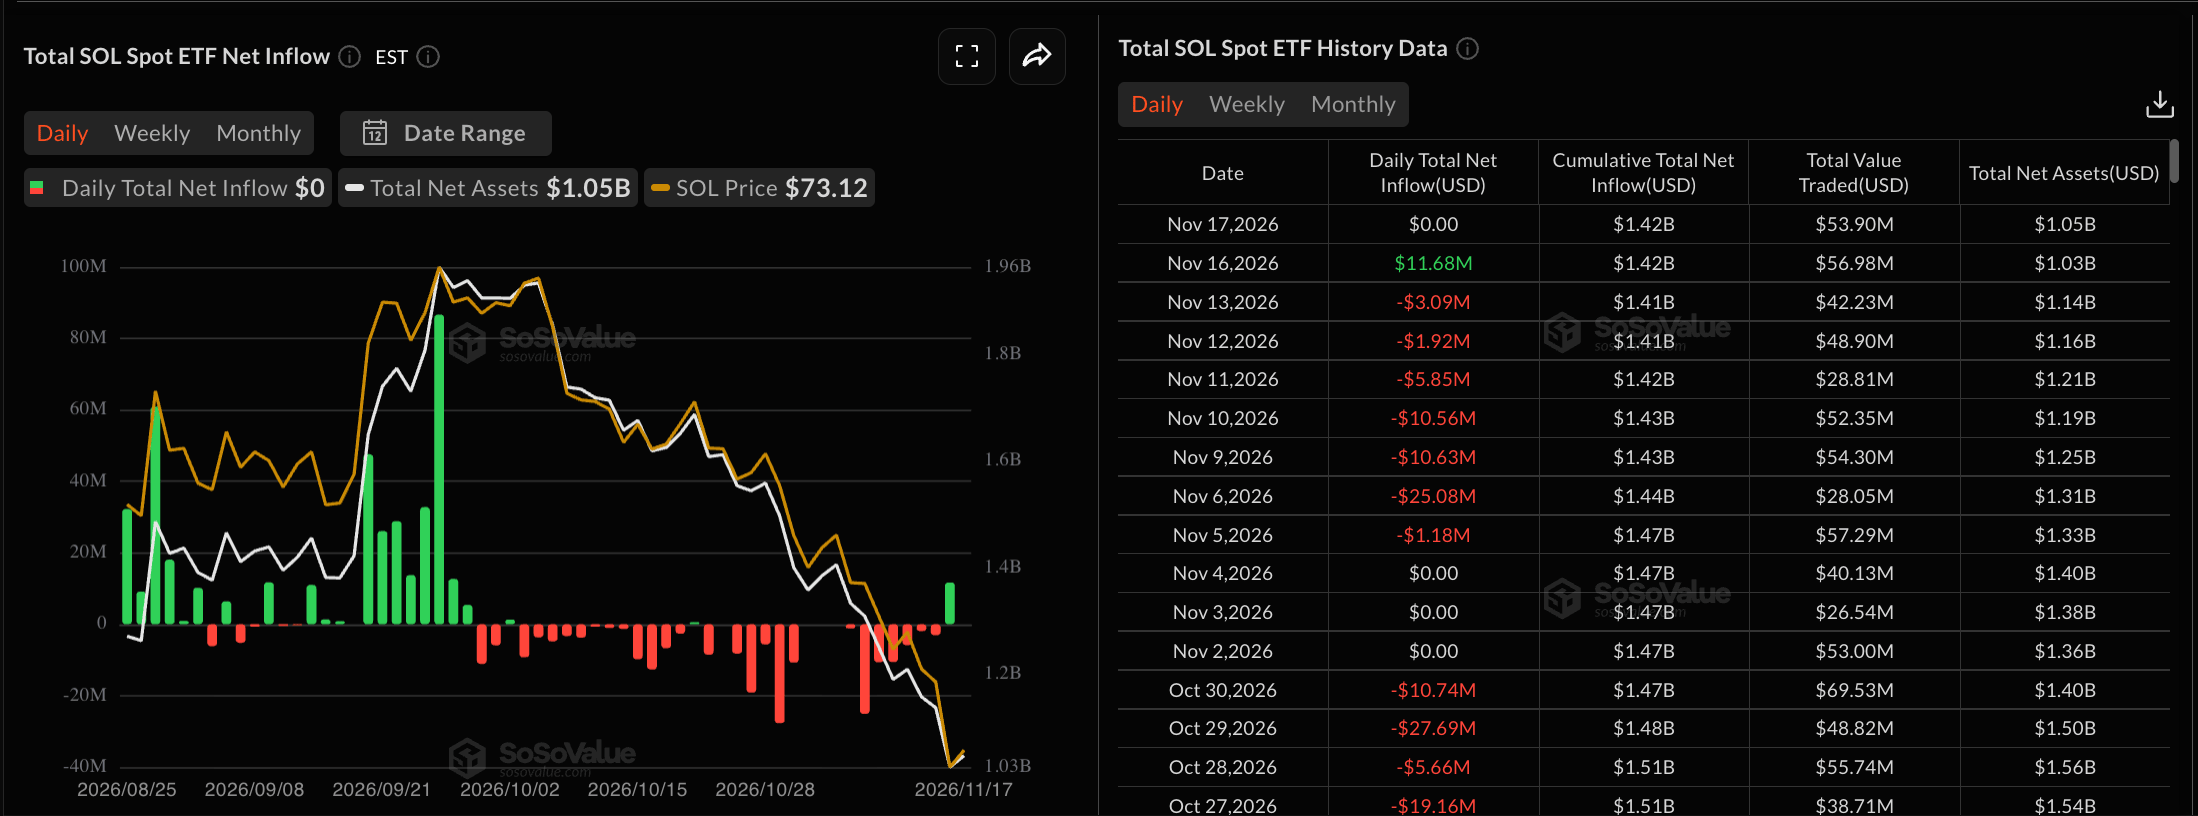
- SOL-focused ETFs recorded their first inflow of nearly $12 million on Monday after three weeks of outflows.
- The technical outlook for SOL is mixed, with oversold conditions hinting at a near-term rebound within a long-term downtrend.
Solana (SOL) price is trading around $75 on Wednesday, following the 5% rebound the previous day, aligning with Nvidia's (NVDA) Q3 earnings beating market expectations. Institutional investors show signs of renewed demand for SOL with the first inflow of nearly $12 million in the last three weeks. The technical outlook for SOL is mixed as oversold conditions hint at a potential rebound.
Solana rebounds on ETF inflows and Nvidia’s earnings report
Solana price gained over 5% on Tuesday following fresh buying from institutional investors and Nvidia’s (NVDA) earnings report beating market expectations. SOL-focused Exchange Traded Funds (ETFs) reported $11.68 million in inflows on Monday, marking their first inflow since October 21 and implying the formation of a potential buying floor by institutional investors. However, the ETFs recorded zero inflows on Tuesday, keeping the reactions mixed.
Meanwhile, Nvidia’s third-quarter revenue of $115.8 billion, up 103% Year-on-Year and 20% from the previous quarter, uplifts some buying pressure in the crypto market.
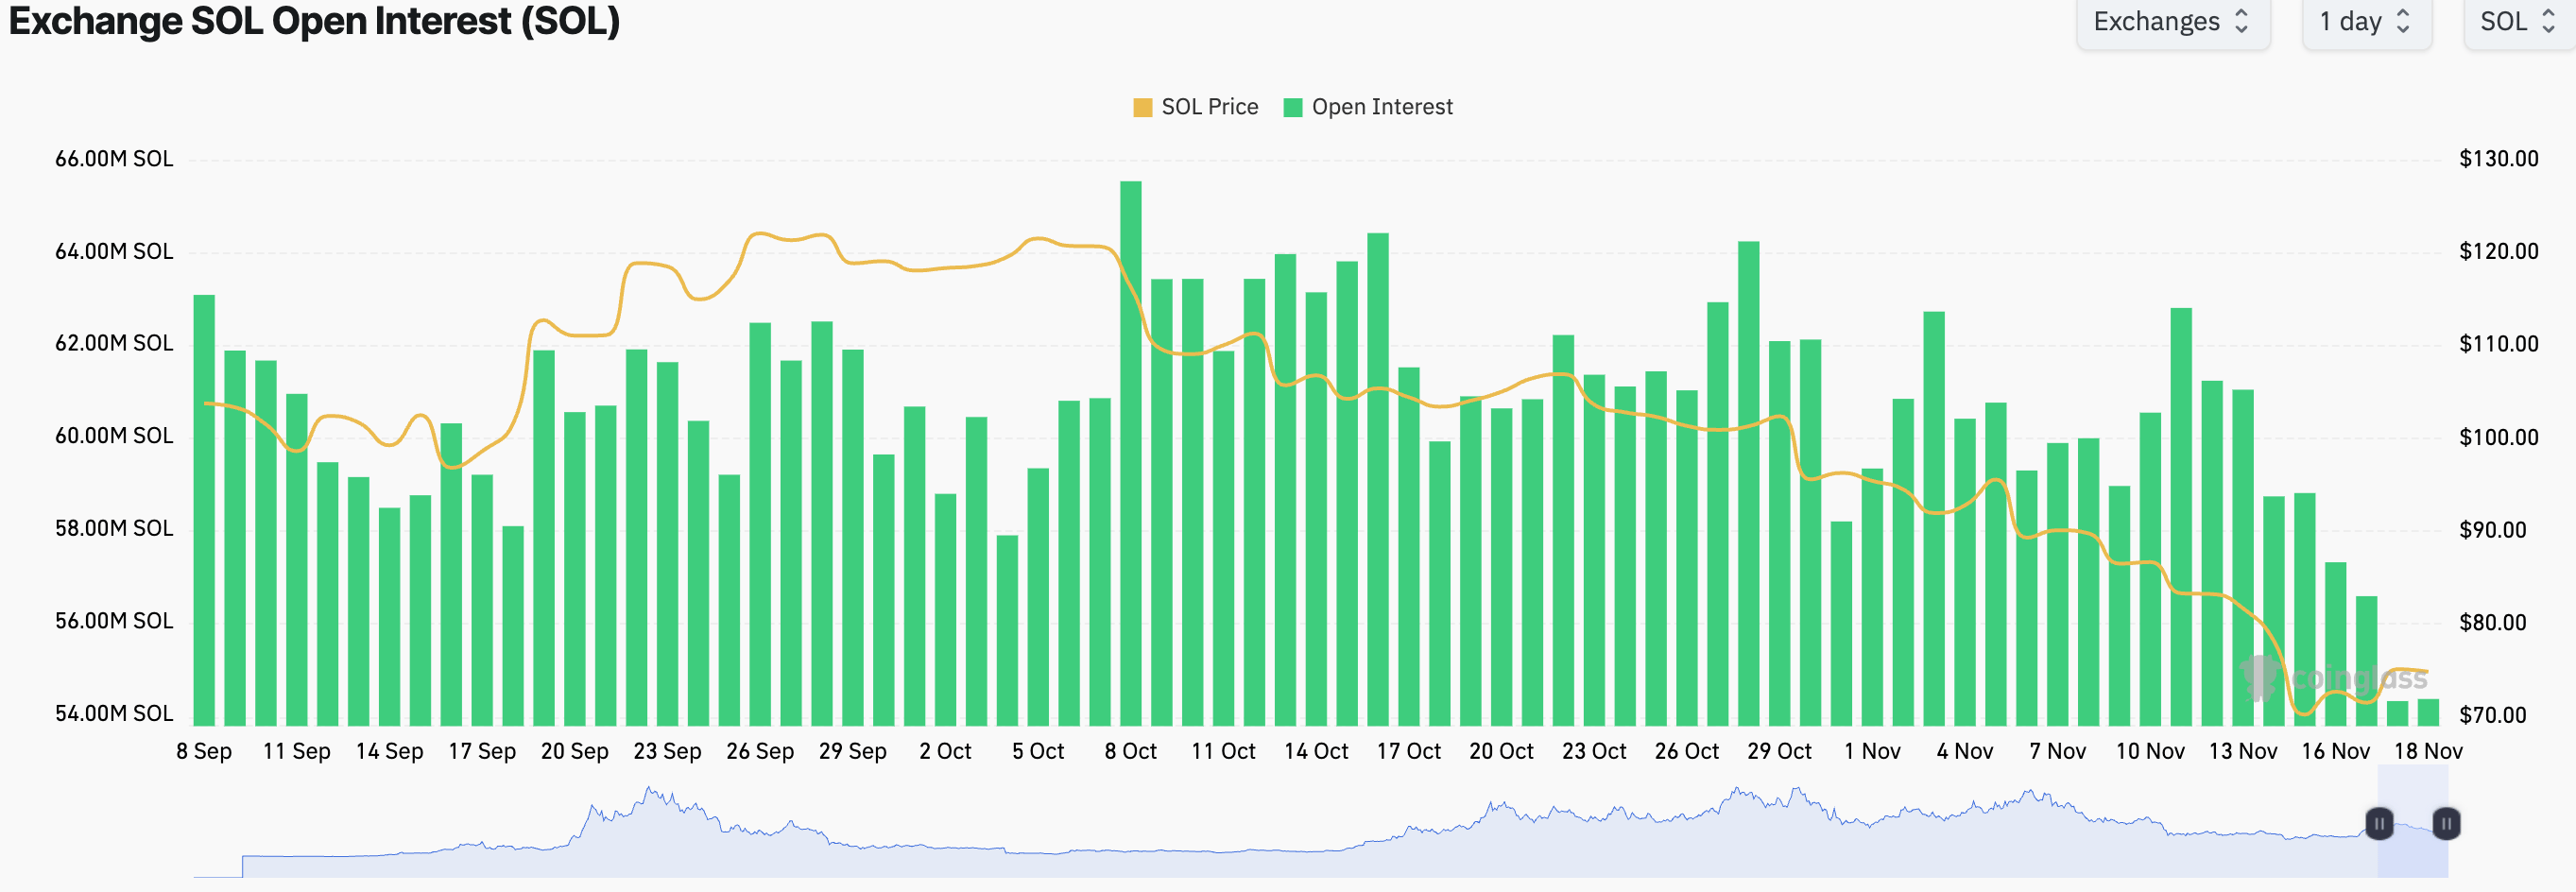
However, Solana's derivatives market is in steady decline. CoinGlass data shows the Solana futures Open Interest (OI) is down to 54.33 million SOL, from 62.79 million SOL last week, suggesting that positions are being wiped out.
Given the mixed ETF inflows, near-term boost from NVDA’s earnings report, and declining OI, Solana is on thin ice. A daily ETF outflow or broader market correction could extend the decline in SOL price.
Technical outlook: Will SOL's rebound extend?
Solana trades at $75.06 at press time on Wednesday, extending a near-term rebound from the $67.50 support floor tested on Sunday. Still, SOL remains in a long-term downward trend with last week's 16% decline, marking the sixth consecutive bearish weekly close.
Solana trades below both the 50-day and 200-day Exponential Moving Averages (EMAs) at $93.11 and $96.46, respectively, which reinforces a downside bias.
Momentum shows an overextended downtrend, with the Relative Strength Index (RSI) at 28 in oversold territory, while the Moving Average Convergence Divergence (MACD) line remains negative, suggesting that selling pressure dominates. However, the waning negative MACD profile hints that the pace of the decline may be moderating.
On the topside, initial resistance emerges at $77.60, with further barriers at $87.46 and $95.82 ahead of the 50-day EMA at $93.11 and the 200-day EMA at $96.46, forming a dense supply zone that would need to be reclaimed to ease bearish pressure.
On the downside, immediate support is seen at $67.50, followed by a more substantial floor near $60.13, where buyers are likely to defend the broader uptrend despite the current corrective tone.
(The technical analysis of this story was written with the help of an AI tool. Know more.)
추천 기사


