

Pi Network price forecast: PI extends losses as social interest declines

출처 Fxstreet
  • Pi Network edges lower on Tuesday, testing the bearish breakout of the $0.0774 support level.
  • PI token’s social dominance score drops to a six-month low, suggesting reduced retail interest.
  • The technical outlook for PI suggests a downside bias, with sellers targeting the all-time low of $0.0704.

Pi Network (PI) is down nearly 2% on Tuesday, extending the previous day’s losses and risking an extended decline toward its record low of $0.0704. PI token’s social dominance score is down to a six-month low, suggesting reduced social interest. The technical outlook for the PI token is bearish as the correction phase gains momentum.

Social chatter softens around PI

Pi Network’s social positioning is declining as it loses share of voice in crypto-related online discussions. Santiment data shows the PI token's social dominance dropped to 0.03% on Monday, marking a six-month low, with a social volume of 2. This implies reduced market chatter about PI, a crucial bullish catalyst tied to speculative demand. 
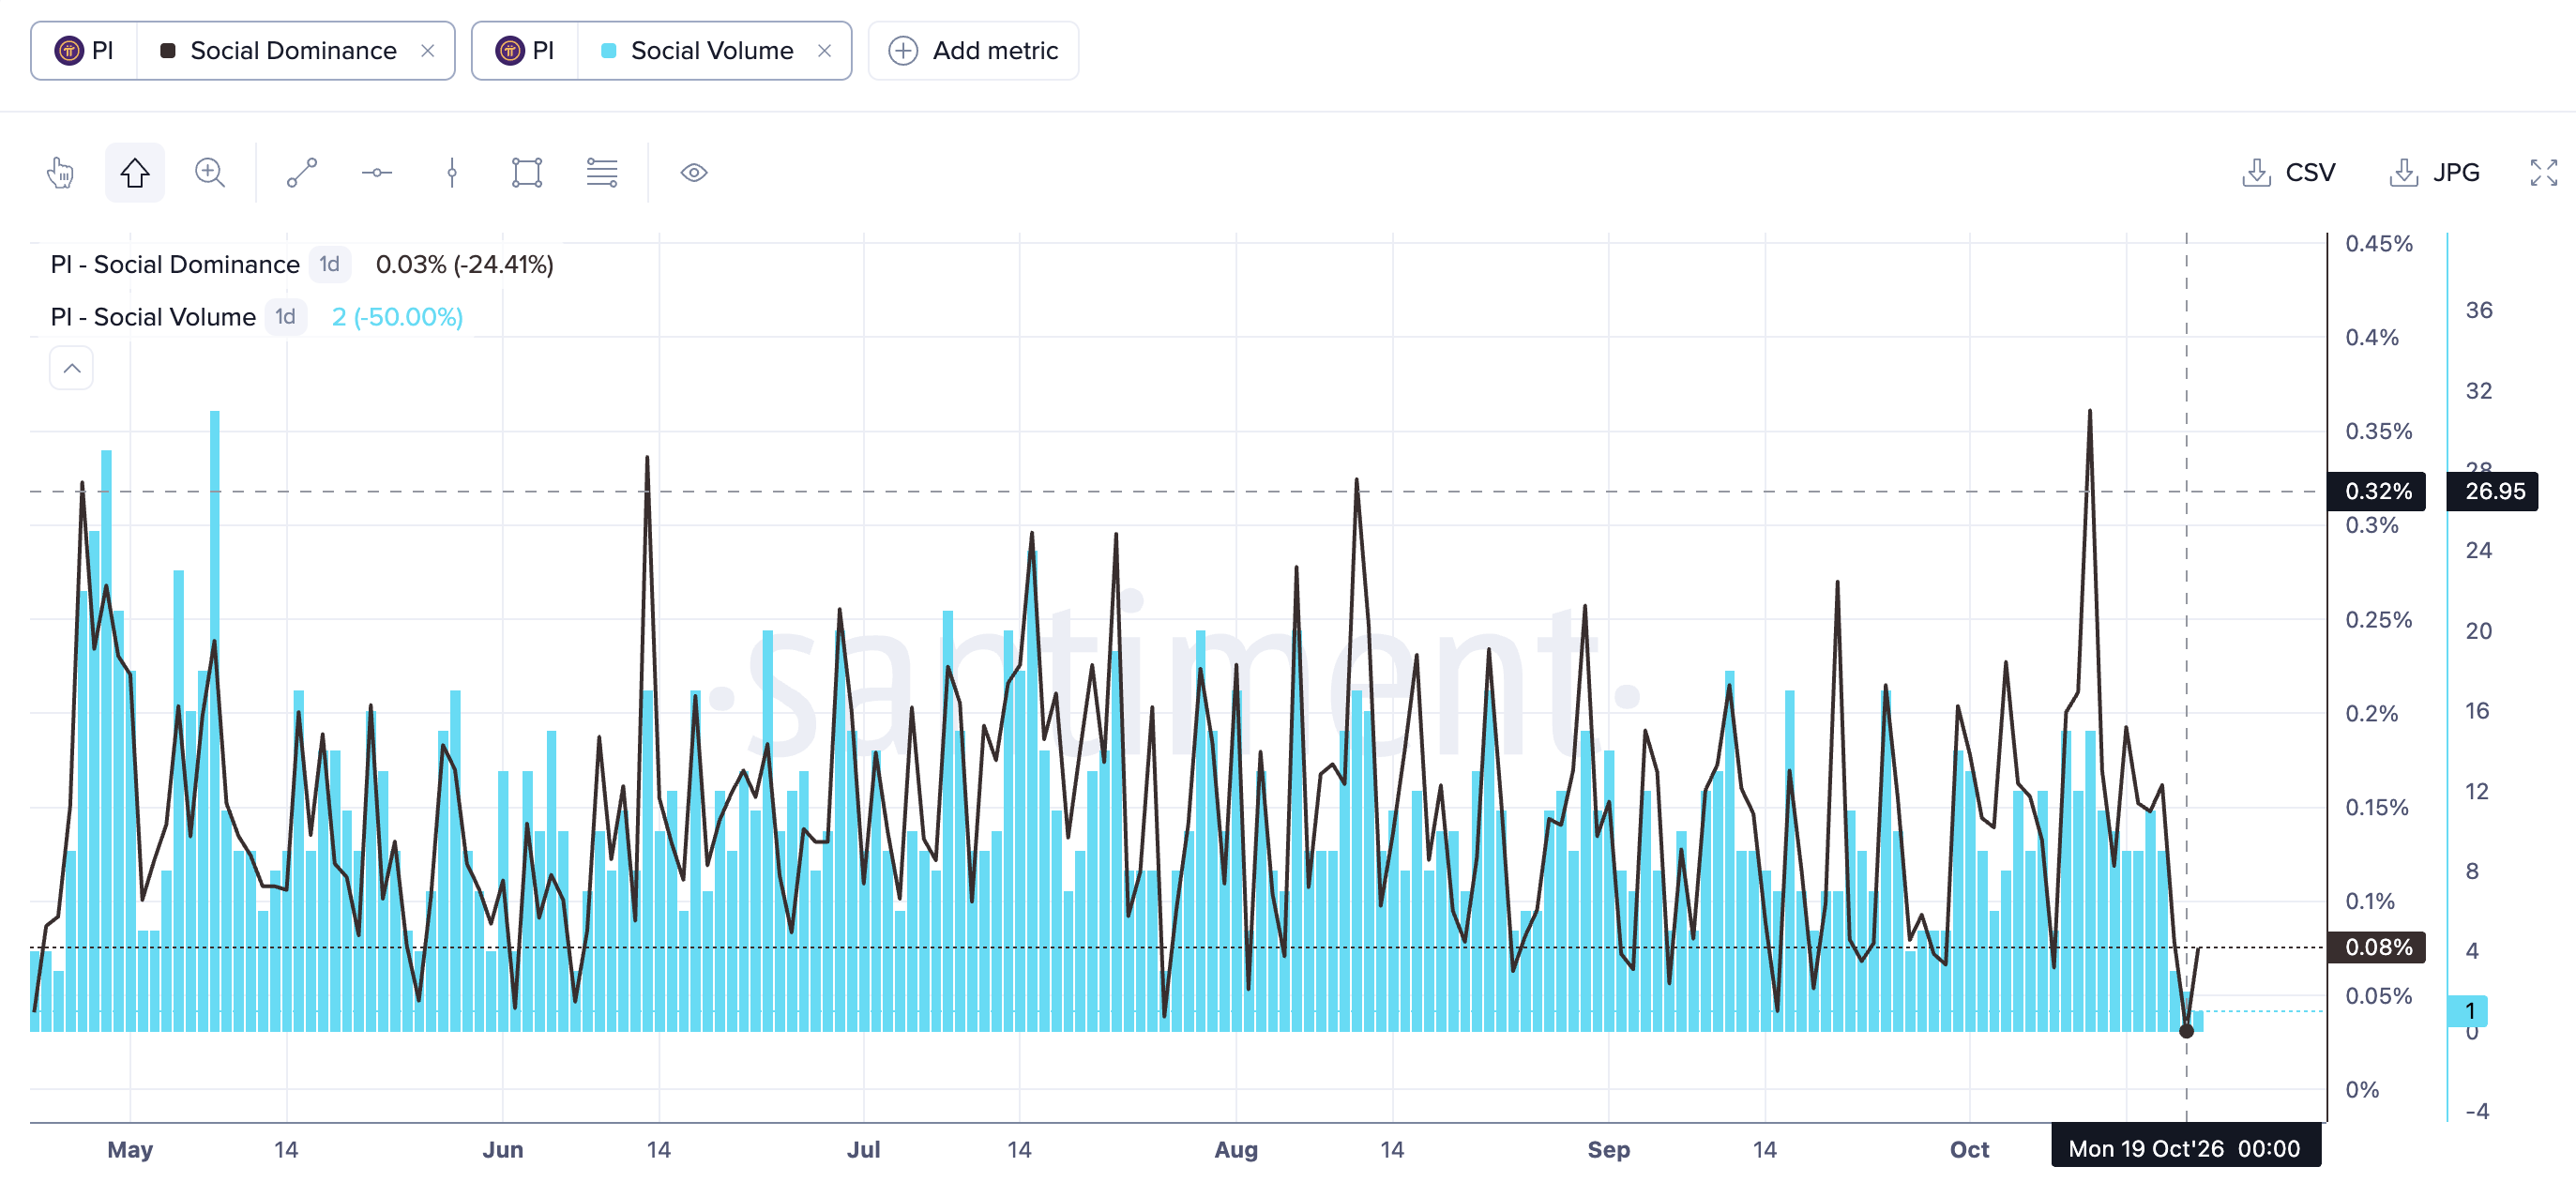
PI social interest data. Source: Santiment

Technical outlook: How low will the Pi Network price go?

Pi Network trades around $0.0772 on Tuesday, extending a long-term bearish trend capped by an overhead resistance trendline, connecting the June 20 and August 22 highs, near $0.0838. PI token's declining trend is also beneath the 50-period Exponential Moving Average (EMA) at $0.0862 and the 200-period EMA at $0.1221.

Momentum reinforces this capped tone, with the Relative Strength Index (RSI) hovering around 35 and Moving Average Convergence Divergence (MACD) in negative territory with a slightly negative histogram, hinting that sellers still control the near-term direction.

A confirmed breakout below the October 8 low at $0.0774 could extend the decline toward the $0.0704 swing low. Any deeper pullbacks will plunge the PI token into a downside price-discovery mode.

Chart Analysis PI/USD (baha Crypto)
PI/USD daily price chart.

On the topside, initial resistance emerges at the downtrend break level around $0.0838, followed closely by a dense cluster formed by the 50-period EMA at $0.0862 and the 23.6% Fibonacci retracement, measured from $0.1394 to $0.0704, at $0.0867. Above this area, the 50% level at $0.1049 and the 200-day EMA at $0.1221 outline the subsequent barrier.

(The technical analysis of this story was written with the help of an AI tool. Know more.)

면책 조항: 정보 제공 목적으로만 사용됩니다. 과거 성과가 미래 결과를 보장하지 않습니다.
placeholder
브렌트 선물(UKOIL-F) 종목이 10월20일에 2.05% 상승한 이유를 확인해 보세요브렌트 선물 (UKOIL-F) 종목은 10월20일 05:05(UTC+0)에 2.05% 상승하여, 현재 가격은 $111.41이고, 최근 7일간 4.82% 상승했습니다.오늘 브렌트 선물(UKOIL-F) 주가 상승의 요인은 무엇인가요?중동 지역의 지정학적 긴장 고조와 주요 해상 수송로를 둘러싼 안보 위험 증대로 공급 차질 우려가 재점화되면서 브렌트유 선물이 상승했다.
저자  FXStreet
10 시간 전
브렌트 선물 (UKOIL-F) 종목은 10월20일 05:05(UTC+0)에 2.05% 상승하여, 현재 가격은 $111.41이고, 최근 7일간 4.82% 상승했습니다.오늘 브렌트 선물(UKOIL-F) 주가 상승의 요인은 무엇인가요?중동 지역의 지정학적 긴장 고조와 주요 해상 수송로를 둘러싼 안보 위험 증대로 공급 차질 우려가 재점화되면서 브렌트유 선물이 상승했다.
placeholder
일본·한국 증시 하락 출발; 코스피 2% 이상 하락, SK하이닉스 4% 이상 하락, 소프트뱅크 3% 이상 하락TradingKey - 10월 20일 오전 거래에서 일본과 한국 증시가 모두 하락세를 보인 가운데, 한국 증시의 낙폭이 확대되었다. 한국 코스피(KOSPI) 지수는 0.60% 하락한 5,733.57포인트로 출발한 뒤 낙폭을 2.20%로 넓히며 5,641.21포인트를 기록했고, 일본 닛케이 225 지수(N225)는 0.25% 내린 64,755.49포인트로 개
저자  Mitrade팀
18 시간 전
TradingKey - 10월 20일 오전 거래에서 일본과 한국 증시가 모두 하락세를 보인 가운데, 한국 증시의 낙폭이 확대되었다. 한국 코스피(KOSPI) 지수는 0.60% 하락한 5,733.57포인트로 출발한 뒤 낙폭을 2.20%로 넓히며 5,641.21포인트를 기록했고, 일본 닛케이 225 지수(N225)는 0.25% 내린 64,755.49포인트로 개
placeholder
비트코인 82,000달러 회복, 이더리움 2,400달러 돌파로 암호화폐 시장 랠리TradingKey - 암호화폐 시장 강한 반등! 비트코인 82,000달러 탈환, 이더리움 2,400달러 돌파.10월 19일, 미국 9월 CPI 및 PPI 인플레이션 데이터 충격으로 촉발된 디레버리징 여파를 견뎌낸 암호화폐 시장은 뚜렷한 기술적 V자형 반등 모멘텀을 보였으며, 전체 시가총액은 2조 8,000억 달러에 육박해 경제 지표 발표 직전 수준을 대부
저자  Mitrade팀
어제 08: 58
TradingKey - 암호화폐 시장 강한 반등! 비트코인 82,000달러 탈환, 이더리움 2,400달러 돌파.10월 19일, 미국 9월 CPI 및 PPI 인플레이션 데이터 충격으로 촉발된 디레버리징 여파를 견뎌낸 암호화폐 시장은 뚜렷한 기술적 V자형 반등 모멘텀을 보였으며, 전체 시가총액은 2조 8,000억 달러에 육박해 경제 지표 발표 직전 수준을 대부
placeholder
TradingKey 월가 주간 리포트: 인플레이션 상승으로 금리 압박 심화; 나스닥 4.48% 하락, 6월 이후 최대 주간 낙폭지난주 시장 리뷰 및 분석TradingKey - 2026년 10월 12일부터 2026년 10월 18일까지의 기간 동안 미국 거시경제 환경은 지속적인 인플레이션 압력과 높은 글로벌 에너지 비용의 지배를 받았습니다. 10월 14일에 발표된 9월 헤드라인 소비자물가지수(CPI) 데이터는 휘발유 가격의 9.1% 급등에 힘입어 연간 인플레이션 상승률이 3.7%로 가
저자  Mitrade팀
어제 01: 26
지난주 시장 리뷰 및 분석TradingKey - 2026년 10월 12일부터 2026년 10월 18일까지의 기간 동안 미국 거시경제 환경은 지속적인 인플레이션 압력과 높은 글로벌 에너지 비용의 지배를 받았습니다. 10월 14일에 발표된 9월 헤드라인 소비자물가지수(CPI) 데이터는 휘발유 가격의 9.1% 급등에 힘입어 연간 인플레이션 상승률이 3.7%로 가
placeholder
금 가격 전망: 9월 PPI가 거의 4년 만에 최대 폭으로 상승한 후 금 가격이 반등한 이유는?TradingKey - 10월 16일 유럽 세션 기준, 금 가격(XAUUSD)은 반등세를 이어가며 현재 전일 대비 약 0.4% 상승한 4,185달러 부근에서 거래되고 있다. 금 가격은 앞서 4,073달러 부근까지 하락한 후 지속적인 회복세를 보였다. 어제 발표된 미국의 생산자물가지수(PPI)와 소매판매 지표가 모두 시장 예상치를 상회했으나, 미 달러화와 국
저자  Mitrade팀
10 월 16 일 금요일
TradingKey - 10월 16일 유럽 세션 기준, 금 가격(XAUUSD)은 반등세를 이어가며 현재 전일 대비 약 0.4% 상승한 4,185달러 부근에서 거래되고 있다. 금 가격은 앞서 4,073달러 부근까지 하락한 후 지속적인 회복세를 보였다. 어제 발표된 미국의 생산자물가지수(PPI)와 소매판매 지표가 모두 시장 예상치를 상회했으나, 미 달러화와 국
goTop
quote