


Gold bears tighten their grip as Fed rate hike bets rise
- Gold slides to a one-week low as a stronger US Dollar and rising US Treasury yields weigh on the metal.
- Strong US business activity data and hawkish Fed signals strengthen expectations of another interest-rate increase.
- XAU/USD slips below the 50-day and 100-day SMAs, keeping the near-term technical bias bearish.
Gold (XAU/USD) slides to a one-week low on Thursday as rising US Treasury yields and a stronger US Dollar (USD) reflect an increasingly hawkish Federal Reserve (Fed) outlook. At the time of writing, XAU/USD trades around $4,260, down nearly 0.65% on the day.
The yield on the benchmark 10-year US Treasury note jumped 15.2 basis points (bps) on Wednesday and now trades around 5.15%, its highest level since 2007. Yields at the shorter end of the curve also hover near multi-year highs.
A strong batch of US S&P Global Purchasing Managers’ Index (PMI) data drove the move. The Composite PMI unexpectedly rose to a five-year high of 58.4 in September, pointing to resilient economic growth and giving the Fed more room to tackle stubborn inflation.
The strong figures strengthened expectations that the US central bank could raise interest rates again in October after delivering a 25 bps hike last week. The CME FedWatch Tool places the probability of a rate increase at around 75%, up from 55% a day earlier. Higher borrowing costs weigh on Gold by increasing the attractiveness of interest-bearing assets.
The shift also keeps the US Dollar in strong demand. The US Dollar Index (DXY), which tracks the Greenback's value against a basket of six major currencies, trades around 101.27, its highest level in two months. A stronger US Dollar makes Gold more expensive for overseas buyers.
Recent remarks from Fed officials have kept the door open to additional rate hikes, with policymakers stressing the need to bring inflation back to the 2% target. New York Fed President John Williams said on Thursday, “We need to get inflation back to target in a timely manner,” adding that it is “reasonable to see another rate hike by end of the year.”
Meanwhile, elevated Oil prices linked to the war in the Middle East keep inflation risks tilted to the upside, reinforcing expectations of tighter monetary policy across major economies.
The United States and Iran held talks on the sidelines of the United Nations General Assembly earlier this week, but the two sides are still far apart on how to end the war. Reuters reported, citing a senior Iranian official, that Tehran is reviewing Washington’s response to its peace proposals, which prioritise lifting the US naval blockade on Iranian ports and reopening the Strait of Hormuz.
Looking ahead, traders await more Fed commentary, the weekly US Initial Jobless Claims data and the meeting between US President Donald Trump and Chinese President Xi Jinping later on Thursday.
Technical Analysis: Sellers remain in control below key daily SMAs
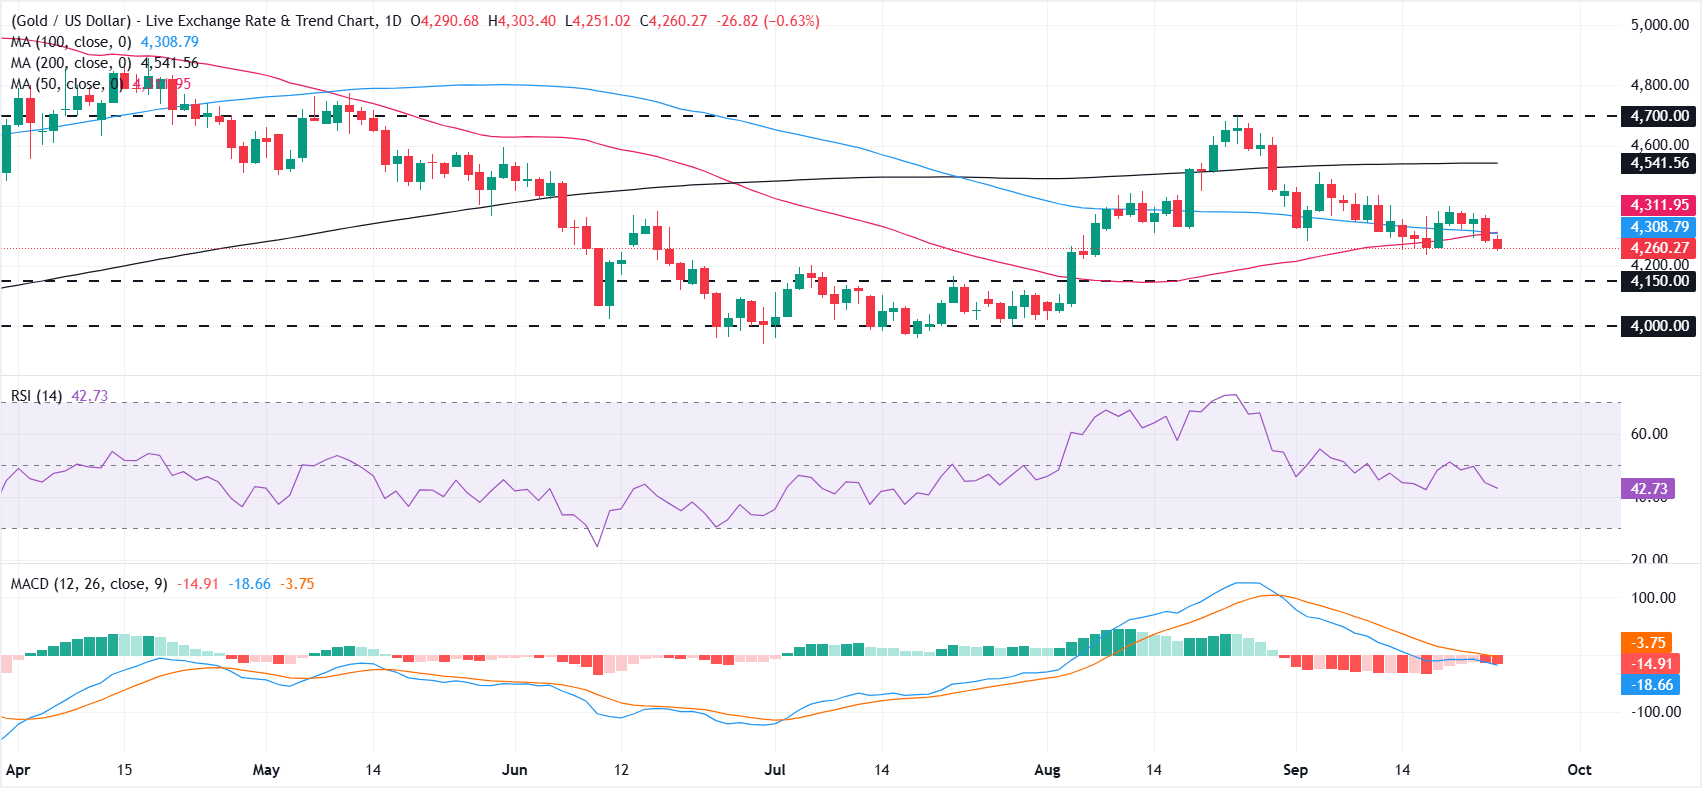
XAU/USD remains bearish in the near term as it slips below key Simple Moving Averages (SMAs). Spot gold is capped below the 50-day SMA at $4,311 and the 100-day SMA at $4,308, forming a nearby resistance cluster that hints at downside risk. Momentum indicators reinforce this softer tone, with the Relative Strength Index (RSI) on the daily chart hovering near a neutral 42 and the Moving Average Convergence Divergence (MACD) indicator in negative territory, suggesting sellers still control the short-term swings.
On the downside, initial support is seen at the horizontal level near $4,150, where a break would expose the next bearish target around $4,000. On the topside, bulls would need to reclaim the clustered 50- and 100-day SMAs around $4,310 to ease immediate pressure, with further resistance then located at the 200-day SMA at $4,541 and the more distant structural barrier at $4,700. Until these overhead levels are overcome, rallies are likely to struggle and risk fading back towards the underlying support band.
(The technical analysis of this story was written with the help of an AI tool. Know more.)
Gold FAQs
Gold has played a key role in human’s history as it has been widely used as a store of value and medium of exchange. Currently, apart from its shine and usage for jewelry, the precious metal is widely seen as a safe-haven asset, meaning that it is considered a good investment during turbulent times. Gold is also widely seen as a hedge against inflation and against depreciating currencies as it doesn’t rely on any specific issuer or government.
Central banks are the biggest Gold holders. In their aim to support their currencies in turbulent times, central banks tend to diversify their reserves and buy Gold to improve the perceived strength of the economy and the currency. High Gold reserves can be a source of trust for a country’s solvency. Central banks added 1,136 tonnes of Gold worth around $70 billion to their reserves in 2022, according to data from the World Gold Council. This is the highest yearly purchase since records began. Central banks from emerging economies such as China, India and Turkey are quickly increasing their Gold reserves.
Gold has an inverse correlation with the US Dollar and US Treasuries, which are both major reserve and safe-haven assets. When the Dollar depreciates, Gold tends to rise, enabling investors and central banks to diversify their assets in turbulent times. Gold is also inversely correlated with risk assets. A rally in the stock market tends to weaken Gold price, while sell-offs in riskier markets tend to favor the precious metal.
The price can move due to a wide range of factors. Geopolitical instability or fears of a deep recession can quickly make Gold price escalate due to its safe-haven status. As a yield-less asset, Gold tends to rise with lower interest rates, while higher cost of money usually weighs down on the yellow metal. Still, most moves depend on how the US Dollar (USD) behaves as the asset is priced in dollars (XAU/USD). A strong Dollar tends to keep the price of Gold controlled, whereas a weaker Dollar is likely to push Gold prices up.
추천 기사


