


Bitcoin and Gold Outlook: BTC defends support as XAU rebounds ahead of Fed decision
- Bitcoin stabilizes above $75,000 after the US Senate failed to advance the CLARITY Act.
- Gold edges higher above $4,300, suggesting investors are increasing exposure amid monetary policy uncertainty.
- The US Fed is largely expected to raise interest rates on Wednesday, a decision that could weigh on risk assets.
Bitcoin (BTC) holds above support tested at $75,000 on Wednesday as bulls push to regain momentum following a sharp drop from $78,250 the previous day. The Crypto King reflects widespread doldrums in the cryptocurrency market after the United States (US) Senate failed to advance the CLARITY Act.
Gold (XAU/USD), meanwhile, remains stable as it ticks up above $4,300. Still, momentum appears to be lagging ahead of the US Federal Reserve (Fed) monetary policy decision.
Markets brace for Fed rate hike
The Federal Open Market Committee (FOMC) is widely expected to raise interest rates later on Wednesday, adopting a hawkish stance against the backdrop of sticky inflation that hovers above the central bank’s 2% target.
Market participants are pricing in 92.7% odds that the Fed will hike interest rates to between 3.75% and 4.00%, potentially weighing on risk assets. Geopolitical tensions in the Middle East continue to keep Crude Oil prices elevated, with the West Texas Intermediate (WTI) hovering around $102, up roughly 19% from September 1.
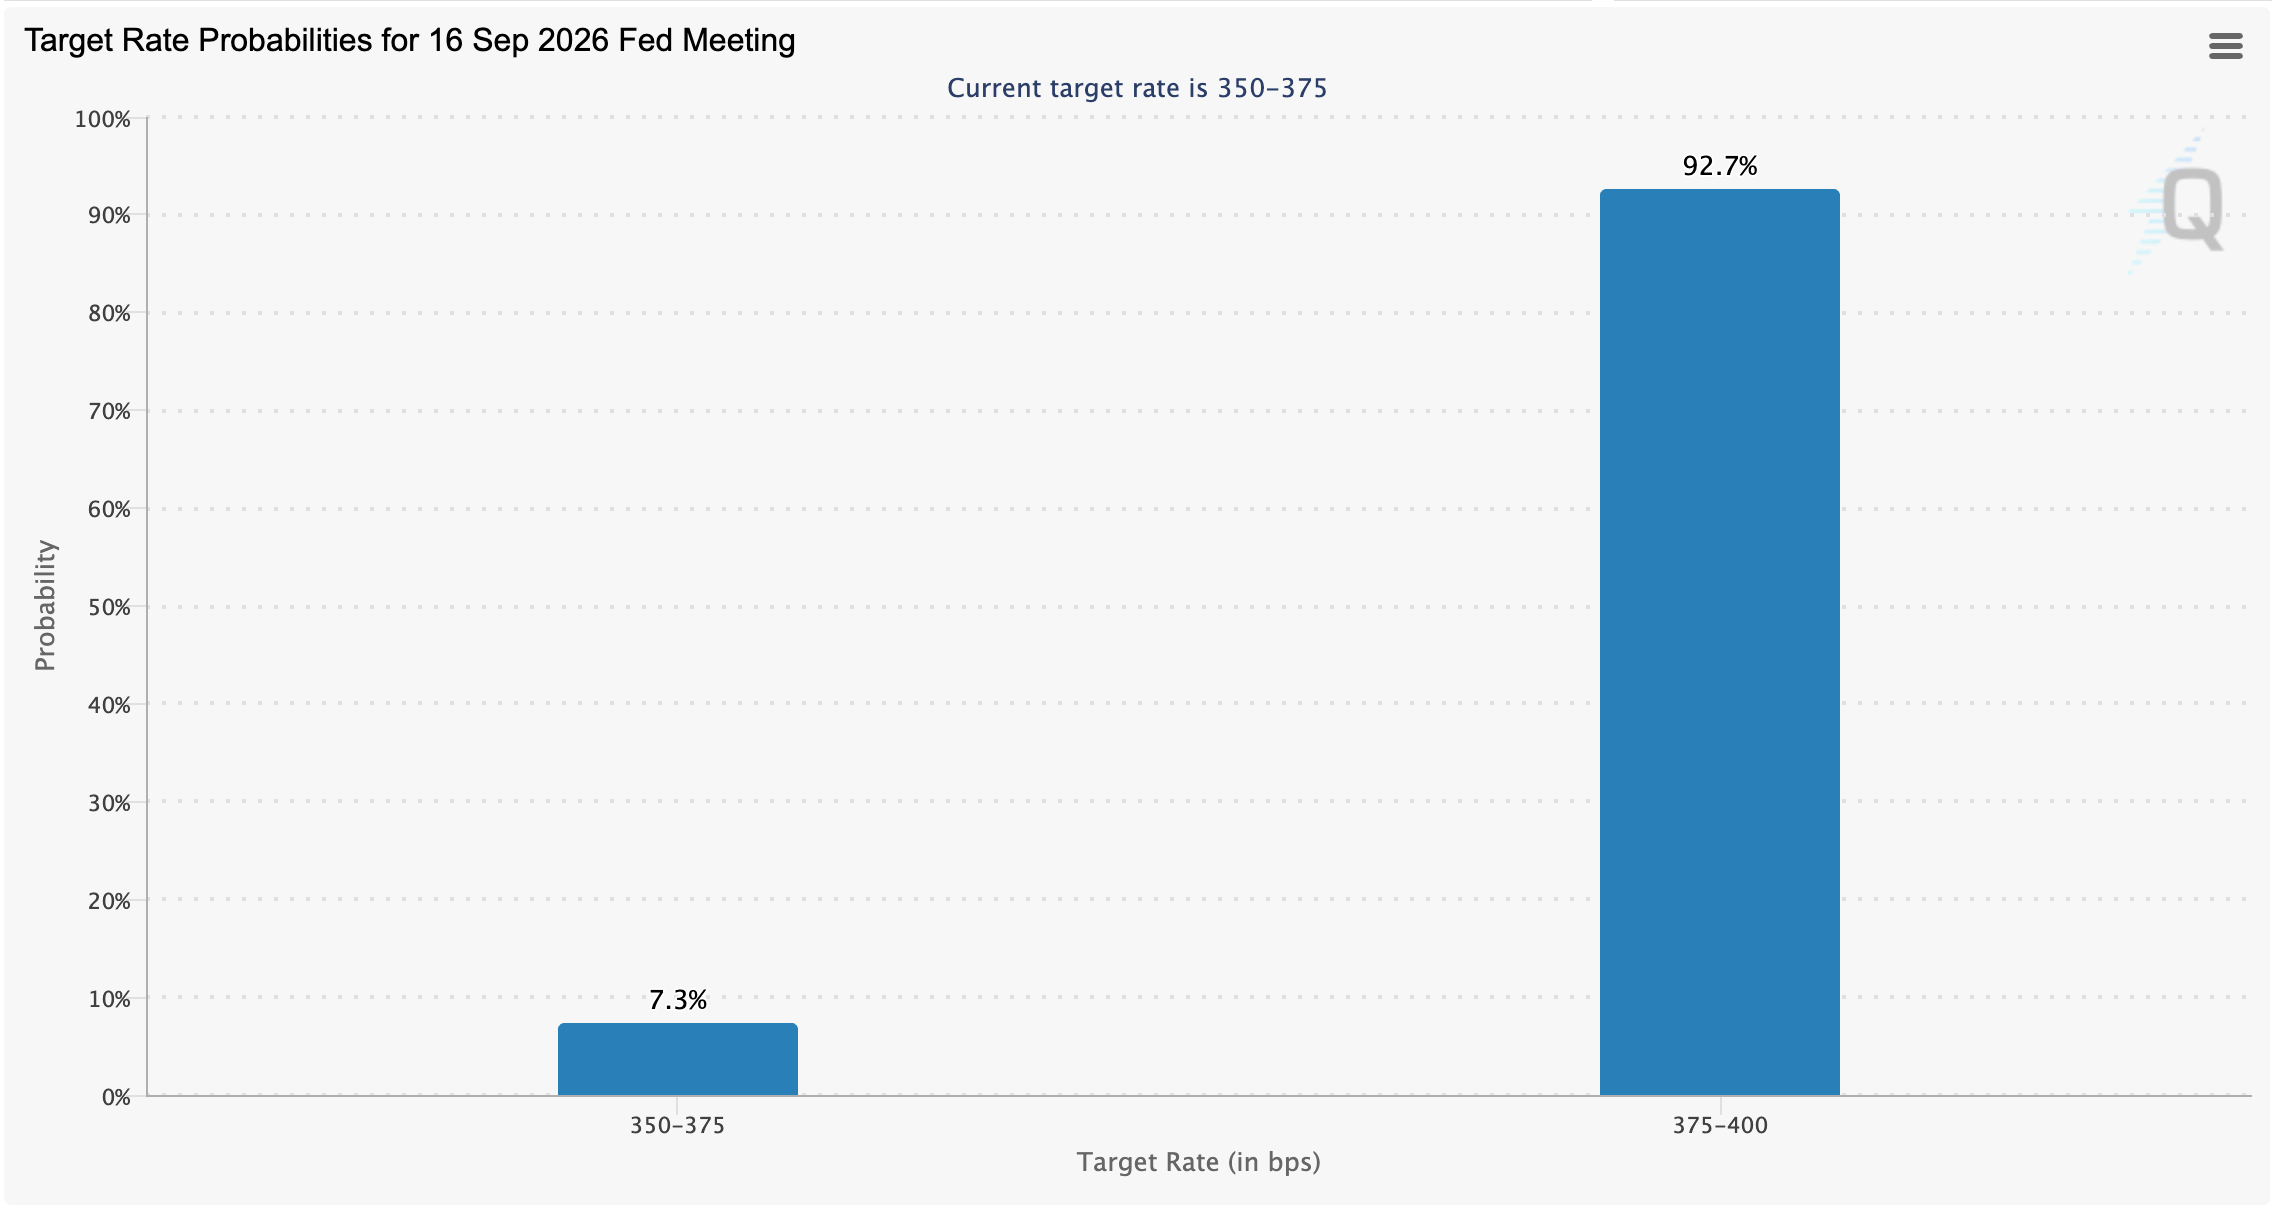
Raising rates could put additional strain on the world’s largest economy, increasing borrowing costs for both consumers and borrowers. Fed Chair Kevin Warsh’s post-meeting press conference would provide investors with insight into the regulator’s monetary policy, with analysts seemingly pricing in a higher probability of another rate hike in October.
“You could find enough reasons to stay on hold, but you are doing it in a market that is anticipating more and more aggressive action,” Ed Al-Hussainy, portfolio manager at Columbia Threadneedle Investments, told reporters in a recent webinar.
Technical analysis: Bitcoin faces headwinds
Bitcoin hovers above $75,000 while upside remains capped below the short-term hurdle at $76,000. This follows a sharp correction from Monday highs of $79,600. Despite the correction, the largest cryptocurrency by market capitalization maintains a constructive near-term bias as price remains above the 50-day, 100-day and 200-day Exponential Moving Averages (EMAs) clustered between roughly $71,400 and $73,600.
The recent break and sustained trade above the prior downward resistance trendline, whose break point sits near $65,462, further reinforces a medium-term supportive structure even as momentum cools, with the Relative Strength Index (RSI) hovering just below 50 and the Moving Average Convergence Divergence (MACD) remaining in negative territory, suggesting a consolidative rather than impulsive advance.
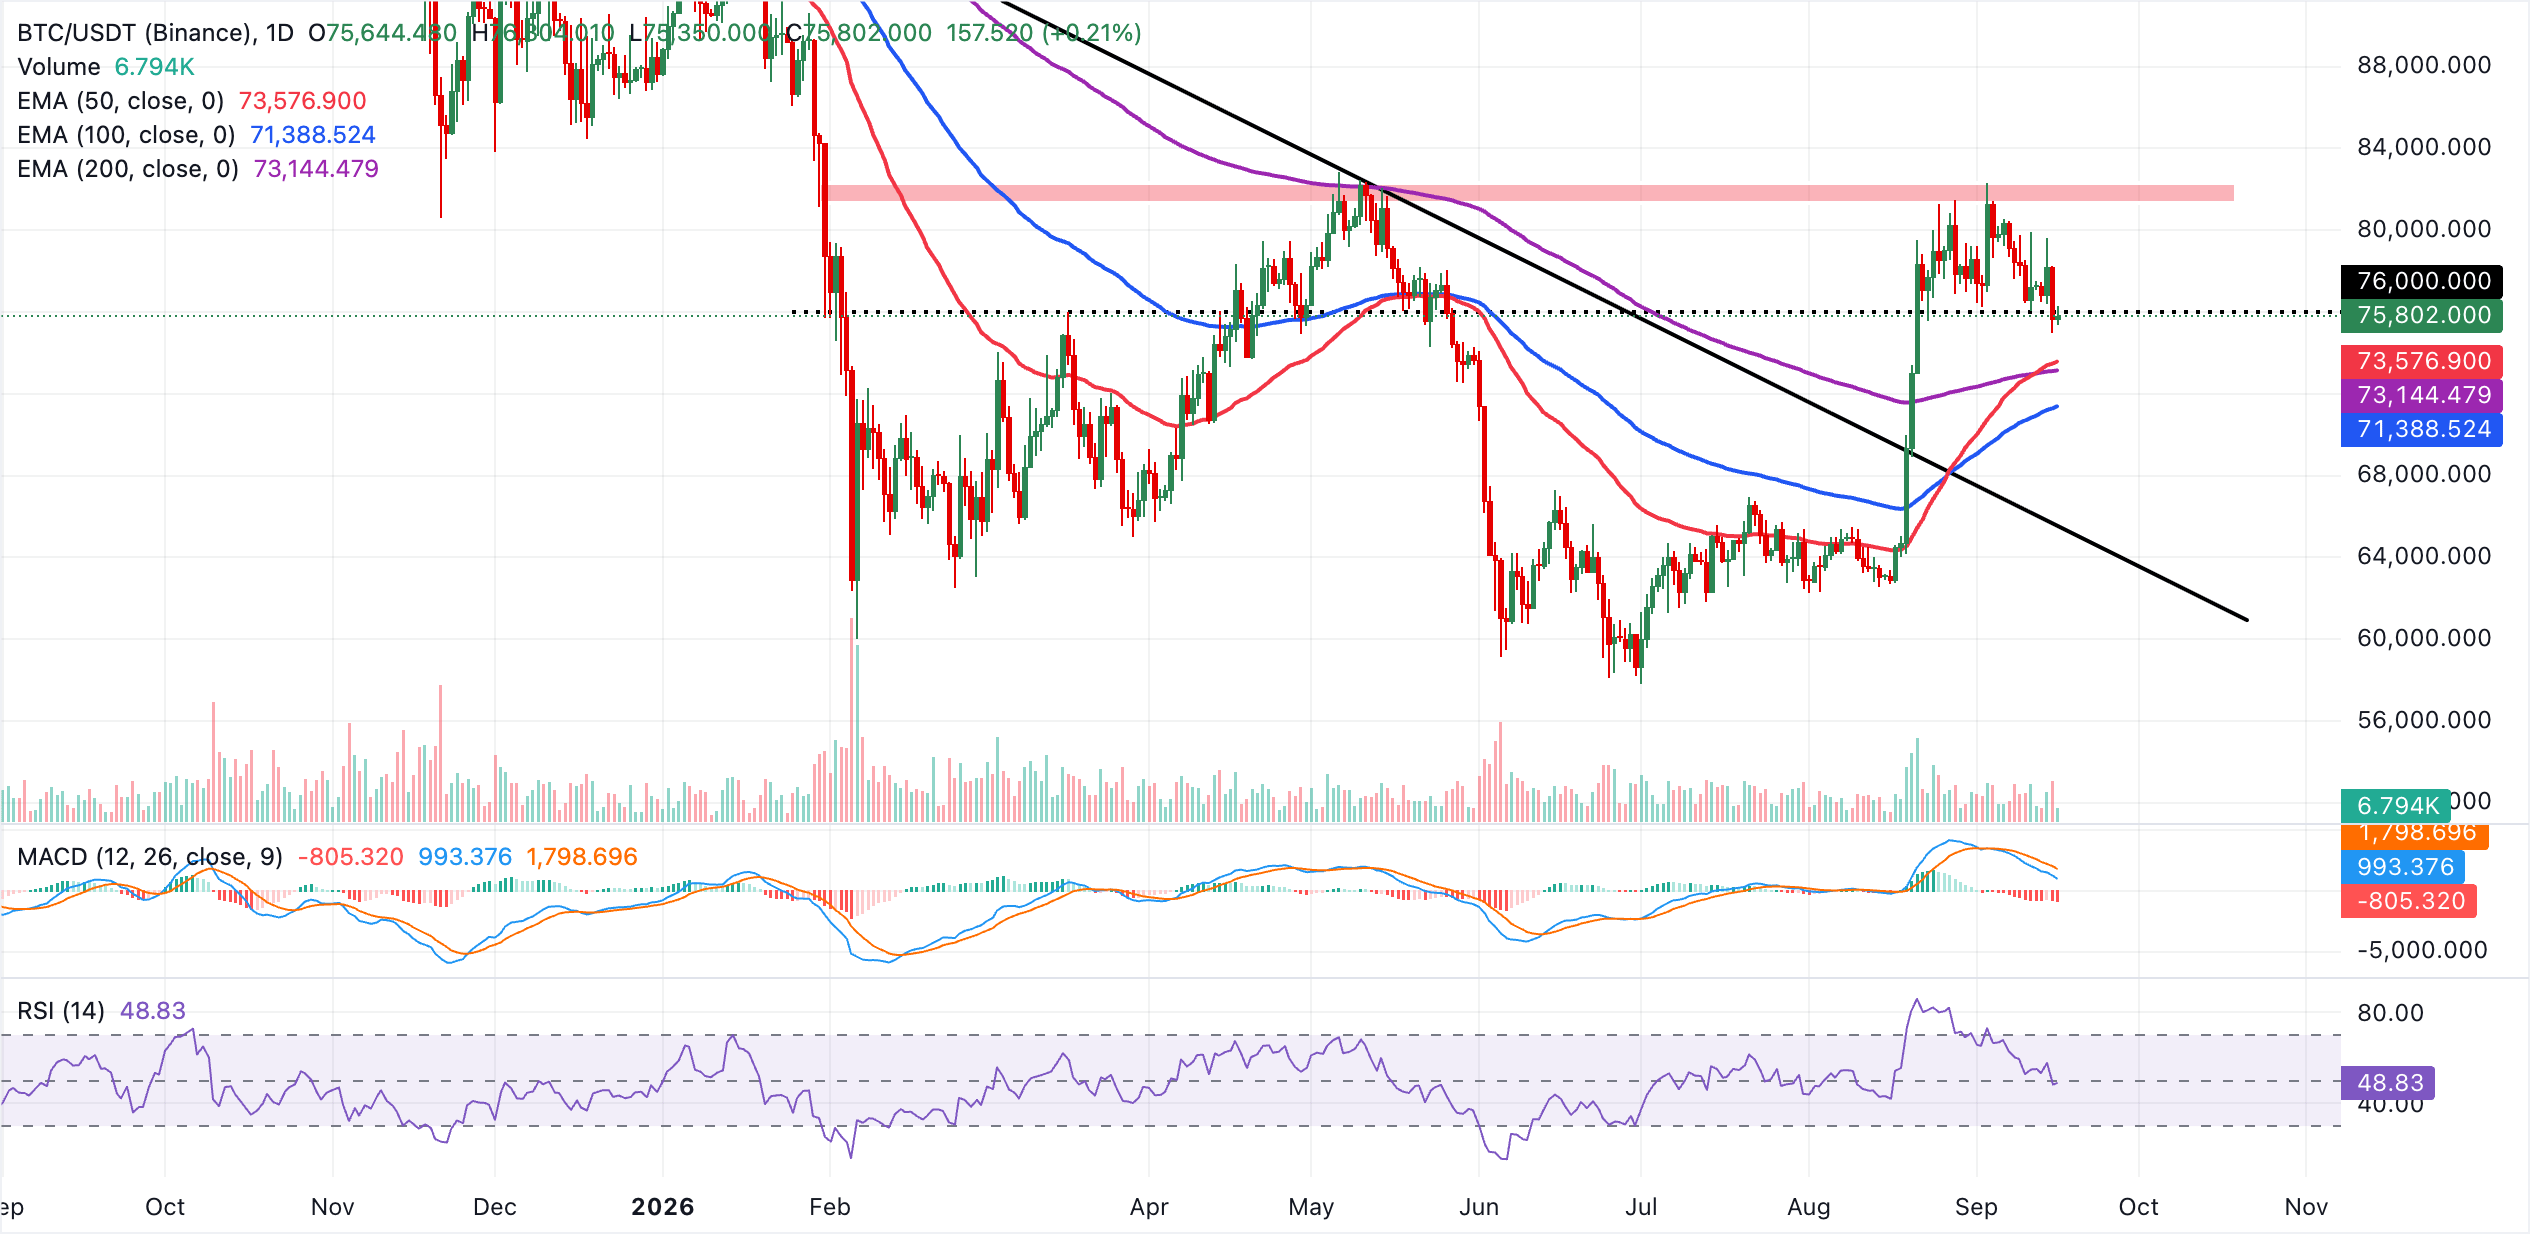
Initial support aligns with the 50-day EMA near $73,577, followed by the 200-day EMA at about $73,144 and the broken descending trendline region around $65,462, which now acts as a deeper structural floor if a larger correction unfolds. With no clearly defined resistance levels on the daily chart, upside scope is effectively open, and a daily close well above $76,000 would likely encourage another attempt higher. On the other hand, a break back below the EMA cluster would hint at a loss of bullish control.
Gold technical analysis: XAU attempts recovery
Gold is gaining ground above $4,300, as the 200-day EMA at $4,321 provides initial trend support, but remains capped by a nearby cluster of shorter EMAs. The 50-day EMA at $4,346 and the 100-day EMA at $4,364 sit overhead as immediate resistance, suggesting a consolidative tone after the recent bounce.
Momentum is mixed, with the RSI near a neutral 48 and the MACD in negative territory, suggesting upside attempts could remain vulnerable while price trades below this short-term EMA band.
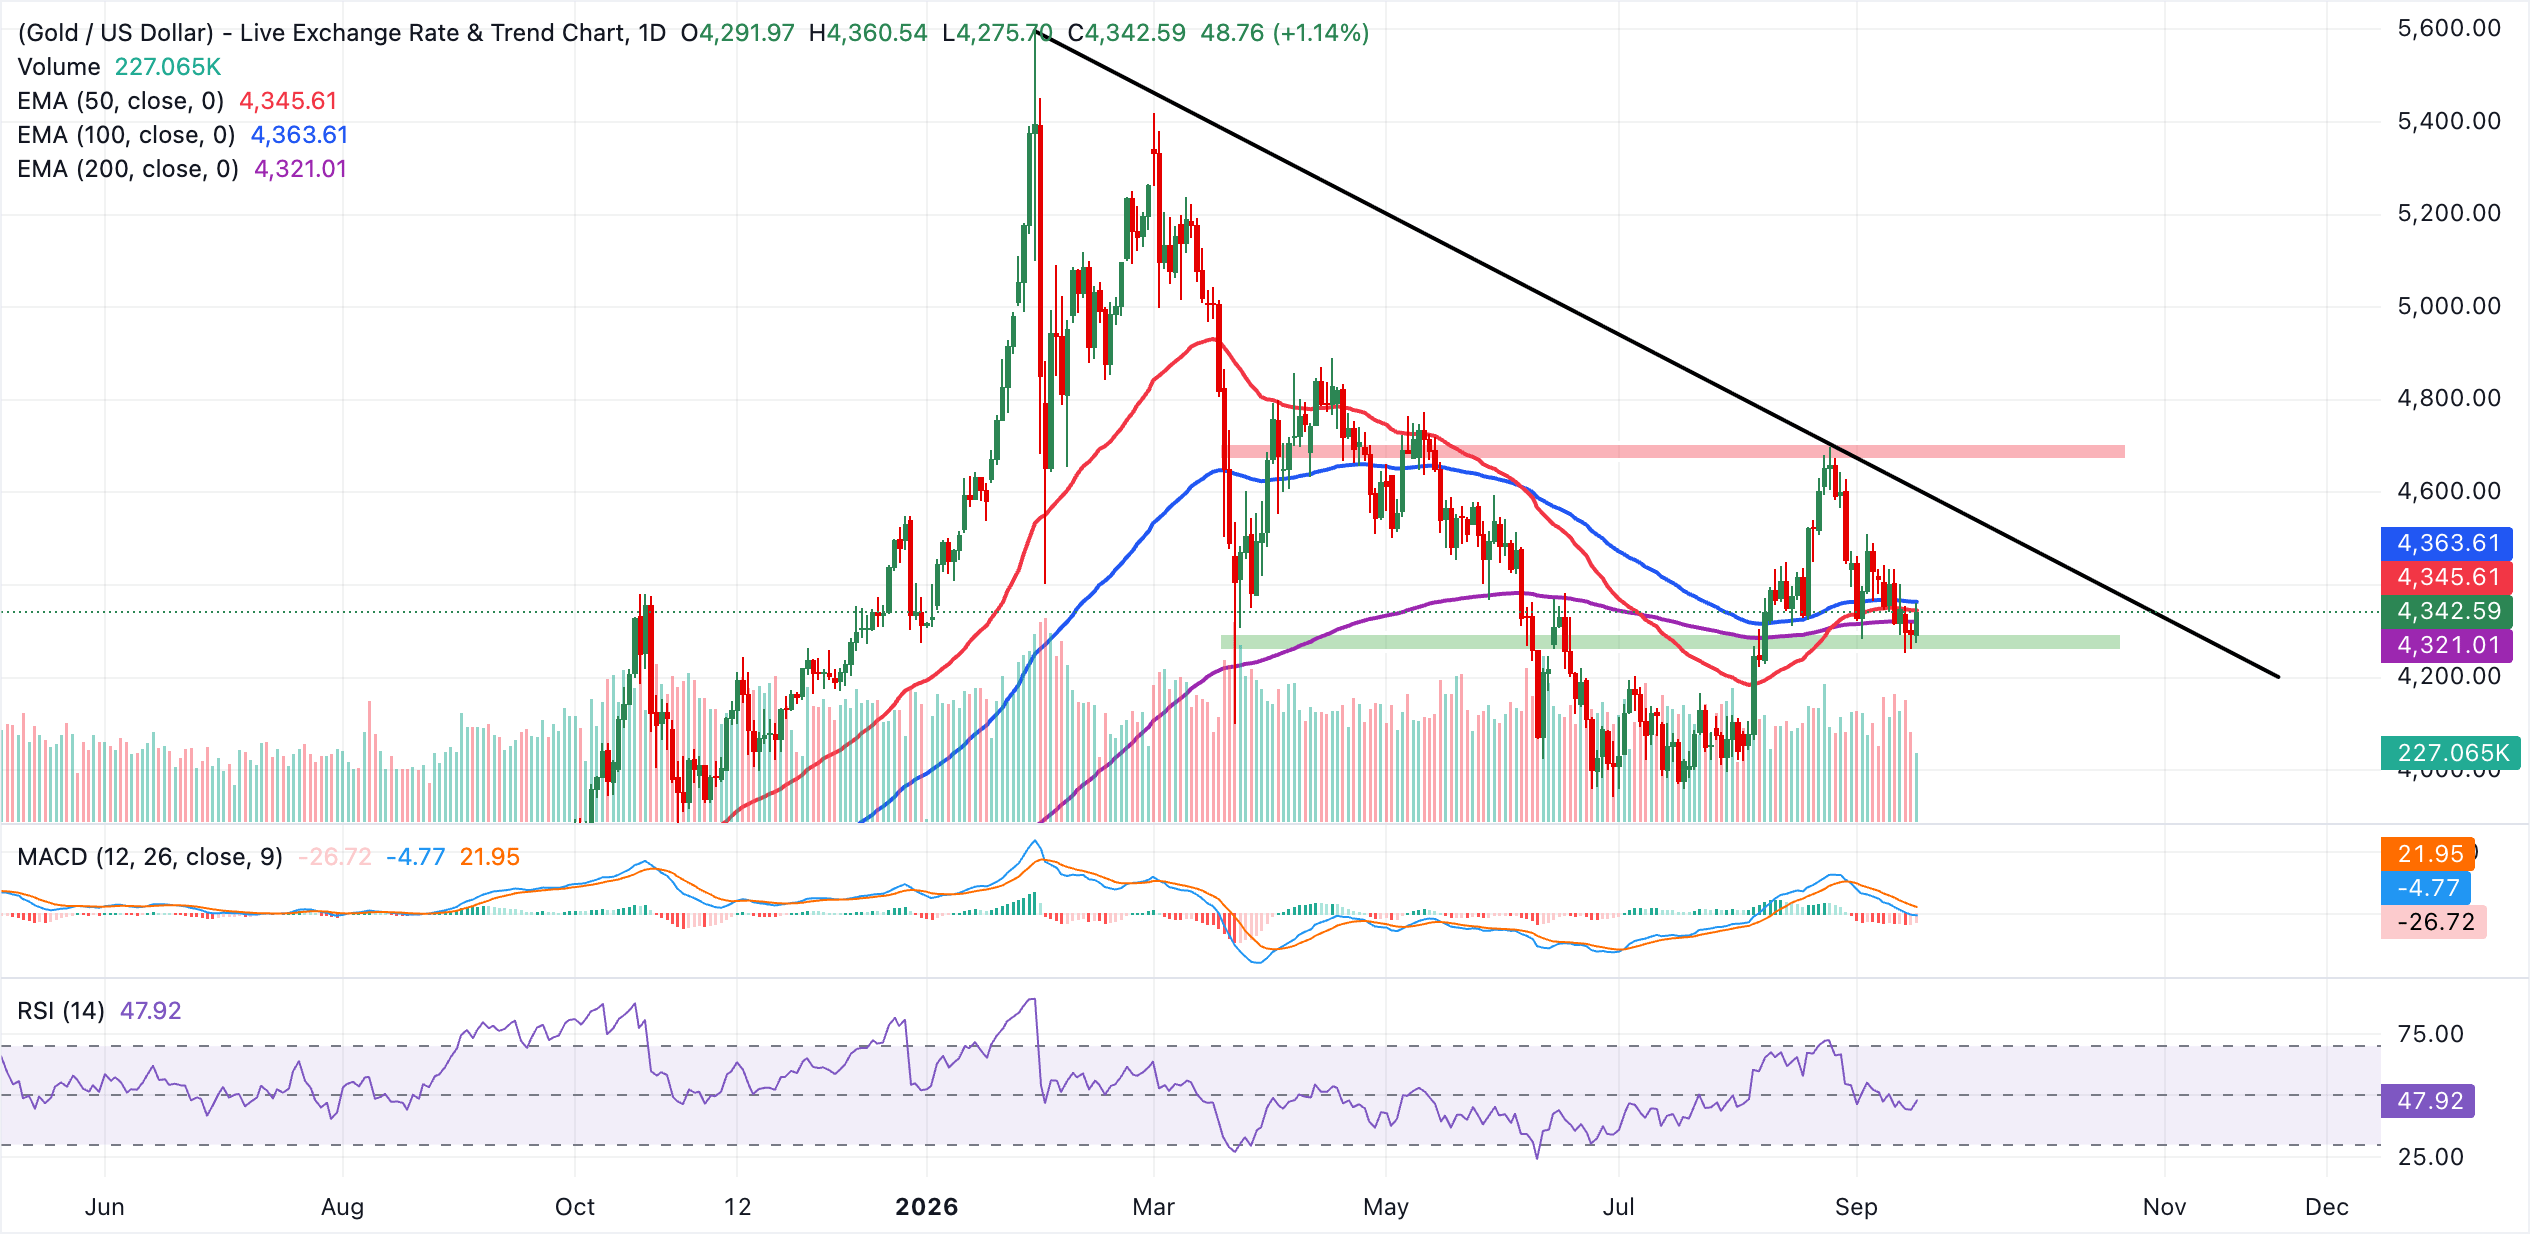
On the topside, immediate resistance is seen at the 50-day EMA at $4,346, followed by the 100-day EMA at $4,364. A sustained break above this zone would open the way toward the next technical barrier near the descending resistance trendline break price at $4,513. On the downside, the 200-day EMA at $4,321 forms the first meaningful support, and a daily close below this level would likely reinforce a softer bias and expose a deeper pullback toward the lower recent range. Holding above it keeps XAU in a broader consolidation phase.
(The technical analysis of this story was written with the help of an AI tool. Know more.)
Crypto ETF FAQs
An Exchange-Traded Fund (ETF) is an investment vehicle or an index that tracks the price of an underlying asset. ETFs can not only track a single asset, but a group of assets and sectors. For example, a Bitcoin ETF tracks Bitcoin’s price. ETF is a tool used by investors to gain exposure to a certain asset.
Yes. The first Bitcoin futures ETF in the US was approved by the US Securities & Exchange Commission in October 2021. A total of seven Bitcoin futures ETFs have been approved, with more than 20 still waiting for the regulator’s permission. The SEC says that the cryptocurrency industry is new and subject to manipulation, which is why it has been delaying crypto-related futures ETFs for the last few years.
Yes. The SEC approved in January 2024 the listing and trading of several Bitcoin spot Exchange-Traded Funds, opening the door to institutional capital and mainstream investors to trade the main crypto currency. The decision was hailed by the industry as a game changer.
The main advantage of crypto ETFs is the possibility of gaining exposure to a cryptocurrency without ownership, reducing the risk and cost of holding the asset. Other pros are a lower learning curve and higher security for investors since ETFs take charge of securing the underlying asset holdings. As for the main drawbacks, the main one is that as an investor you can’t have direct ownership of the asset, or, as they say in crypto, “not your keys, not your coins.” Other disadvantages are higher costs associated with holding crypto since ETFs charge fees for active management. Finally, even though investing in ETFs reduces the risk of holding an asset, price swings in the underlying cryptocurrency are likely to be reflected in the investment vehicle too.
추천 기사


