


Bitcoin vs Gold: Risk-on sentiment fuels rallies in BTC and XAU
- Bitcoin rallies 25% in five days, testing the resistance at $78,000 as bulls eye an extended breakout.
- Gold gains momentum and trades around $4,600, supported by a strong bullish MACD signal.
- Risk appetite broadly improves, encouraging capital inflows through ETFs.
Bitcoin (BTC) upholds a strong bullish outlook, trading near $78,000 on Friday. Since Monday, the Crypto King has surged by roughly 25%, reflecting a notable shift in risk appetite, especially through Exchange-Traded Funds (ETFs) and derivatives.
Meanwhile, Gold (XAU/USD) is gaining momentum and trading above $4,600, underpinned by bullish technicals and buy-back demand.
Bitcoin attracts ETF inflows as sentiment improves
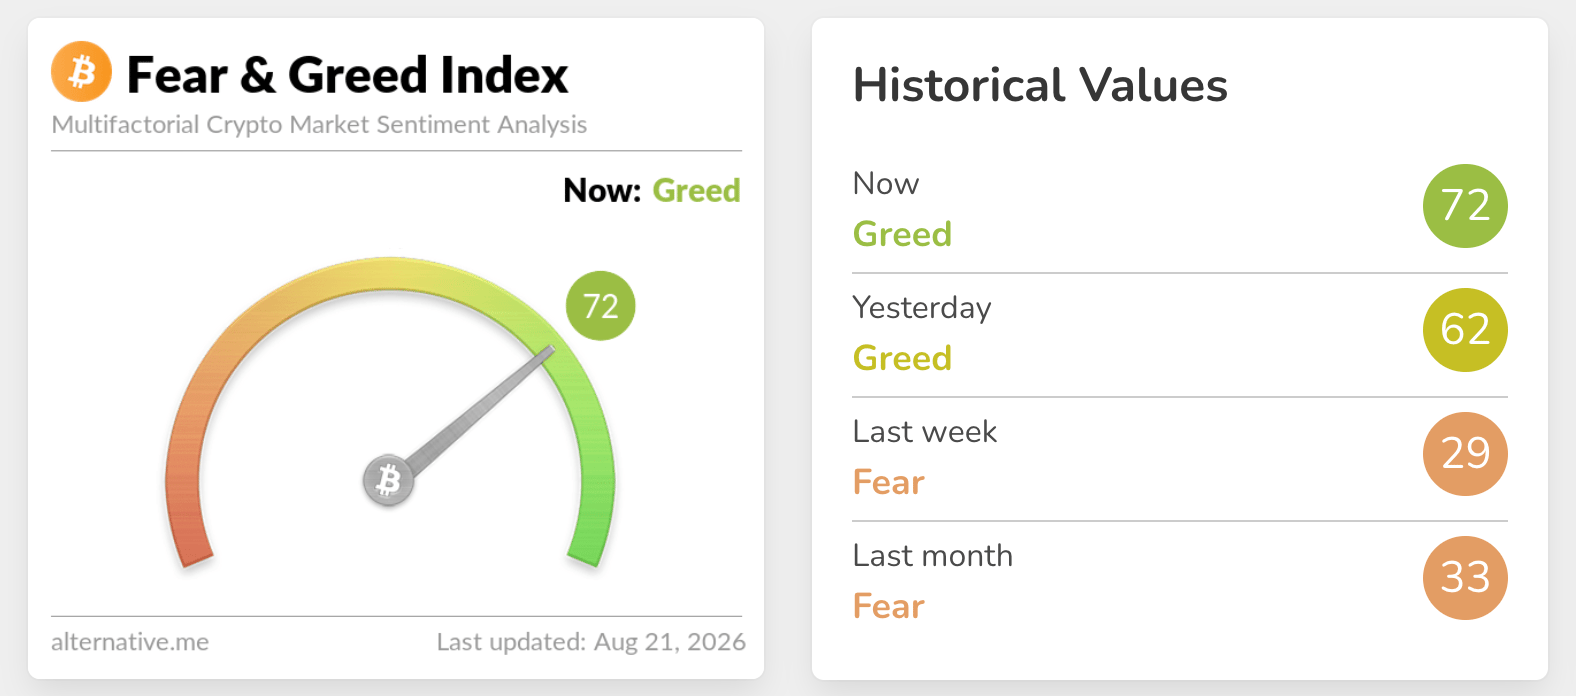
Risk appetite has improved aggressively this week, with the Fear & Greed Index at 72 in the Fear territory on Friday, up from 62 the day before. The index averaged 29 last week and 33 last month, underpinning growing risk-on sentiment.
The broader crypto rally can also be attributed to remarks by United States (US) President Donald Trump during a White House event attended by crypto executives, including Coinbase CEO Brian Armstrong and Robinhood CEO Vlad Tenev, on Wednesday. Trump urged Congress to pass the CLARITY Act, a comprehensive regulatory framework, to lift institutional confidence in Bitcoin and the broader crypto industry.
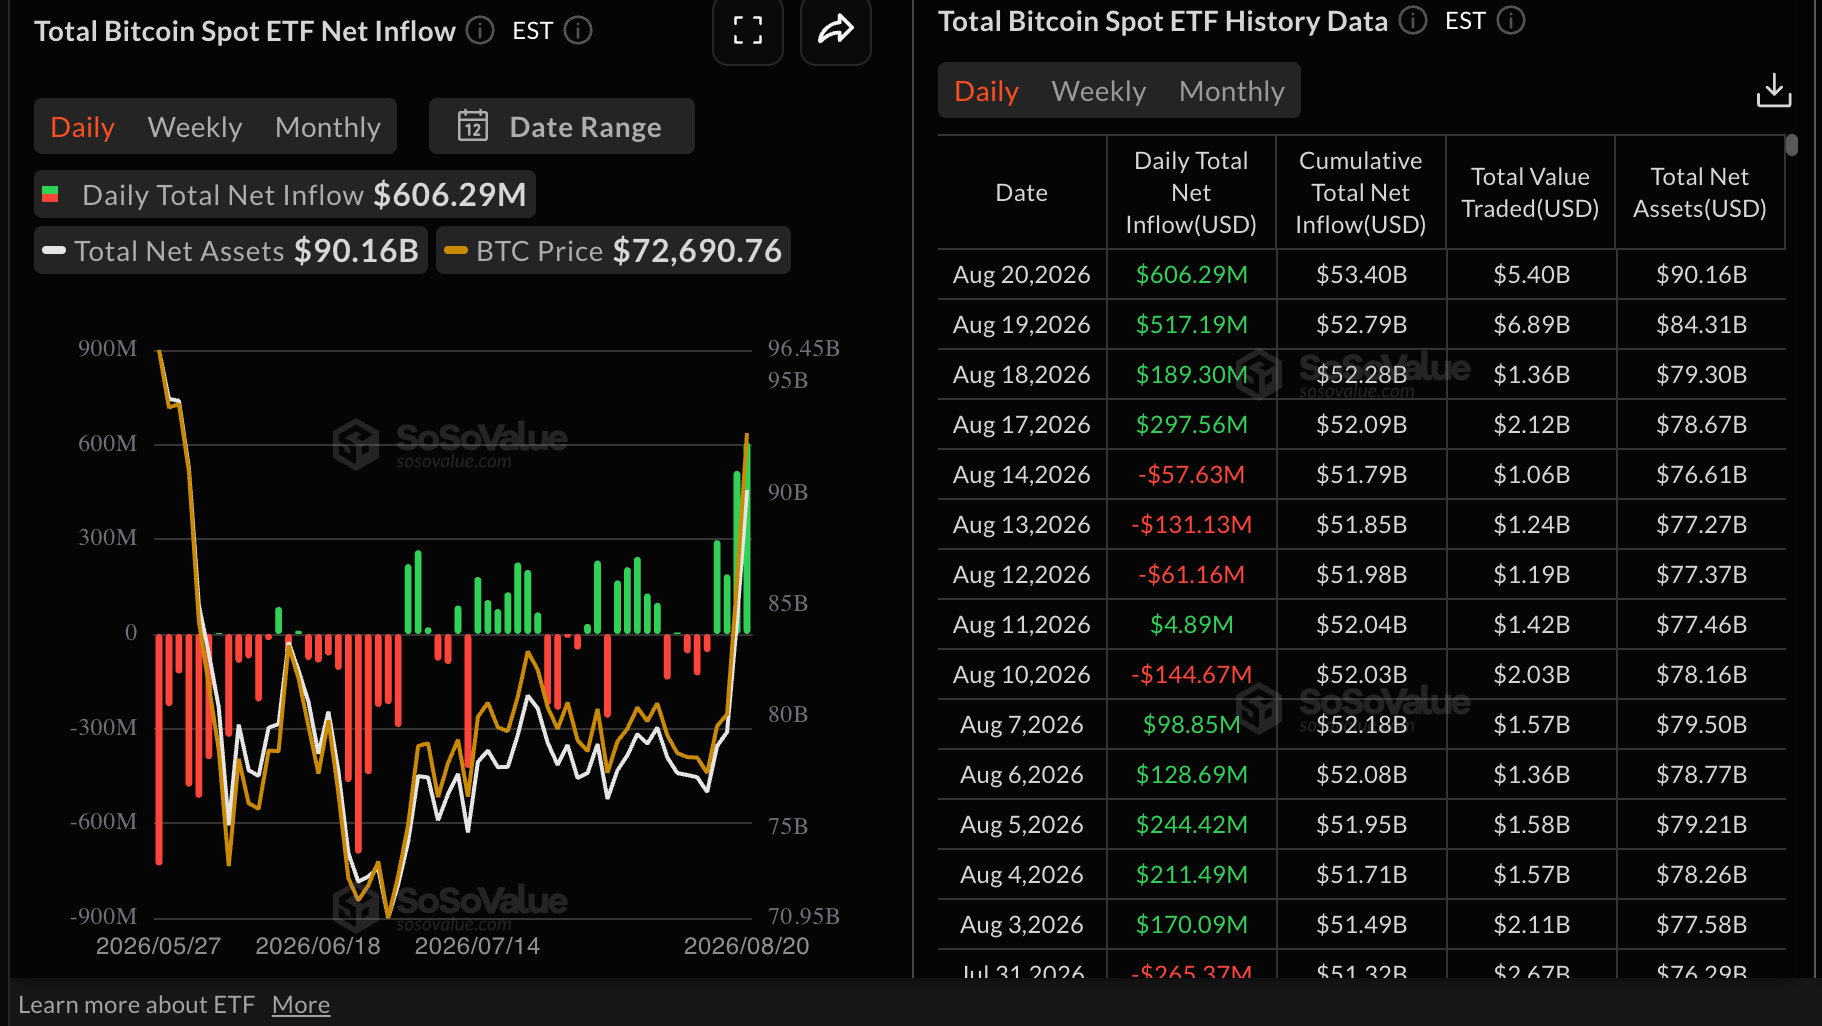
Meanwhile, capital continues to flow into US-listed spot ETFs, with $606 million recorded on Thursday. According to SoSoValue, BTC ETFs are now on their fourth consecutive day of inflows, with $298 million posted on Monday, $189 million recorded on Tuesday and $517 million on Wednesday. If sustained, higher demand could drive the breakout above $80,000.
Technical analysis: Bitcoin extends constructive momentum
Bitcoin trades at $77,665, extending a strong bullish bias as price holds well above the 50-day, 100-day and 200-day Exponential Moving Averages (EMAs), reinforcing a supportive trend structure.
The SuperTrend line at $69,127 also sits below spot, suggesting the recent breakout is backed by trend-following support, while an overheated Relative Strength Index (RSI) near 85 points to overbought conditions even as the Moving Average Convergence Divergence (MACD) accelerates higher, hinting at robust positive momentum.
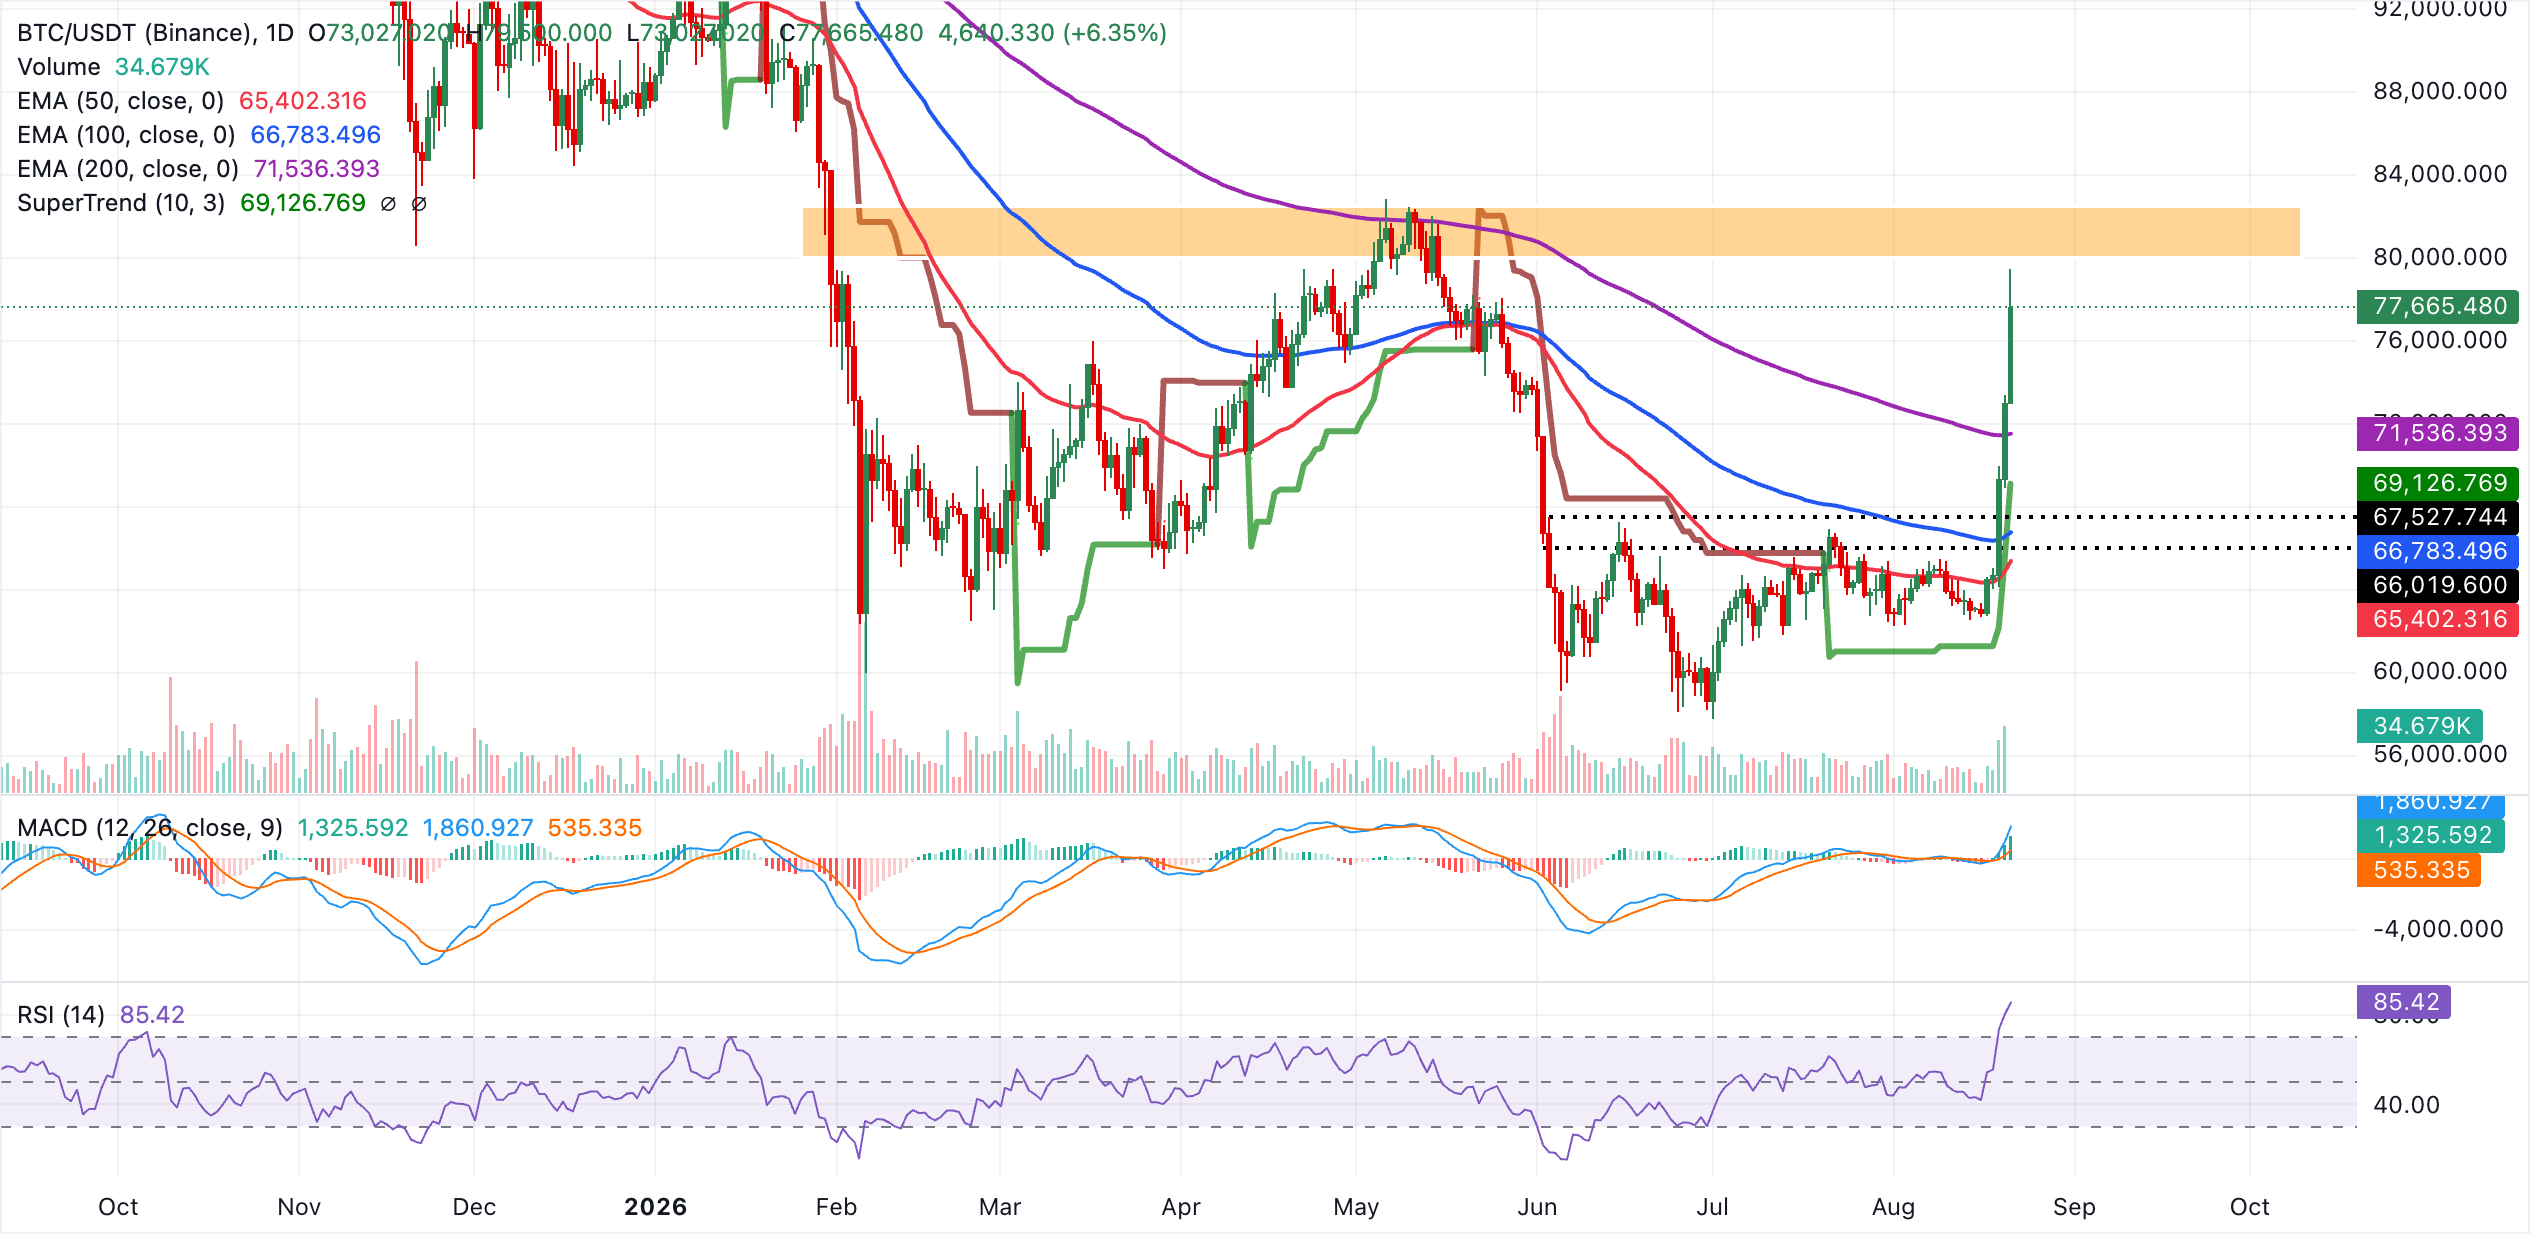
Initial demand is seen at the SuperTrend support near $69,127, ahead of the 200-day EMA at $71,536, which should act as a deeper structural floor if a corrective pullback develops. Below these levels, the 100-day EMA at $66,783 and the 50-day EMA at $65,402 form an underlying cluster of dynamic support, where buyers would likely re-emerge should overbought conditions trigger a more pronounced retracement.
"The rally could target as high as $83,000, which is Bitcoin’s 365-day moving average, a key technical level," CryptoQuant said in an exclusive comment.
Gold's bullish outlook persists
XAU/USD trades at $4,602, extending a strong bullish phase as price holds well above the short, medium and long-term EMAs. The SuperTrend line at $4,253 reinforces the underlying uptrend, while momentum stays elevated.
At the same time, the RSI at 70 on the daily chart signals overbought conditions, while the MACD indicator shows a positive reading around 33, suggesting persistent upside pressure despite the risk of a near-term pause.
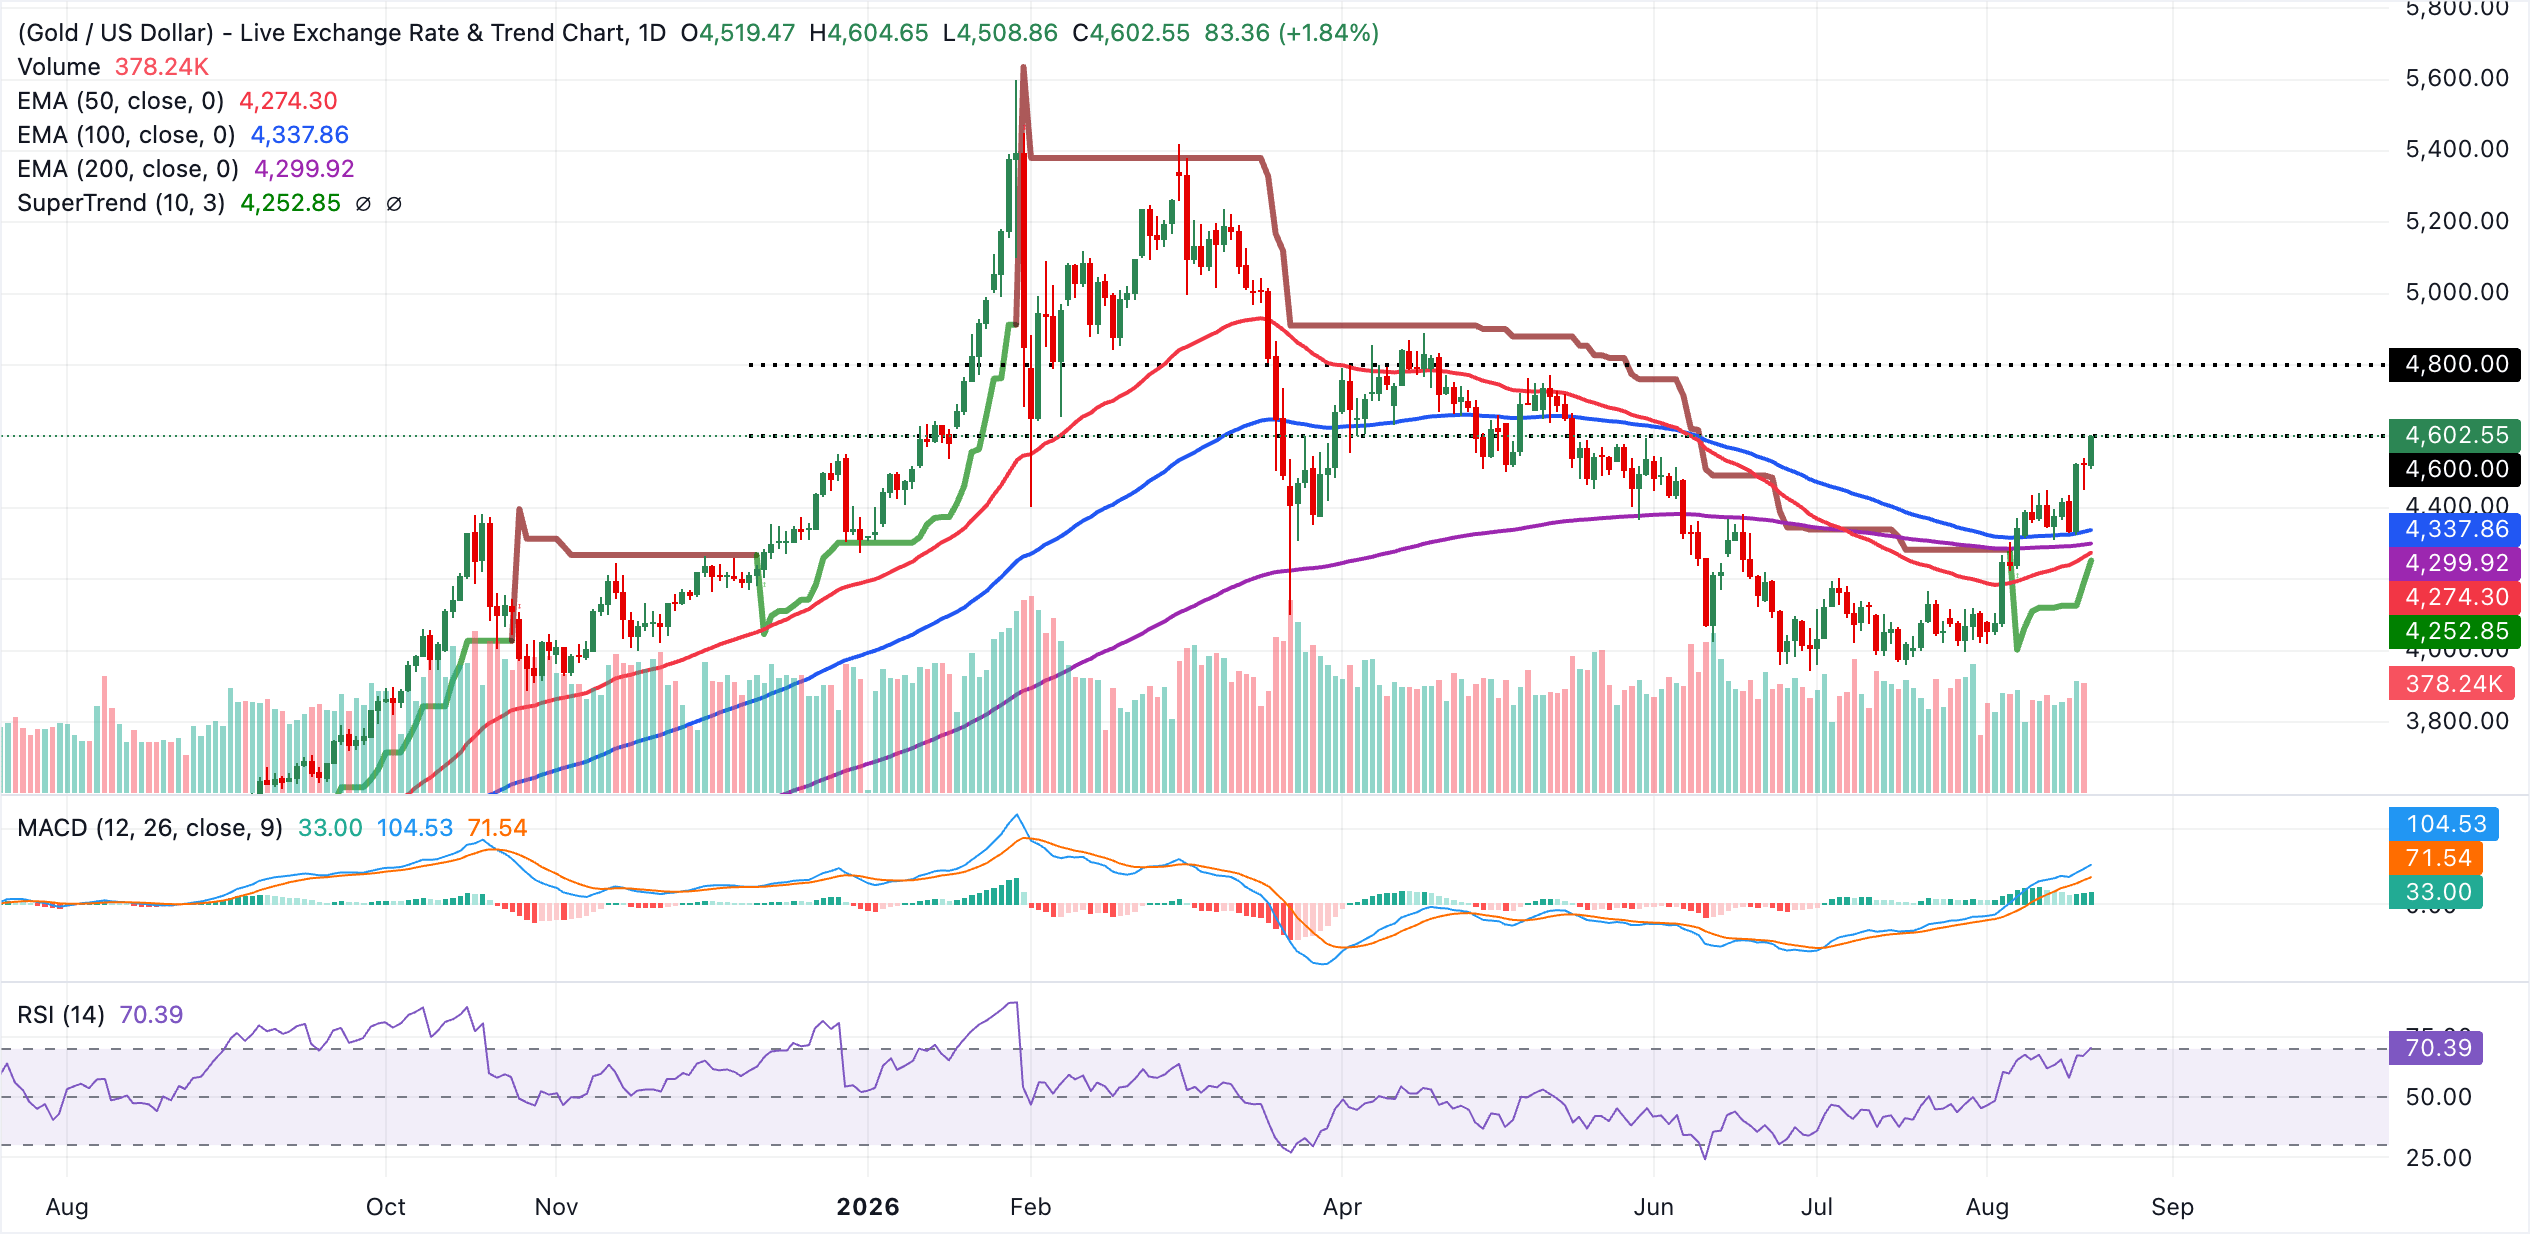
Initial support lies at the 100-day EMA near $4,338, followed by the 200-day EMA at $4,300 and the 50-day EMA around $4,274, which together form a dense demand zone before the SuperTrend support at $4,253. As long as XAU/USD holds above these clustered supports, the technical bias stays constructive, and any corrective pullback would likely be treated as a consolidation within the broader bullish trend rather than a reversal.
Gold’s rally is underpinned by heightened macroeconomic uncertainty, prompting market participants to increase allocations to the precious metal as a defensive hedge. The biggest trigger this week was the US Treasury’s surprise decision to double its liquidity-support buybacks for longer-dated government securities to at least $4 billion per operation.
(The technical analysis of this story was written with the help of an AI tool. Know more.)
Crypto ETF FAQs
An Exchange-Traded Fund (ETF) is an investment vehicle or an index that tracks the price of an underlying asset. ETFs can not only track a single asset, but a group of assets and sectors. For example, a Bitcoin ETF tracks Bitcoin’s price. ETF is a tool used by investors to gain exposure to a certain asset.
Yes. The first Bitcoin futures ETF in the US was approved by the US Securities & Exchange Commission in October 2021. A total of seven Bitcoin futures ETFs have been approved, with more than 20 still waiting for the regulator’s permission. The SEC says that the cryptocurrency industry is new and subject to manipulation, which is why it has been delaying crypto-related futures ETFs for the last few years.
Yes. The SEC approved in January 2024 the listing and trading of several Bitcoin spot Exchange-Traded Funds, opening the door to institutional capital and mainstream investors to trade the main crypto currency. The decision was hailed by the industry as a game changer.
The main advantage of crypto ETFs is the possibility of gaining exposure to a cryptocurrency without ownership, reducing the risk and cost of holding the asset. Other pros are a lower learning curve and higher security for investors since ETFs take charge of securing the underlying asset holdings. As for the main drawbacks, the main one is that as an investor you can’t have direct ownership of the asset, or, as they say in crypto, “not your keys, not your coins.” Other disadvantages are higher costs associated with holding crypto since ETFs charge fees for active management. Finally, even though investing in ETFs reduces the risk of holding an asset, price swings in the underlying cryptocurrency are likely to be reflected in the investment vehicle too.
추천 기사


