


Crypto Overview: Bitcoin remains vulnerable – Venice, Sky extend gains
- Bitcoin struggles above the 50-day EMA around $64,368 on Wednesday, suggesting persistent downside pressure.
- The Fear and Greed Index rises to 41, reflecting a shift to neutral sentiment from the prevailing risk-off phase.
- Venice and Sky emerge as top performers among leading altcoins over the last 24 hours.
Bitcoin (BTC) hovers above $64,000 on Wednesday, facing persistent headwinds amid hopes of a potential bullish reversal. Crypto market sentiment shows early signs of shifting away from risk-averse conditions, while Venice Token (VVV) and Sky (SKY) are leading gains over the past 24 hours.
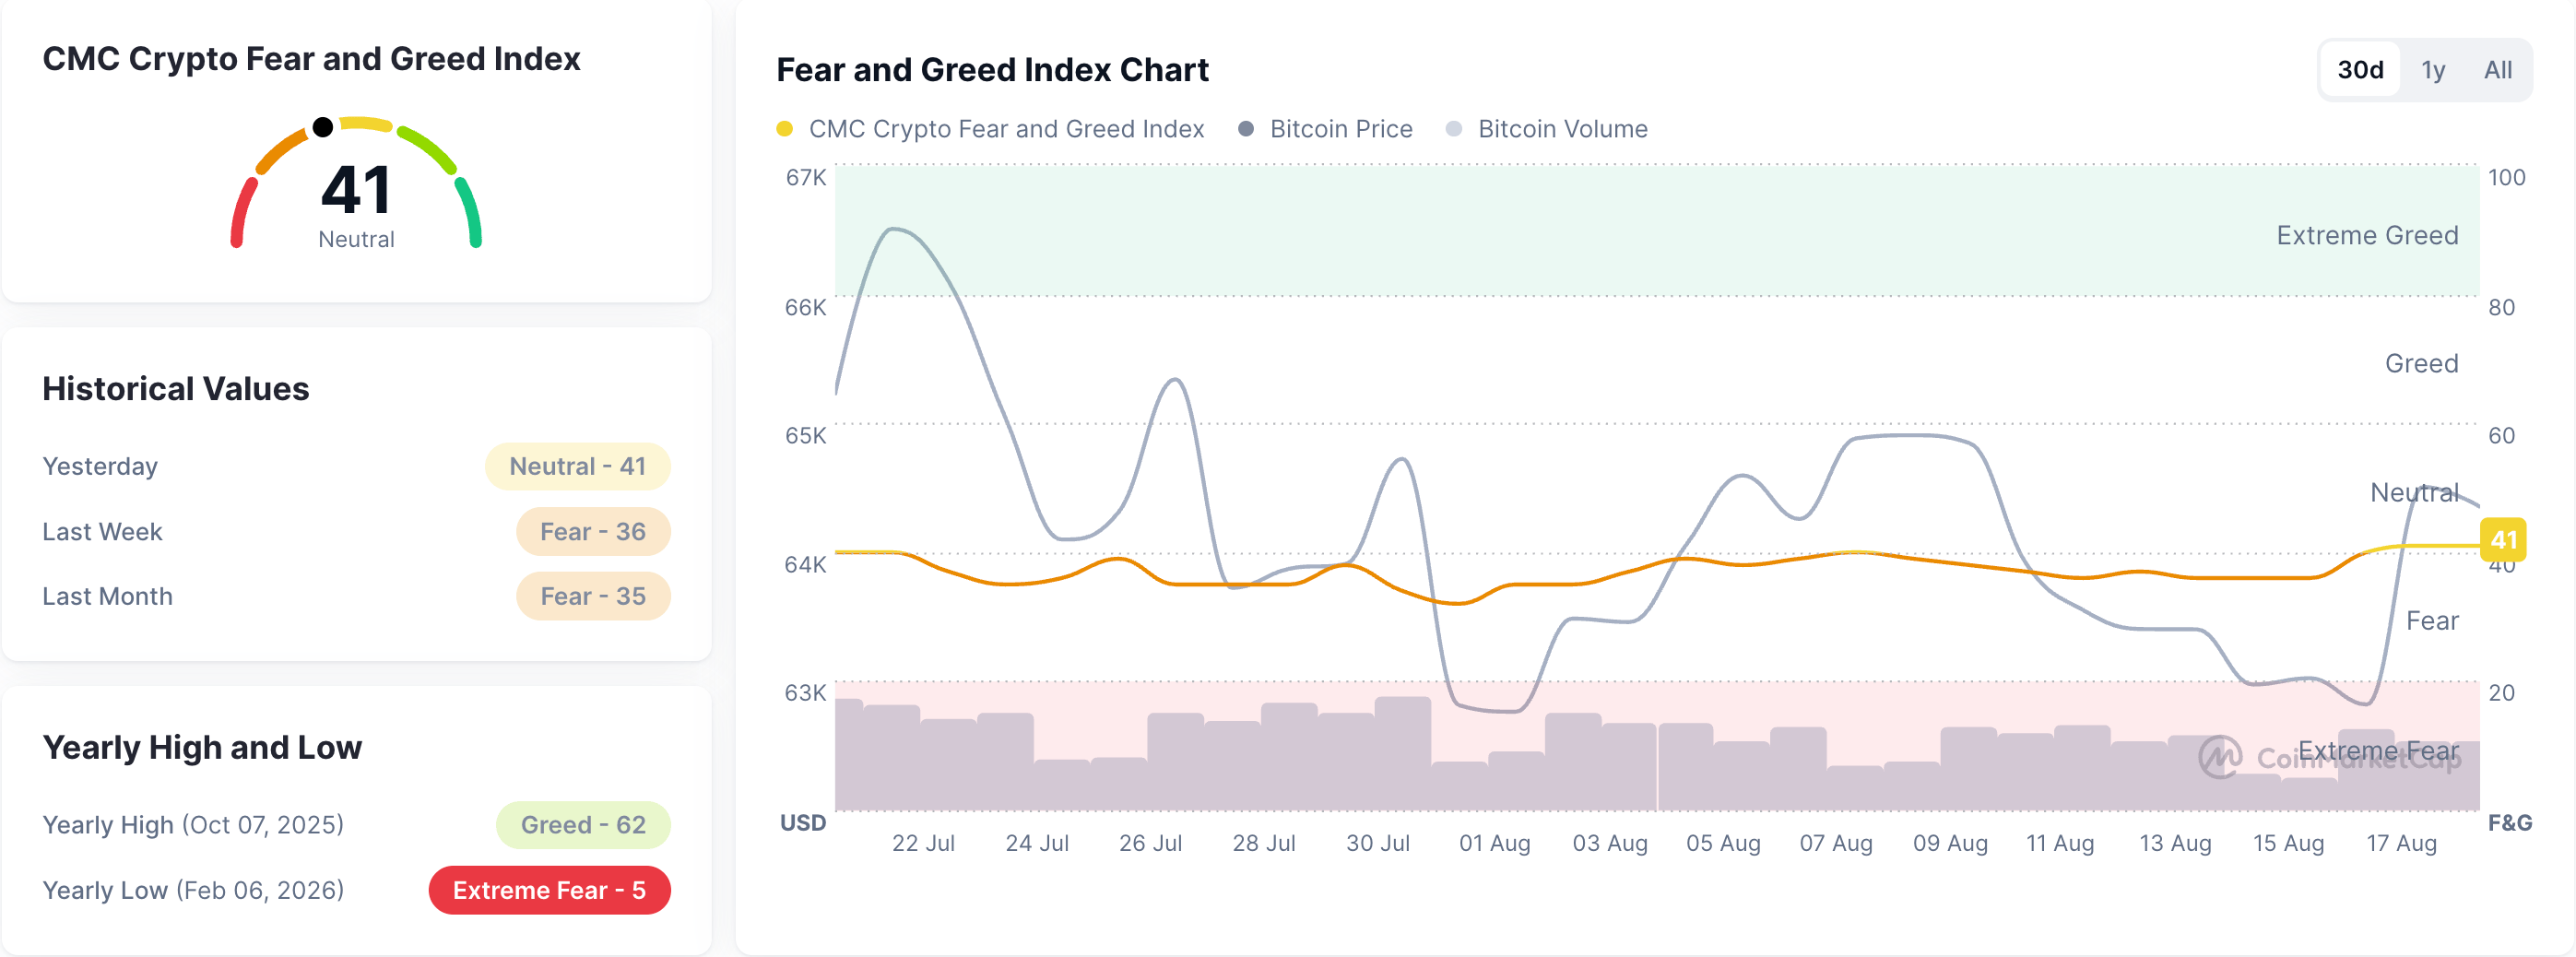
CoinMarketCap’s Fear and Greed Index at 41 on Wednesday rises into the neutral territory, indicating a mild shift from risk-off sentiment among investors.
Technical outlook: Will Bitcoin extend its recovery?
Bitcoin trades around $64,384 at press time on Wednesday, edging lower toward the 50-day Exponential Moving Average (EMA) at roughly $64,368, suggesting a mildly bearish near-term bias. Still, the King Crypto also respects the rising support trendline drawn from $61,307 and the 23.6% Fibonacci retracement of the $82,850 to $57,800 downswing at $63,712, underpinning the broader constructive structure.
Momentum is supportive rather than aggressive, with the Relative Strength Index (RSI) at 52 hovering slightly above the neutral 50 mark, and the Moving Average Convergence Divergence (MACD) and signal line moving flat near the halfway line, hinting that downside attempts are being absorbed for now.
On the topside, initial resistance aligns with the 50% Fibonacci retracement near $69,200, while the 200-day EMA, higher up around $72,801, acts as a more strategic barrier that would need to give way to unlock a stronger bullish phase.
On the downside, immediate support is seen at the 50-day EMA near $64,369, followed by the 23.6% retracement at $63,712. A decisive break below this band would expose the next Fibonacci support region anchored toward $57,800 and weaken the prevailing upward bias.
Altcoins technical outlook: Will VVV and SKY sustain their rally?
Venice Token holds above $13.00, following a 20% surge earlier this week. VVV maintains a bullish near-term bias as price holds above both the 50-day EMA at $12.40 and the 200-day EMA at $10.41.
The AI token is facing immediate resistance at the 50% retracement of the downswing from $21.42 to $9.81, at $14.25, ahead of a higher barrier at the 78.6% retracement near $18.12.
The RSI around 63 indicates firm but not overextended upside pressure, reinforced by a positive MACD slope above its signal line, suggesting strengthening bullish momentum.
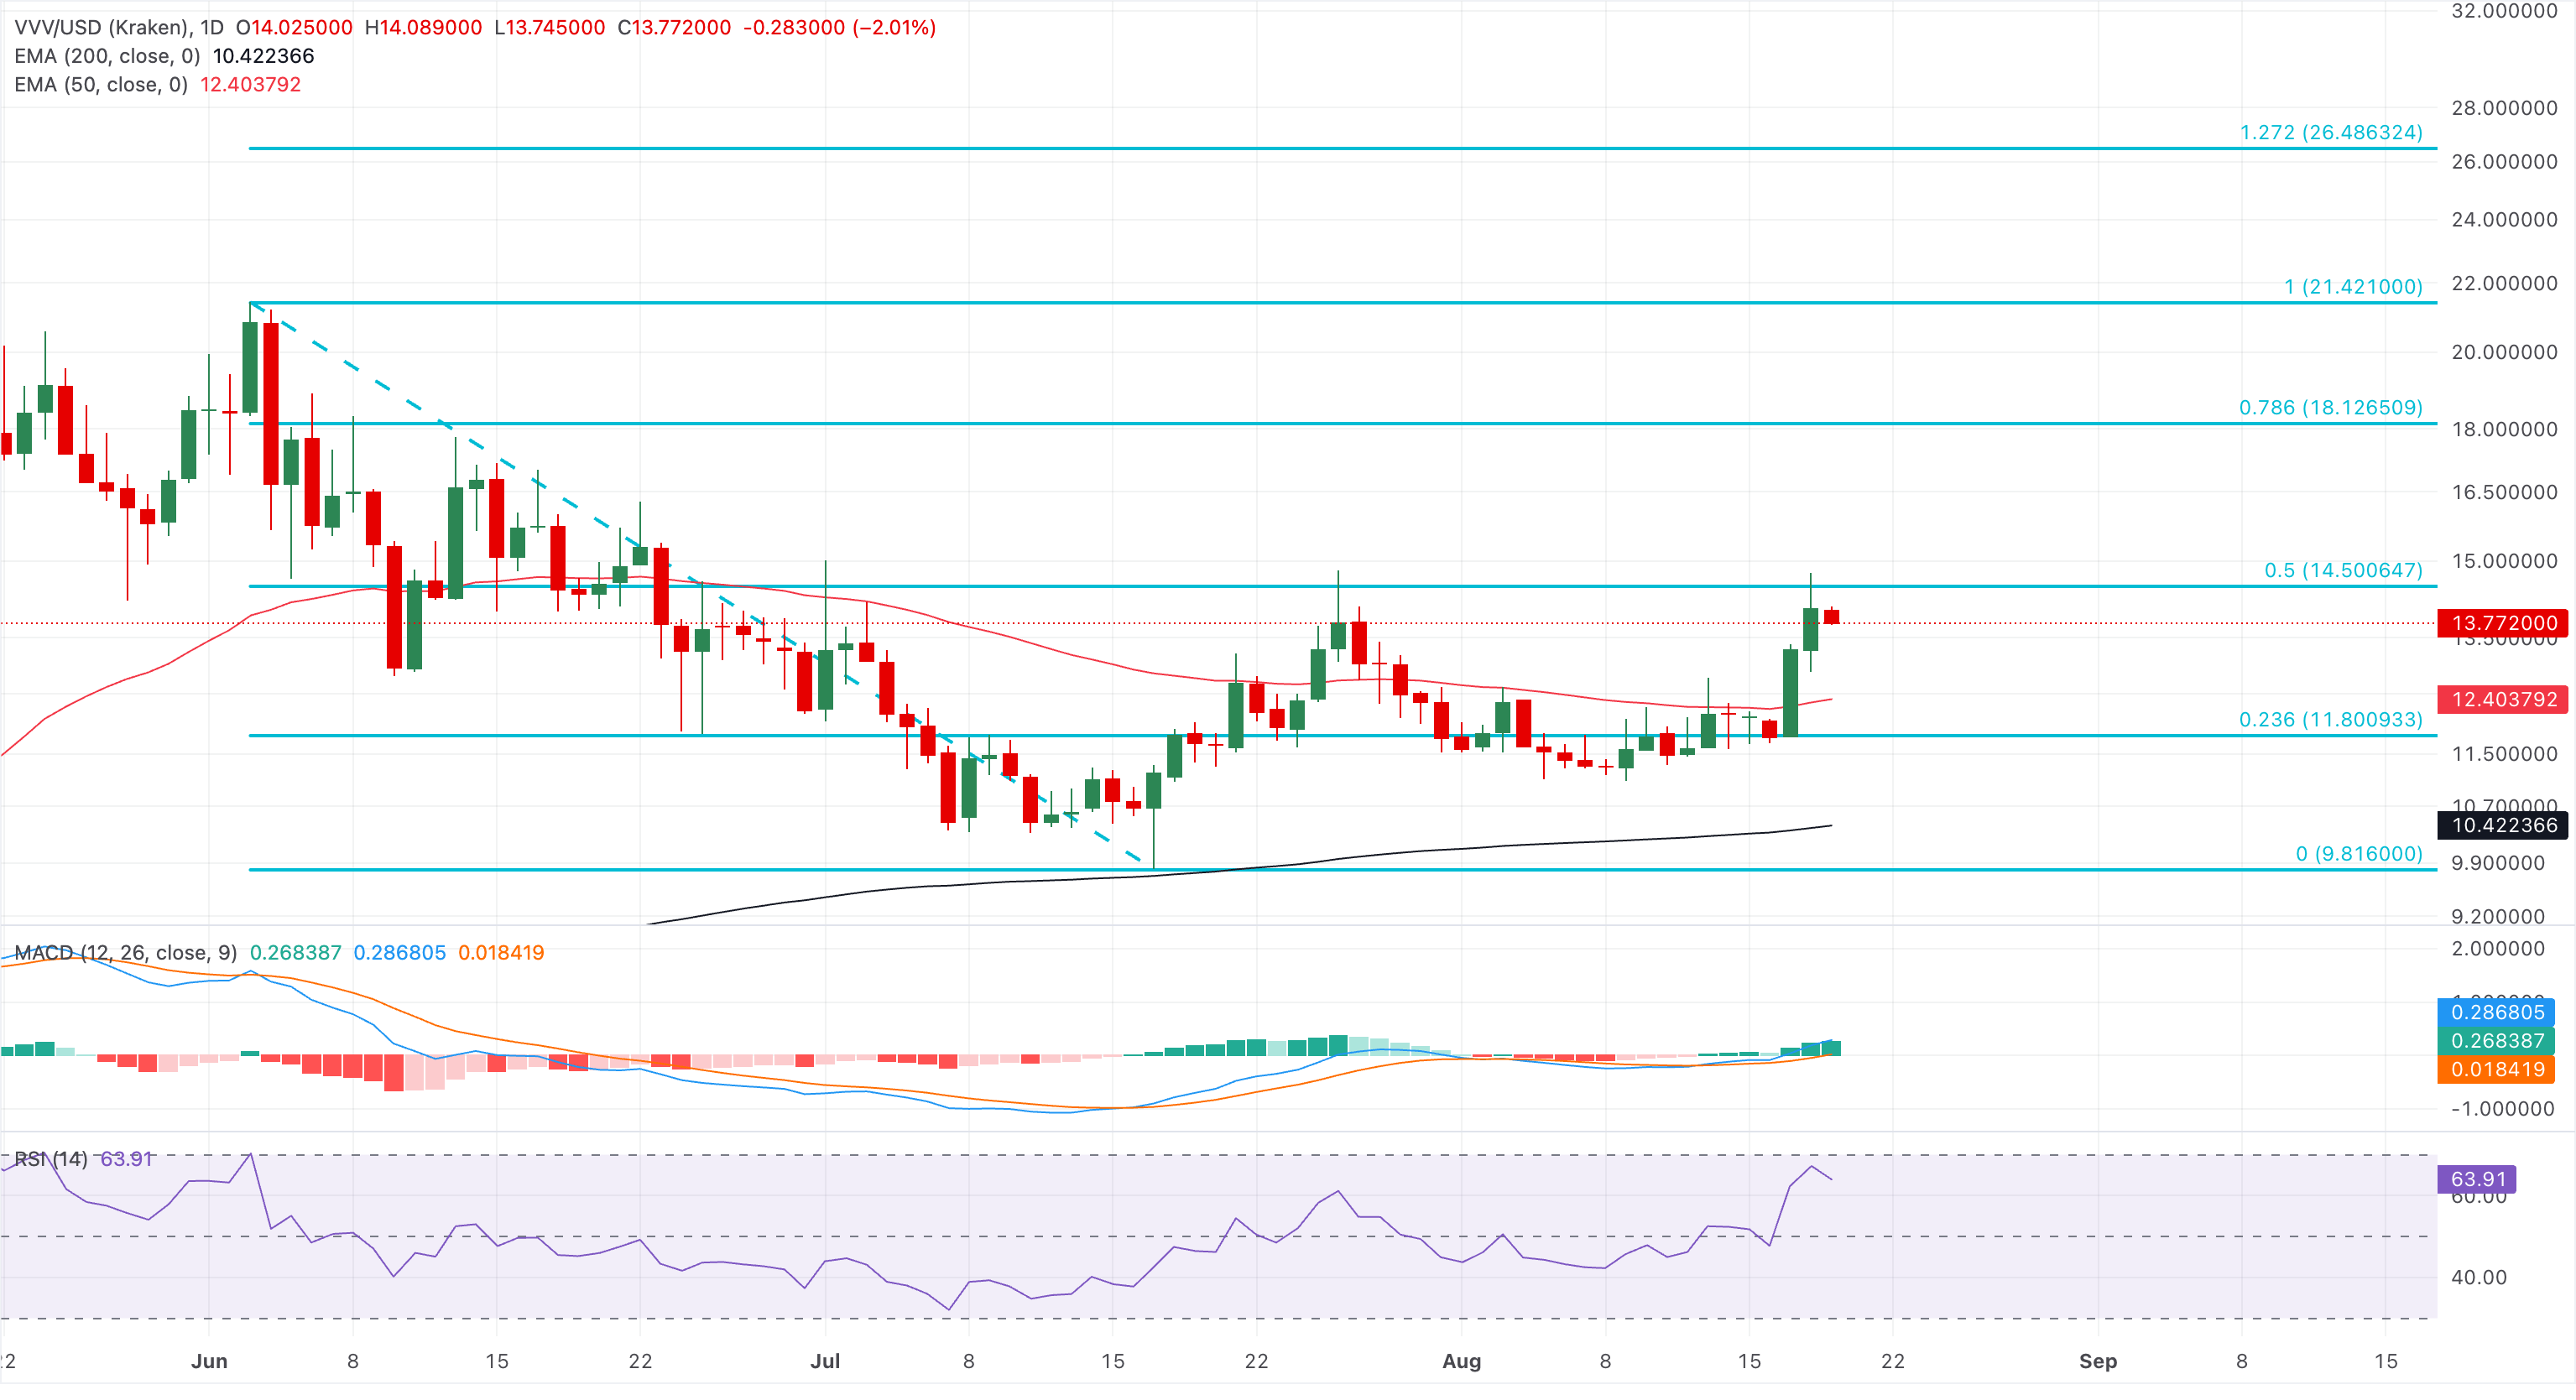
Looking down, immediate support is aligned with the 50-day EMA at $12.40, while a deeper pullback would expose the 23.6% Fibonacci retracement level at $11.80, followed by the 200-day EMA at $10.41.
Sky hovers above $0.0500 at press time on Wednesday, holding the 10% gains over the last three days. Still, SKY remains under pressure, holding below both the 50-day EMA at $0.0567 and the 200-day EMA at $0.0616, which keeps the broader bias bearish.
Momentum shows a modest near-term improvement, with the RSI near 54, crossing above its midline, and the MACD crossing above its signal line, suggesting that selling pressure is easing.
On the topside, initial resistance is seen at the 50-day EMA around $0.0567, with the resistance trendline near $0.0583 adding to overhead supply. A stronger recovery would face a more meaningful cap at the 200-day EMA at $0.0616.
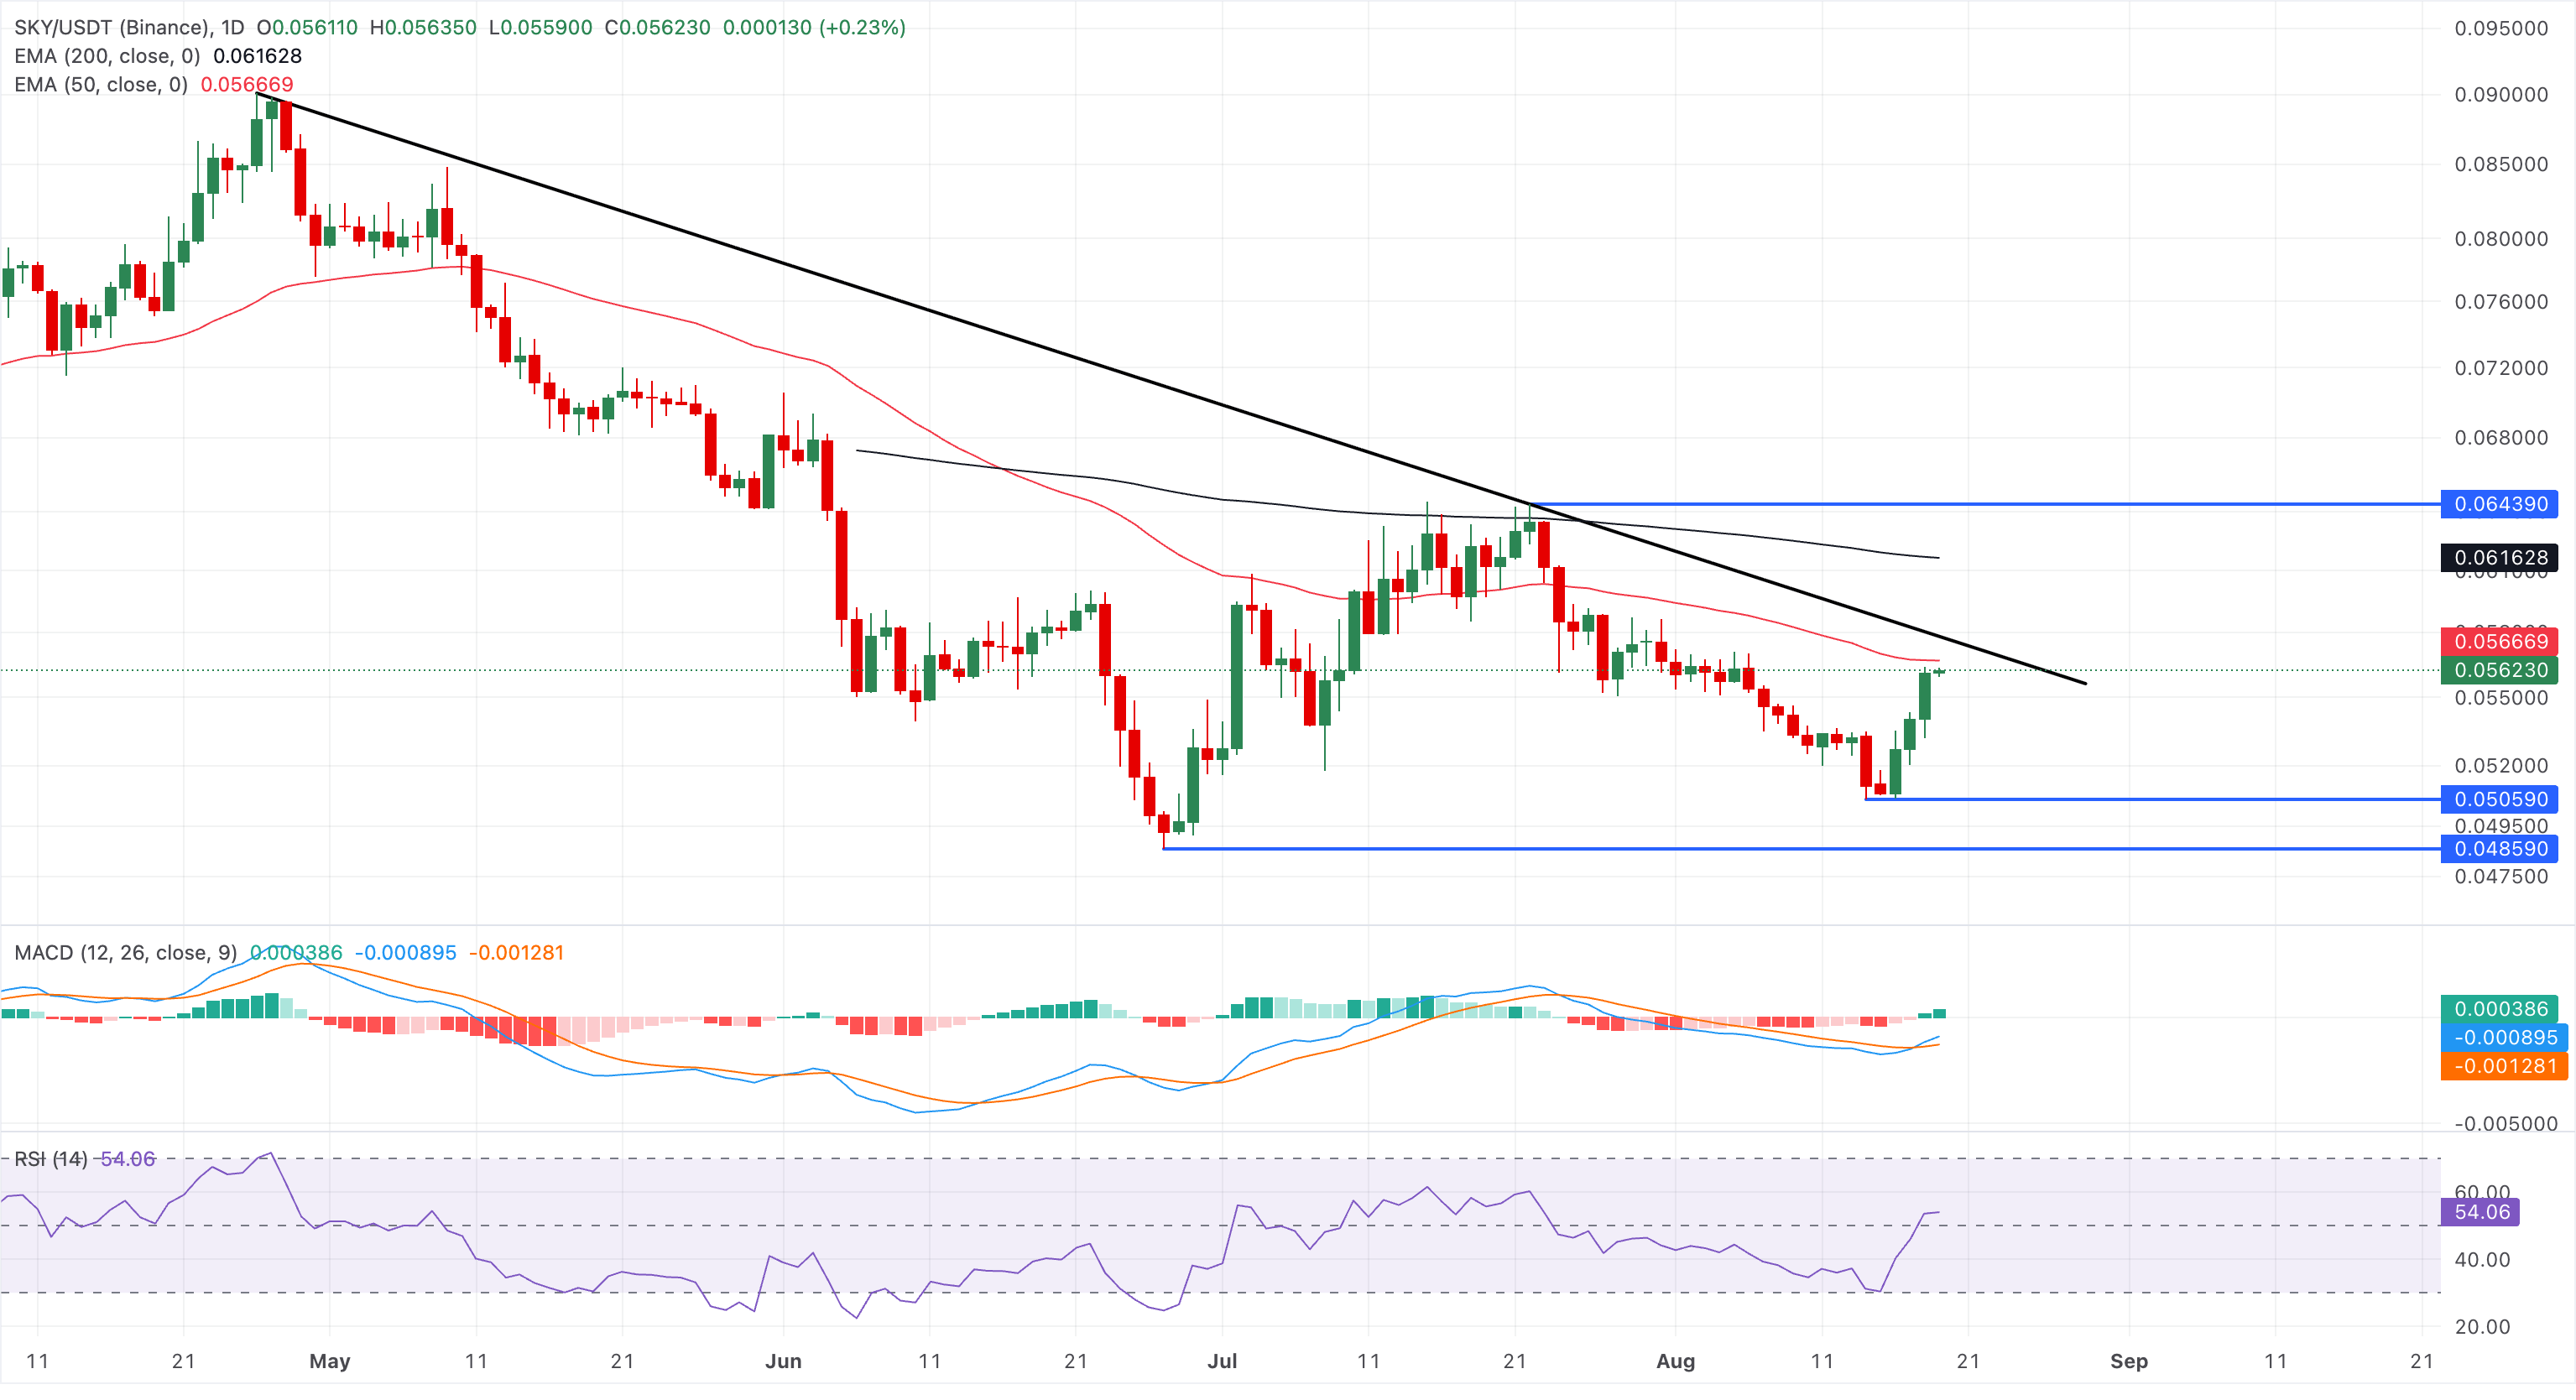
Looking down, a bearish reversal from the 50-day EMA could result in a retest of the August 14 low at $0.05059, followed by the June 27 low at $0.04859.
(The technical analysis of this story was written with the help of an AI tool. Know more.)
추천 기사


