


Bitcoin volatility falls below Nasdaq as market activity hits multi-year low
- Bitcoin’s 30-day volatility fell below the Nasdaq for the fifth time in its history, highlighting an unusually compressed market environment.
- Q2 Bitcoin ETF outflows set a new record, with retail investors accounting for most of the selling pressure as institutional exposure remained stable.
- Bitfinex analysts noted that sustained ETF inflows and expanding stablecoin supply are needed to trigger Bitcoin’s next major volatility expansion.
Bitcoin’s (BTC) 30-day volatility has fallen below that of the Nasdaq for only the fifth time on record, as subdued trading activity and declining volumes point to an unusually quiet period, according to a Tuesday report from K33.
Volatility shrinks even as retailers offload BTC ETF
BTC's 30-day volatility has dropped to 1.132%, marking its fourth-lowest reading of the 2020s. Seven-day volatility also dropped to 0.52%, its lowest level since 2023. Nasdaq’s 30-day volatility, by comparison, was higher at 1.5%.
The decline reflects an abnormality, as Bitcoin has historically experienced higher volatility than traditional risk assets. Previous periods when Bitcoin’s 30-day volatility fell below the Nasdaq occurred in October 2018, October 2022, January 2023 and April 2025.
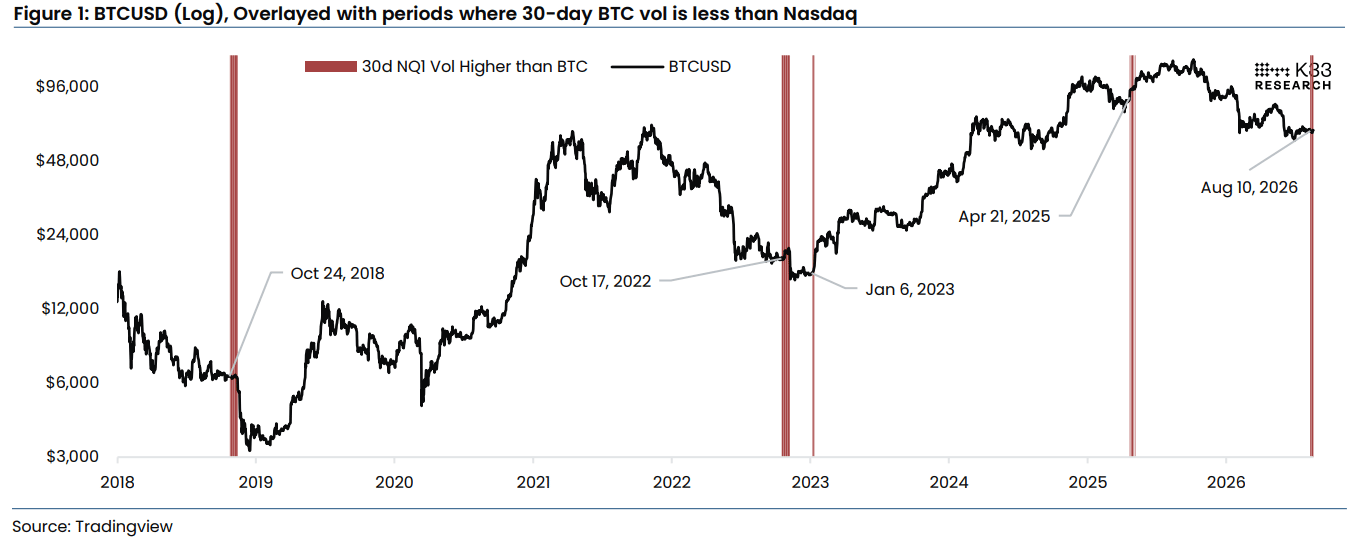
Three of those periods were followed by sharp price moves. The October 2018 episode preceded a 40% decline over two weeks, while a 23.5% drop followed the October 2022 period. On the other hand, Bitcoin gained 28.5% over two weeks following the January 2023 compression, while the April 2025 episode resulted in a 15.4% rise.
“Based on past price action, we can conclude that the current volatility compression reflects an abnormality, and we should brace for a larger move shortly,” K33 wrote.
The subdued conditions have extended to the spot market. Average daily Bitcoin spot volumes fell to $1.63 billion last week, the lowest level since October 2023. K33 noted that volumes had already reached multi-year lows the previous week before declining further.
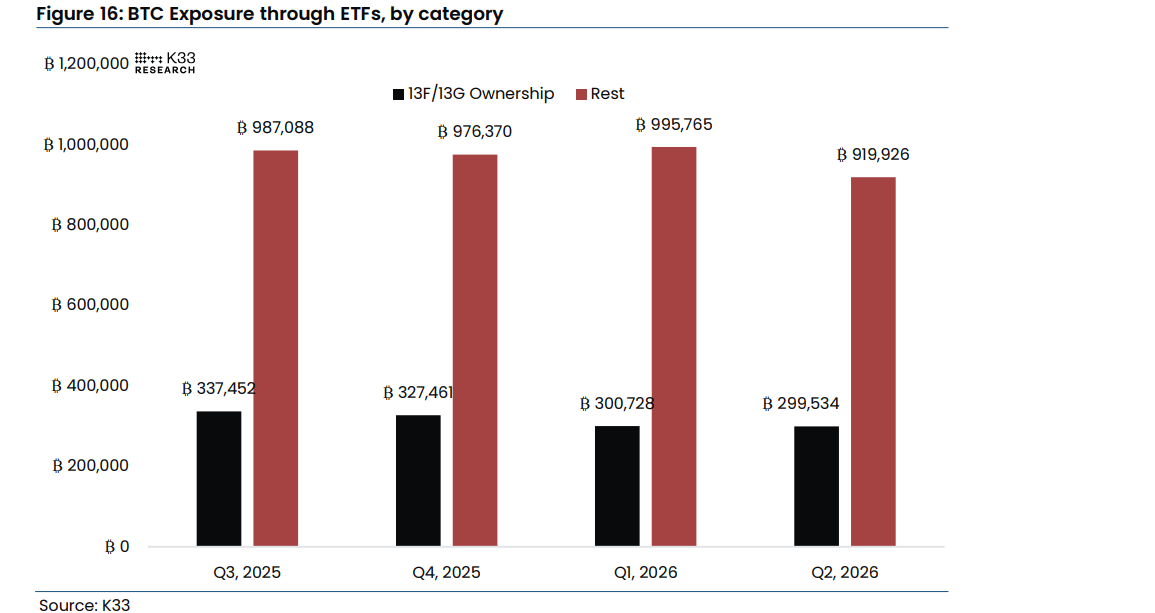
On the institutional side, the report found that retail investors accounted for most of the record Bitcoin exchange-traded fund (ETF) outflows in Q2.
Bitcoin ETFs recorded the largest quarterly net outflow in their history, although institutional exposure remained broadly unchanged from Q1. The data suggests the heavy selling in May and June came mainly from non-13F holders, predominantly retail investors.
Bitcoin ETF flows have remained subdued more recently. The products recorded $389.71 million in outflows last week, although Monday pulled in $297.56 million.
Subdued ETF activity is keeping a lid on fresh capital flowing into the crypto market, according to Bitfinex analysts. The analysts stated that Bitcoin’s next major move could depend on whether liquidity begins returning to digital assets.
“A return to sustained spot Bitcoin ETF inflows alongside expanding stablecoin supply would indicate that the transmission mechanism has reconnected and could provide the catalyst for Bitcoin to break from its prolonged volatility compression,” Bitfinex analysts wrote.
The analysts noted that a recovery in Bitcoin's price above $67,176 would restore profitability for recent buyers. Likewise, a break below the median level could expose BTC to a retest of the June lows and the broader bear-market low of $57,803.
They added that Bitcoin holding above its Median Realized Price, despite repeated tests, suggests that a volatility expansion could favor an upside move.
“With participation exceptionally low and BTC continuing to defend key realized-price support, the eventual return of liquidity could produce a sharp volatility expansion, with the current market structure favouring an upside resolution if demand begins to recover,” the analysts shared.
Bitcoin is trading at $64,600, up 0.6% over the past 24 hours at the time of writing.
추천 기사


