


Crypto Overview: Bitcoin holds at $63,000 – Cosmos, Pump.fun lead gains
- Bitcoin hovers above $63,000 on Friday, capped below the 50-day EMA at $64,486 as momentum shifts lower.
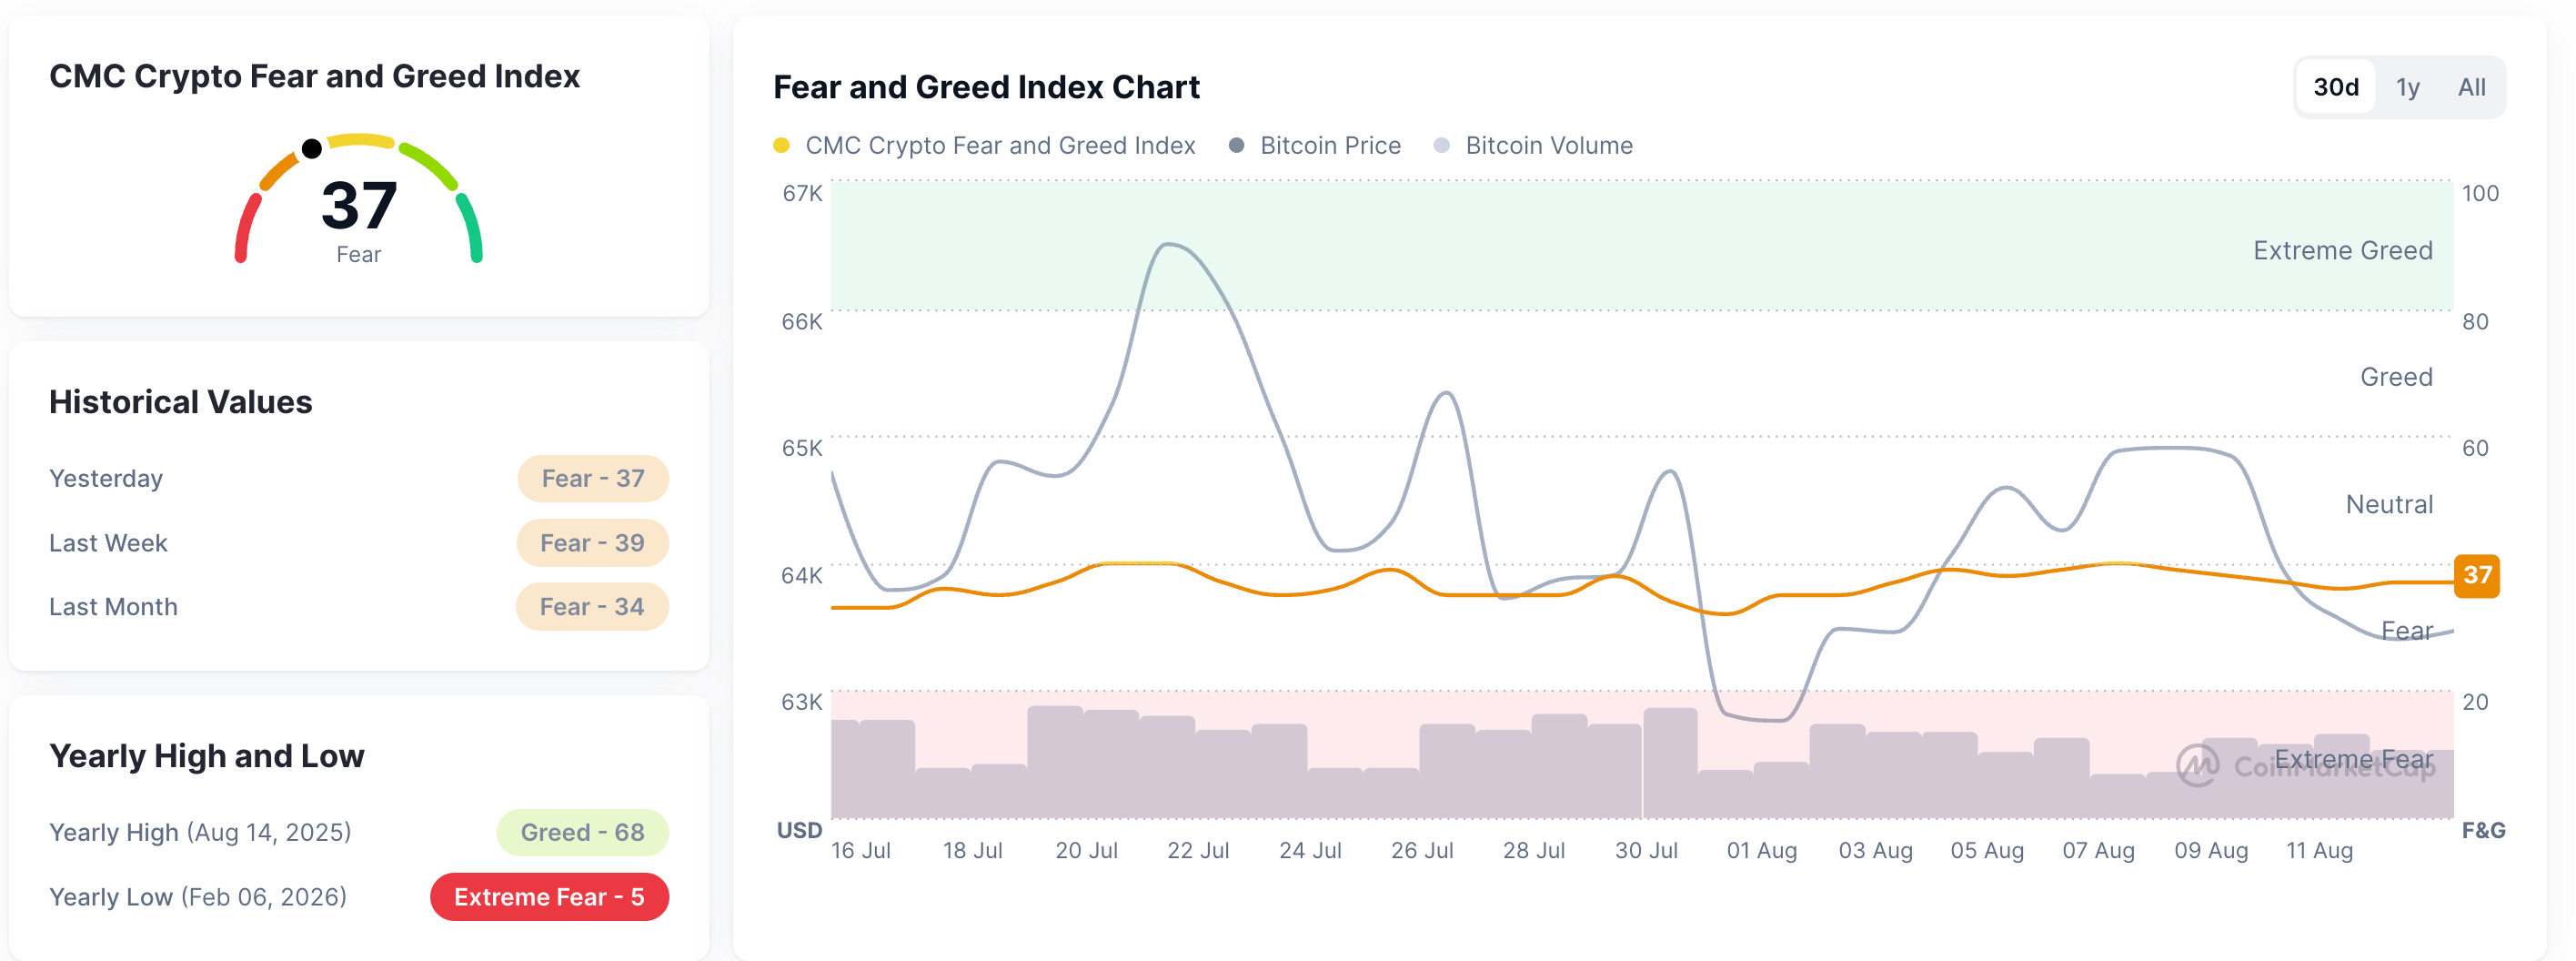
- Crypto Fear and Greed Index stabilizes around 37, suggesting persistent mildly risk-off sentiment.
- Cosmos and Pump.fun are leading gains over the last 24 hours, emerging as top performers.
Bitcoin (BTC) hovers around $63,000 at press time on Friday, as the broader crypto market maintains a risk-off sentiment. Rising against the tide, Cosmos (ATOM) and Pump.fun (PUMP) are leading gains over the last 24 hours, emerging as top performers.
CoinMarketCap’s Fear and Greed Index at 37 on Friday flattens below the neutral zone, indicating persistent mildly risk-averse conditions.
Technical outlook: Will Bitcoin extend its losses?
Bitcoin trades around $63,556 at press time on Friday, maintaining a bearish near-term tone, capped below the 50-day Exponential Moving Average (EMA) at $64,488 and well below the 200-day EMA at $72,432. From a technical perspective, price has breached an upward support trendline near $63,955, now acting as an overhead barrier.
Reinforcing the downside bias, while the Moving Average Convergence Divergence (MACD) is below its signal line, with a negative reading, and the Relative Strength Index (RSI) hovers near 46, hinting at a softer but not yet oversold momentum.
Initial resistance is seen at the former short-term uptrend break around $63,955, followed by the 50-day EMA at $64,488.
Looking down, the July 6 low at $61,307 emerges as the initial support, followed by the July 1 low at $57,800.
Technical outlook: Could ATOM and PUMP extend their rally?
Cosmos is up 3% on Friday, extending its 7% rise from the previous day. ATOM maintains a bullish near-term bias as the price holds above the 50-day EMA at $1.4857, following a bullish breakout above a long-term resistance trendline near $1.3500 last week.
The MACD rises in positive territory while the RSI hovers near 65, hinting at strong but increasingly stretched momentum.
The path of least resistance for ATOM targets the R2 Pivot level at $1.7703, indicating an upside of roughly 15%.
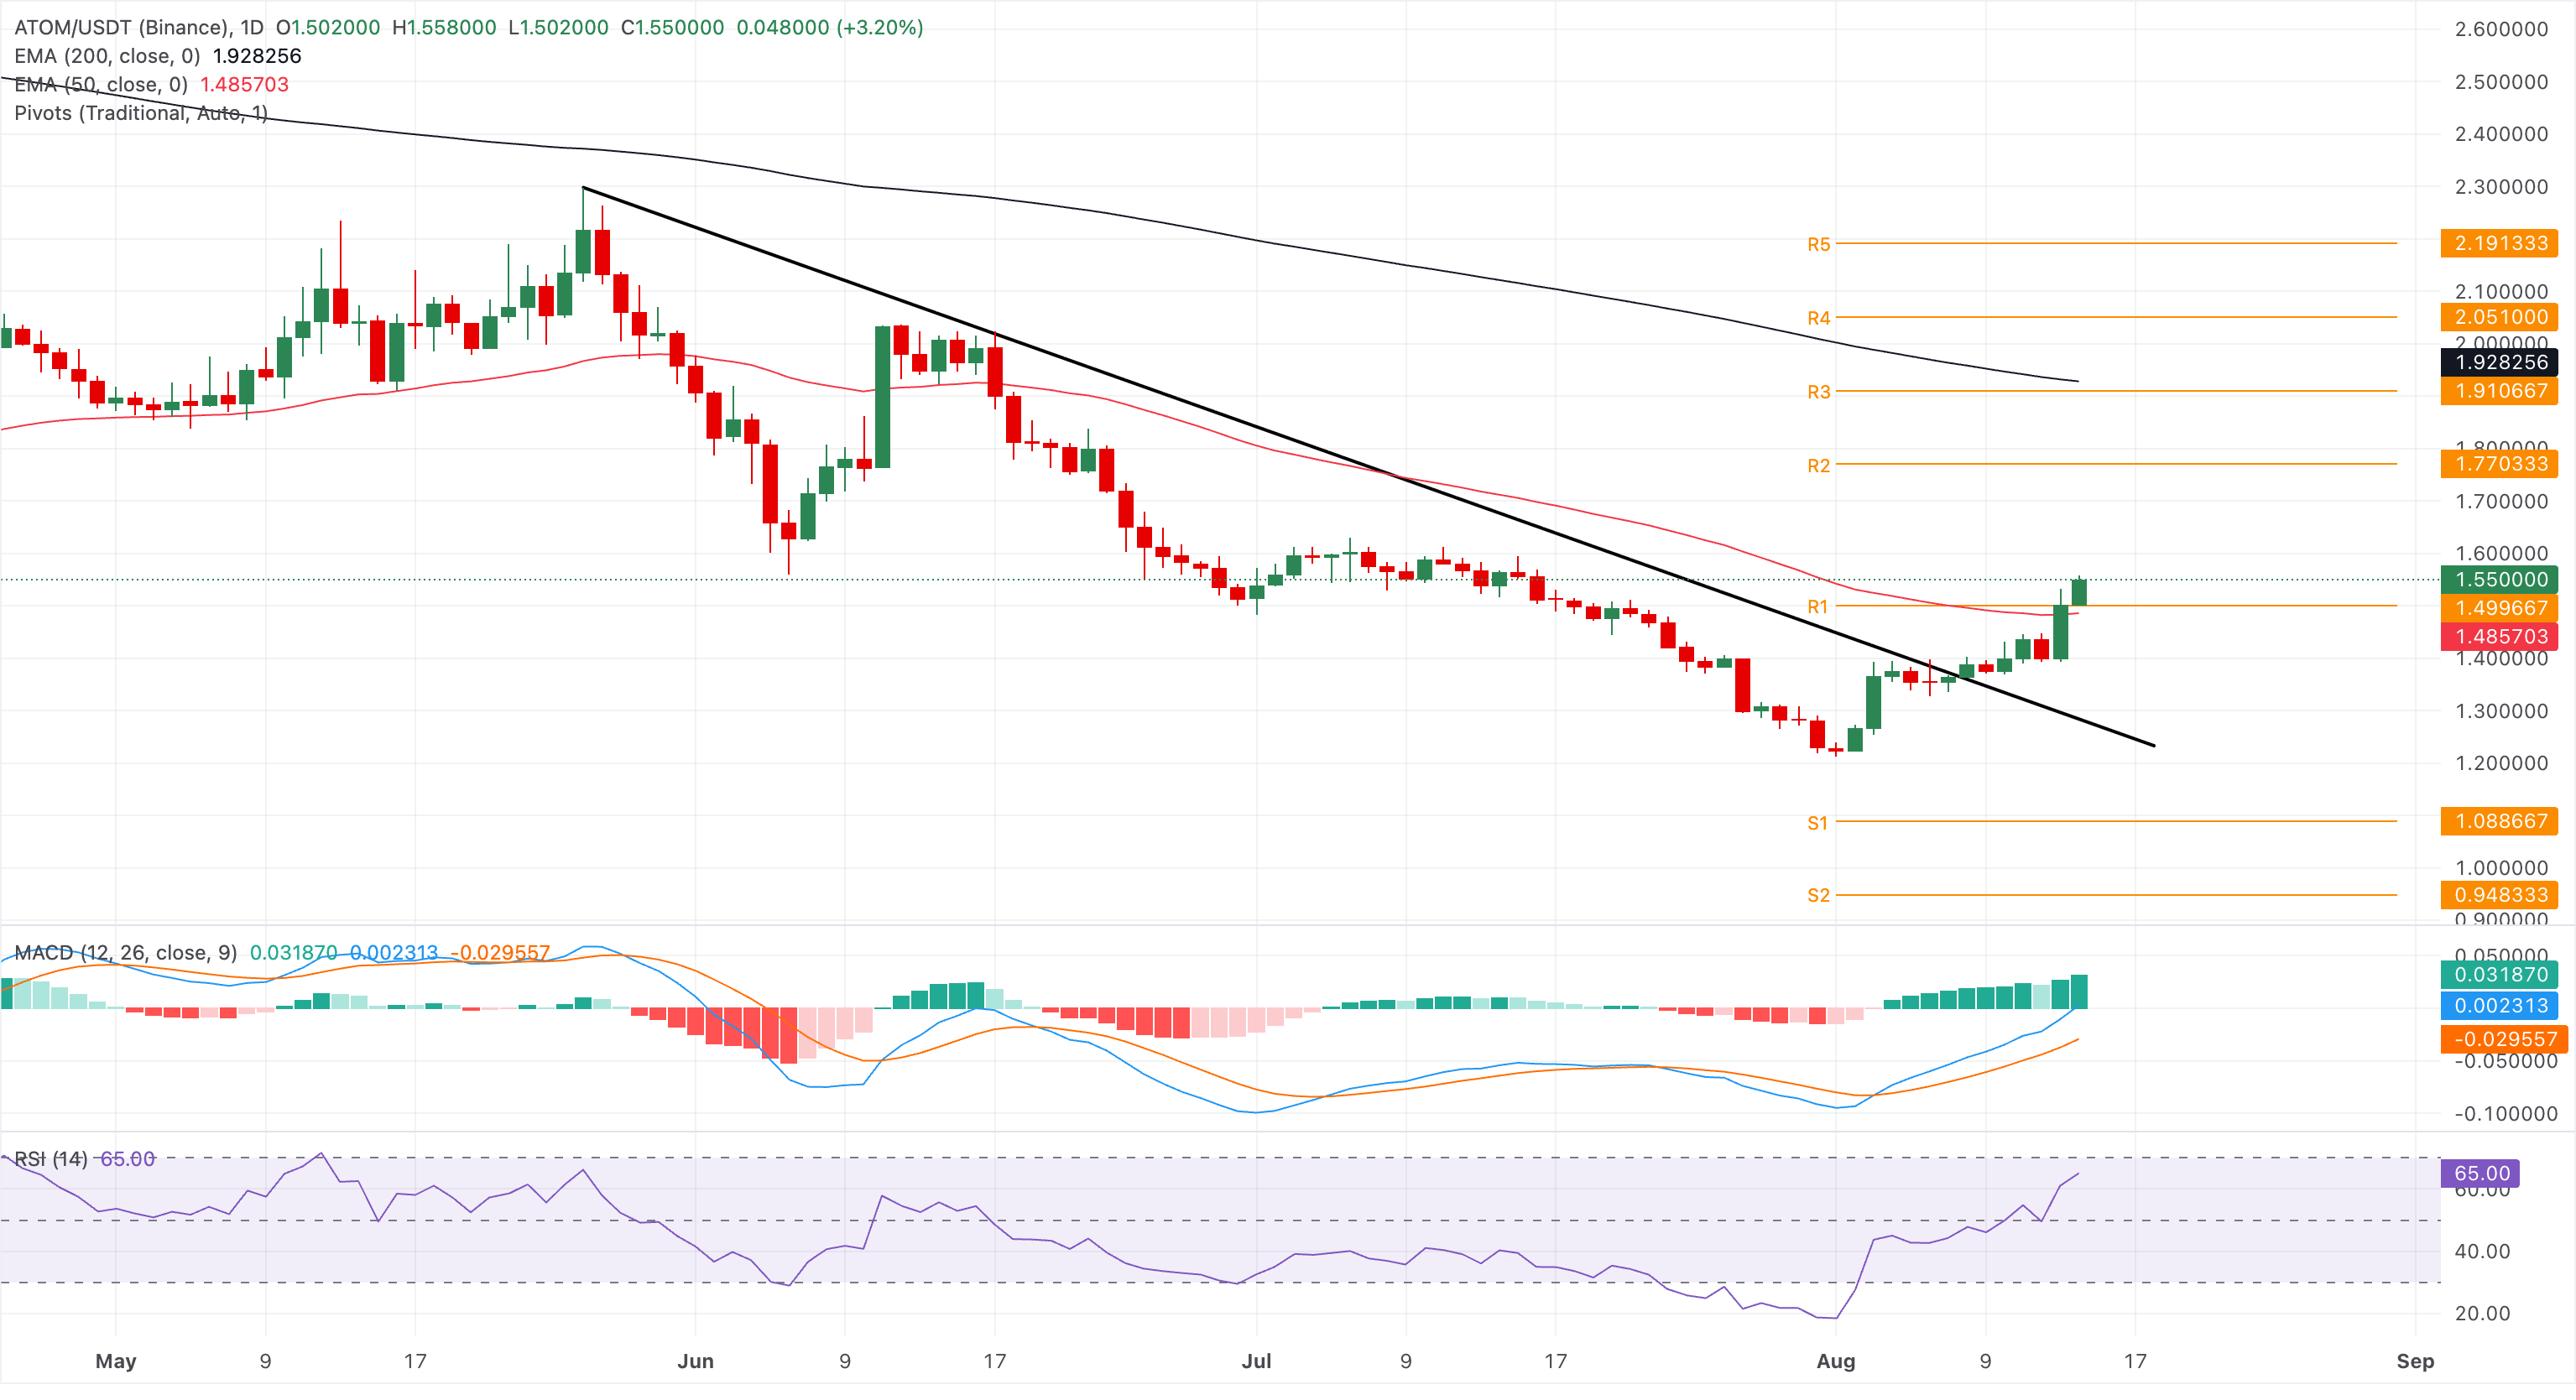
On the downside, the 50-day EMA at $1.4857 remains a crucial support level, guarding the downside of the broken trendline now at $1.2854.
PUMP is inching closer to $0.003000 on Friday, extending its advance above both the 50-day EMA at $0.002750 and the 200-day EMA at $0.002196, which together hint at a bullish near-term bias. A decisive close above the $0.0030 round figure could target the December 3 high at $0.003399.
The RSI at 76 stays in overbought territory, suggesting strong but potentially stretched upside momentum.
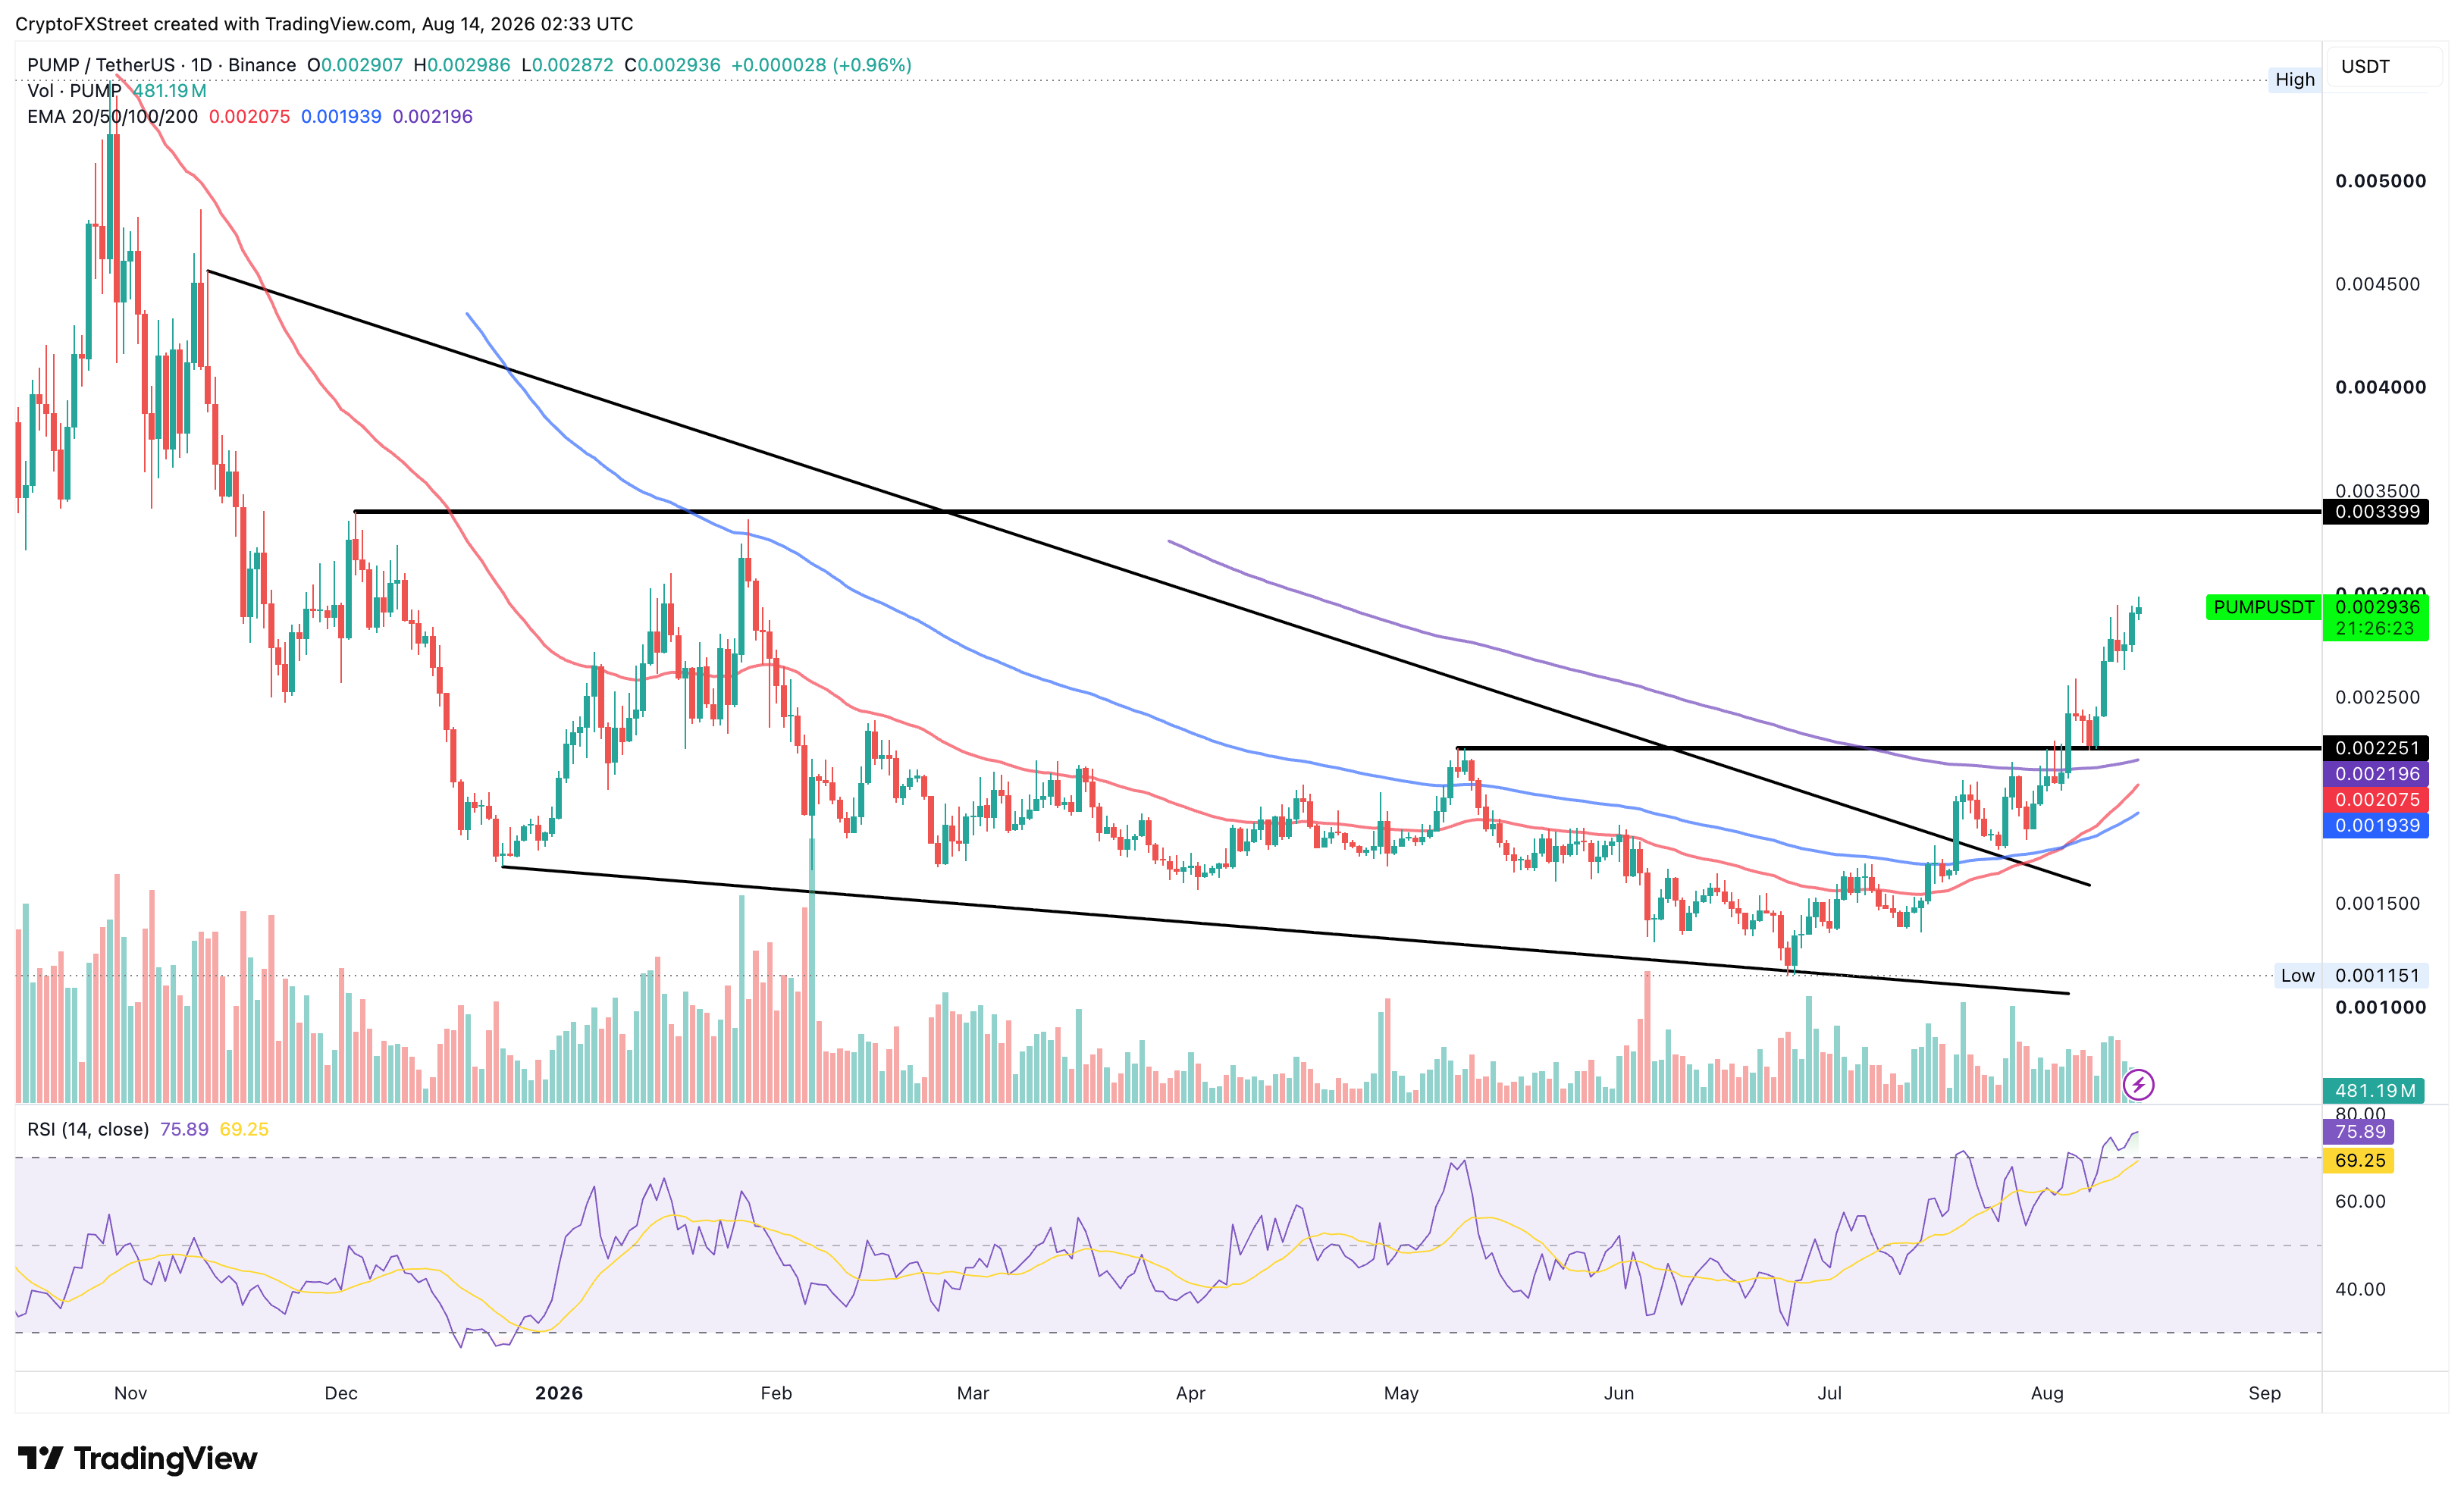
Looking down, the May 9 high at $0.002251 now acts as a support zone, reinforced by the 200-day EMA at $0.002196.
(The technical analysis of this story was written with the help of an AI tool. Know more.)
추천 기사


