


Bitcoin Price Forecast: Bulls regain ground as BTC reclaims $65,000
- Bitcoin trades near $65,000 on Monday after recovering over 2% from support around the 200-week SMA last week.
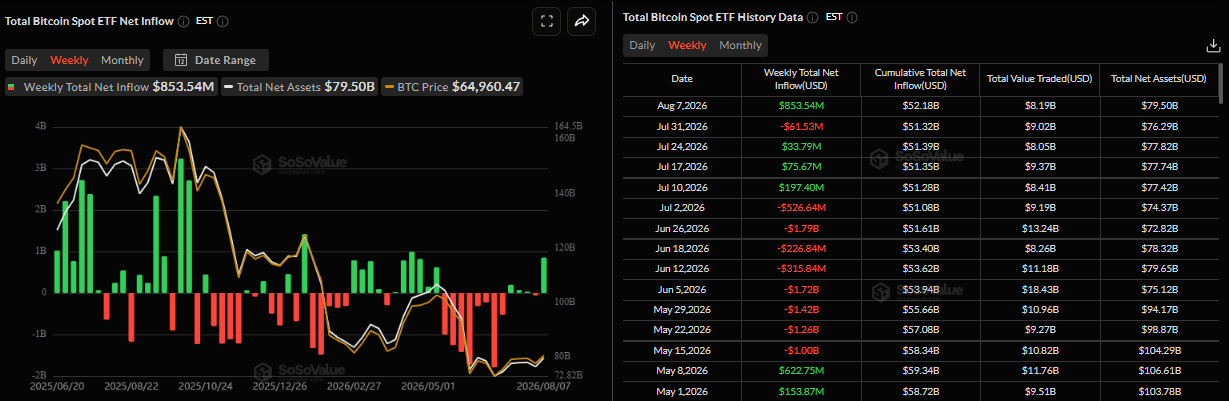
- US-listed BTC spot ETFs attracted over $850 million last week, marking the highest weekly inflow since mid-April.
- BTC’s BIP-110 soft fork failed to gain sufficient miner support after only two blocks were mined on Saturday, while ongoing Middle East uncertainty continues to cap risk appetite.
Bitcoin (BTC) holds above $65,000 at the time of writing on Monday, after recovering more than 2% last week, with bulls finding support around the 200-week Simple Moving Average (SMA). Strong spot Exchange Traded Funds (ETFs) inflows point to renewed institutional demand. At the same time, the stalled Bitcoin Improvement Proposal (BIP) 110 soft fork and ongoing Middle East uncertainty could shape Crypto King’s outlook.
Middle East tensions keep BTC bulls cautious
Broader market tone remains cautious amid persistent geopolitical tensions, with the ongoing US-Iran conflict entering a critical diplomatic phase. The continued military engagements and heightened tensions around the Strait of Hormuz continue to weigh on risky assets, such as Bitcoin.
In addition, fresh attacks by Iran-backed Houthi militants on Saudi energy infrastructure on Sunday act as a tailwind for crude Oil prices. This continues to fuel inflation fears and bets for at least one interest rate hike by the US Federal Reserve (Fed) in 2026, which continues to cap BTC upside.
Bitcoin’s BIP-110 soft fork failed after mining only two blocks
BIP-110 soft fork failed to gain miner support after the minority chain mined only two blocks at height 961,632, securing just 2.53% miner support against the required 55% threshold.
This Bitcoin Improvement Proposal proposed restricting non-financial data, including images, text and Ordinals-style inscriptions, from being added to the Bitcoin blockchain for one year.
Supporters, led by Bitcoin Knots creator Luke Dashjr, argued that such transactions can congest the network and increase fees. At the same time, opponents viewed the proposal as an attempt to censor legitimate Bitcoin transactions.
Michael Saylor posted on X on Sunday, “Bitcoin worked exactly as designed. BIP-110 was free to fork, and the network was free not to follow. The result was decisive: about 99.85% of Bitcoin's hashpower stayed with Bitcoin. The BIP-110 branch mined only two blocks and is already more than 80 blocks behind.”
The failed activation highlights the difficulty of implementing controversial changes to Bitcoin’s consensus rules without broad support from miners and the wider community.
Institutional demand shows signs of strength
Institutional demand shows signs of strength. SoSoValue data show that spot BTC ETFs attracted $853.54 million last week, the highest weekly inflow since mid-April. If these inflows continue and intensify, BTC could see further gains this week.
Bitcoin technical outlook: BTC holds key support
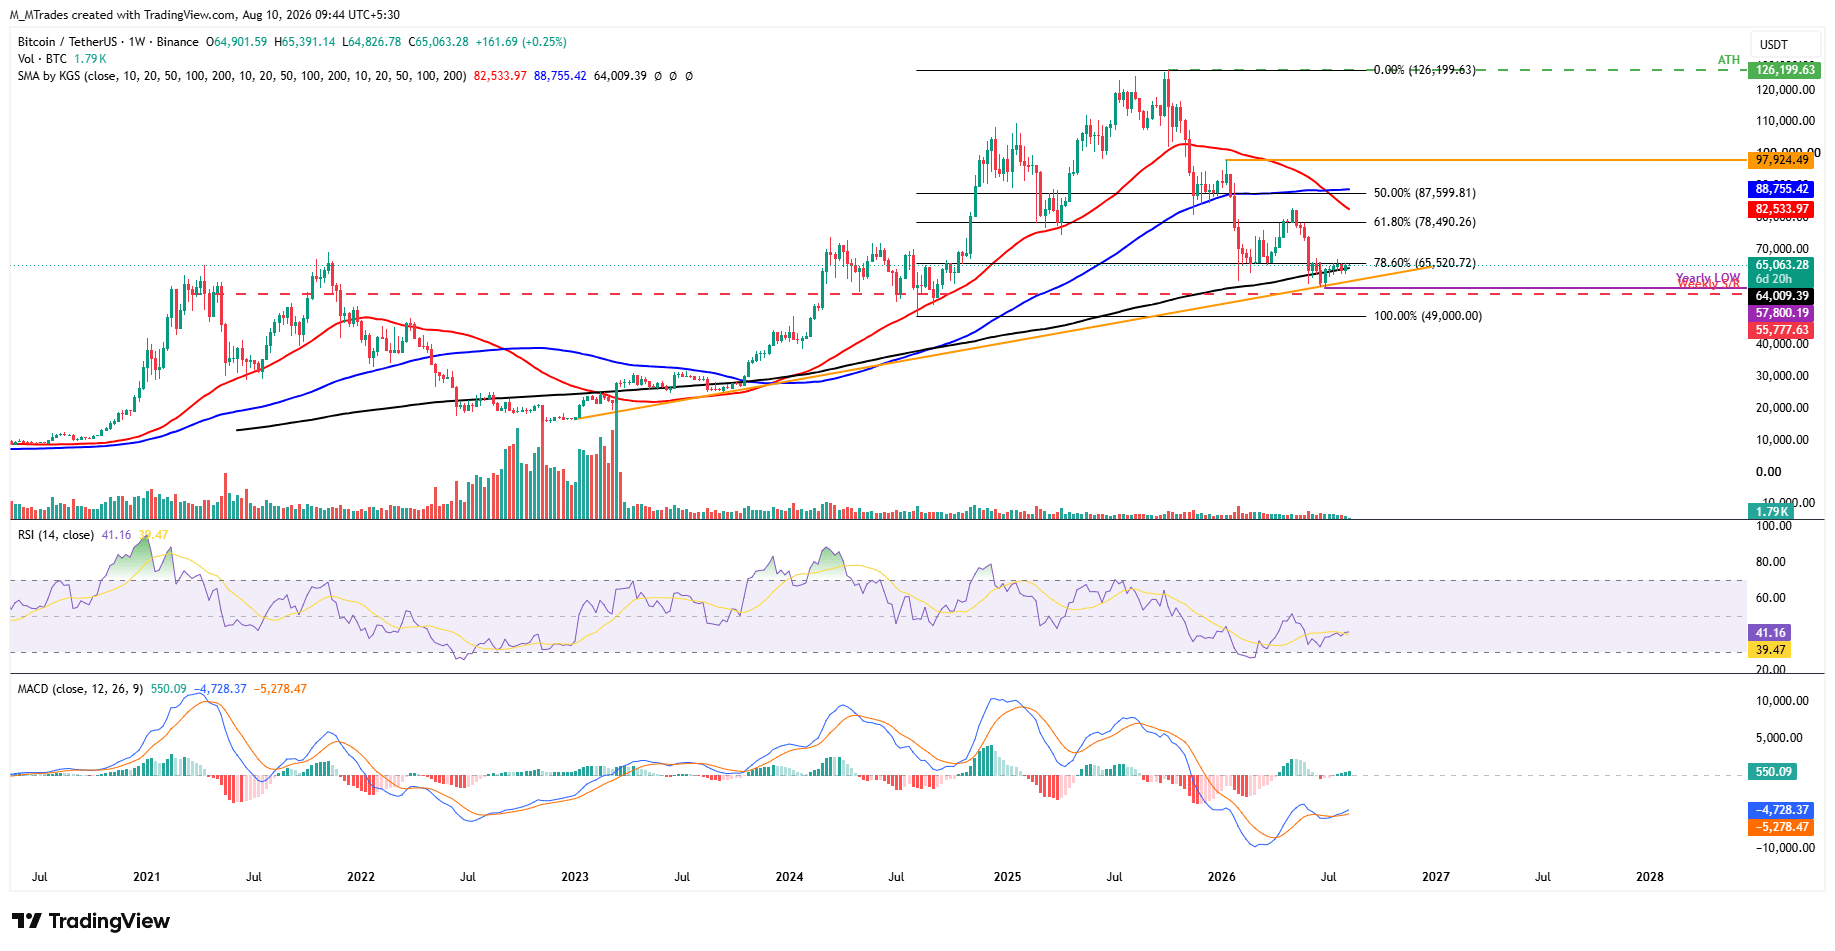
Bitcoin price trades on a positive note, extending slight gains on Monday above $65,000 after a mild recovery of 2.09% and finding support around the 200-week Simple Moving Average (SMA) at $64,009 last week.
If the Crypto King continues to hold above the 200-week SMA at $64,009 and closes above the immediate resistance at the 78.6% Fibonacci retracement level at $65,520 (drawn from the August 2024 low of $49,000 to the October 2025 record high at $126,199), then BTC could extend the recovery toward the 61.8% Fibonacci retracement level at $78,490.
Momentum indicators on the weekly chart show mild signs of easing bearish sentiment. The Relative Strength Index (RSI) is trending higher toward the neutral 50 level, with a reading of 41 on Monday. Meanwhile, the Moving Average Convergence Divergence (MACD) flipped to a bullish crossover in mid-July and remains intact, with rising green histogram bars, supporting a positive outlook.
However, if BTC fails to find support around the 200-week SMA at $64,009 and closes below it on a weekly basis, it could extend the losses toward the ascending trendline (drawn by connecting multiple lows since January 2023) around $60,000.
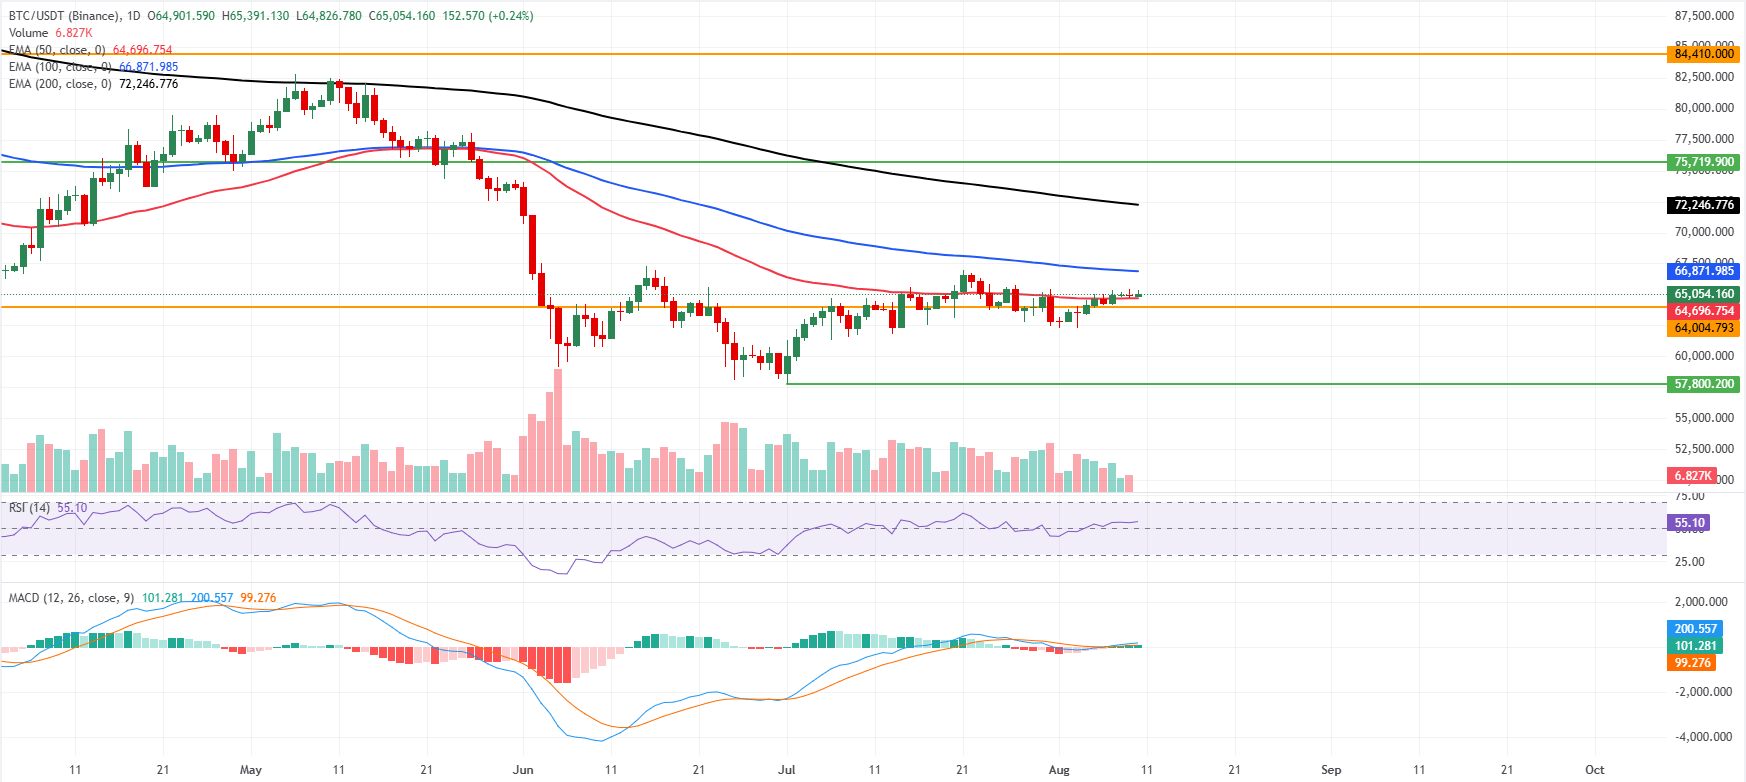
On the daily chart, the Crypto King is holding above the 50-day Exponential Moving Average (EMA) at $64,696 but is still capped by the 100-day EMA at $66,871 and the distant 200-day EMA at $72,246. This configuration suggests a neutral to mildly constructive near-term tone, with price supported by the short-term trend while the broader structure remains below key medium- and long-term averages.
The RSI on the daily chart at around 55 reinforces a balanced bias with a slight bullish tilt. At the same time, the MACD histogram stays in positive territory, hinting that buying pressure is gradually rebuilding rather than surging.
On the topside, initial resistance emerges at the 100-day EMA near $66,871, followed by the 200-day EMA at $72,246, before a major horizontal barrier looms far higher at $75,719.
On the downside, immediate support is at the 50-day EMA around $64,696, with a more significant structural floor at $64,004. A daily close below this latter area would weaken the current tentative bullish bias and expose a deeper corrective phase.
(The technical analysis of this story was written with the help of an AI tool. Know more.)
추천 기사


