


Crypto Market Overview: Bitcoin tests 50-day EMA support – Pi Network and Sky lead losses
- Bitcoin stalls near $65,000 on Friday, testing its 50-day EMA support at $65,135.
- Crypto market risk-off sentiment holds firm as the US-Iran war intensifies.
- Pi Network and Sky emerge as the worst performers over the last 24 hours.
The broader cryptocurrency market faces headwinds with rising tensions between the US and Iran, pushing Bitcoin (BTC) down to its 50-day Exponential Moving Average (EMA) support around $65,135 on Friday. Under pressure, Pi Network (PI) and Sky (SKY) emerge as the worst-performing crypto assets over the last 24 hours.
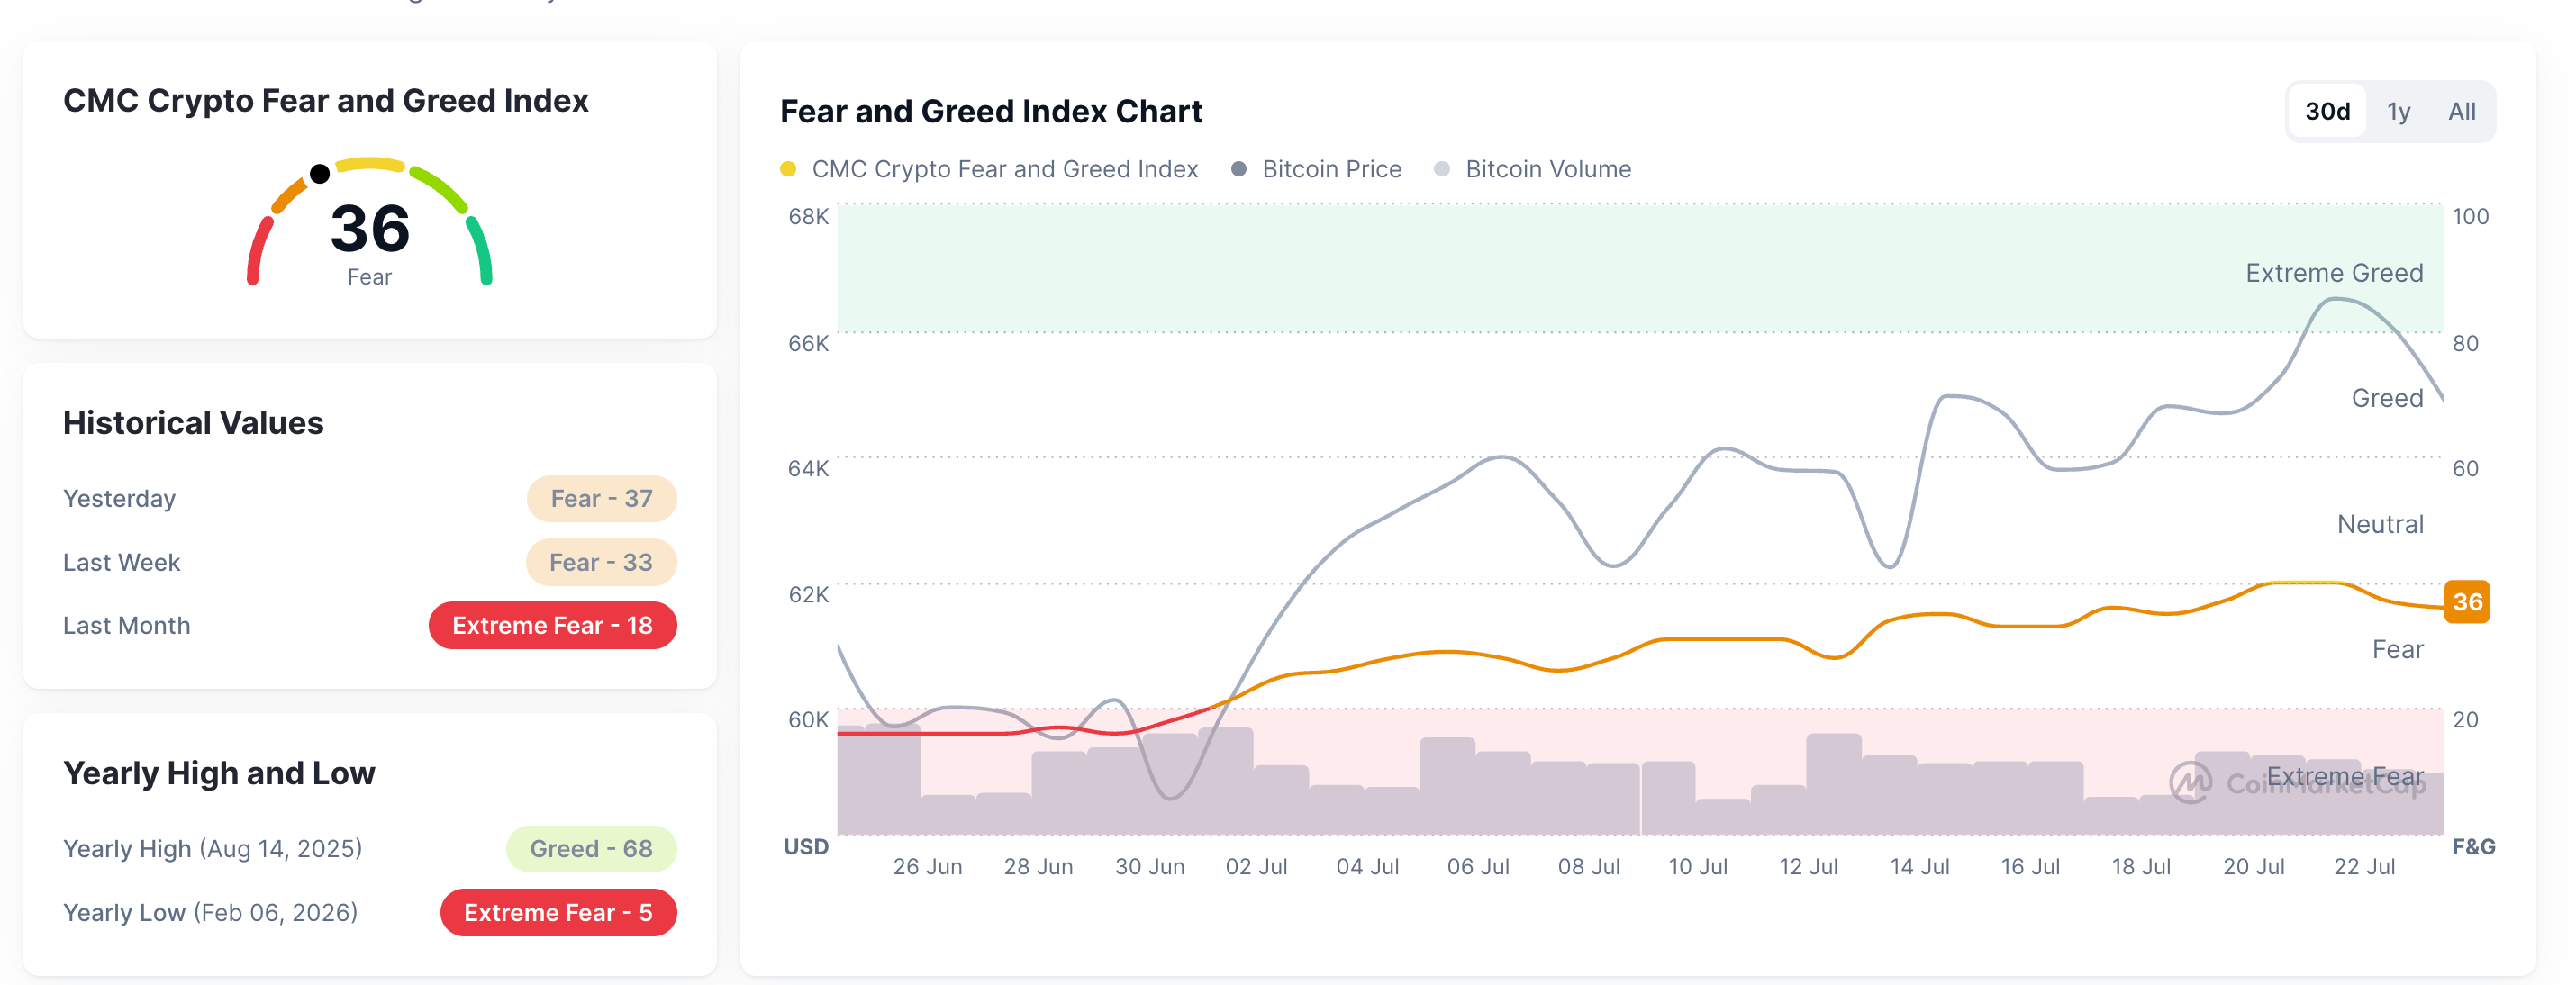
CoinMarketCap's Fear and Greed Index is at 36 on Friday, down from 40 on Wednesday, indicating renewed risk-off sentiment, likely linked to US President Donald Trump warning of “major military punishment" for Iran after the Houthi attacks in the Red Sea.
Bitcoin risks losing near-term recovery
Bitcoin keeps a bearish near‑term bias, testing its 50‑day EMA at $65,135 and sits well below the 200‑day EMA at $73,997. From a technical perspective, Bitcoin maintains an overall capped structure below the $67,516 horizontal level.
The Relative Strength Index (RSI) is hovering in neutral‑positive territory around 54, and the Moving Average Convergence Divergence (MACD) and signal lines hold firm in the positive territory, albeit with contracting momentum.
On the downside, immediate support is at the 50‑day EMA around $65,135, guarding the downside toward the $60,000 mark.
Looking up, BTC must clear the $67,516 horizontal level for a more substantial recovery, potentially targeting the 200‑day EMA near $73,997.
Pi Network and Sky remain vulnerable to deeper losses
Pi Network edges lower on Friday, extending its losses for the third consecutive day. The 127.2% Fibonacci extension level, measured from $0.1998 to $0.1183, at $0.0961, capped the minor recovery from last week.
From a technical perspective, PI maintains a broadly bearish bias, with its decline extending within a falling channel pattern on the daily chart. The key support for PI emerges at the 161.8% Fibonacci extension level at $0.0679.
The contracting MACD histogram and average lines hint at an easing recovery attempt, while the RSI near 33 keeps downside pressure in play rather than indicating a mild reversal.
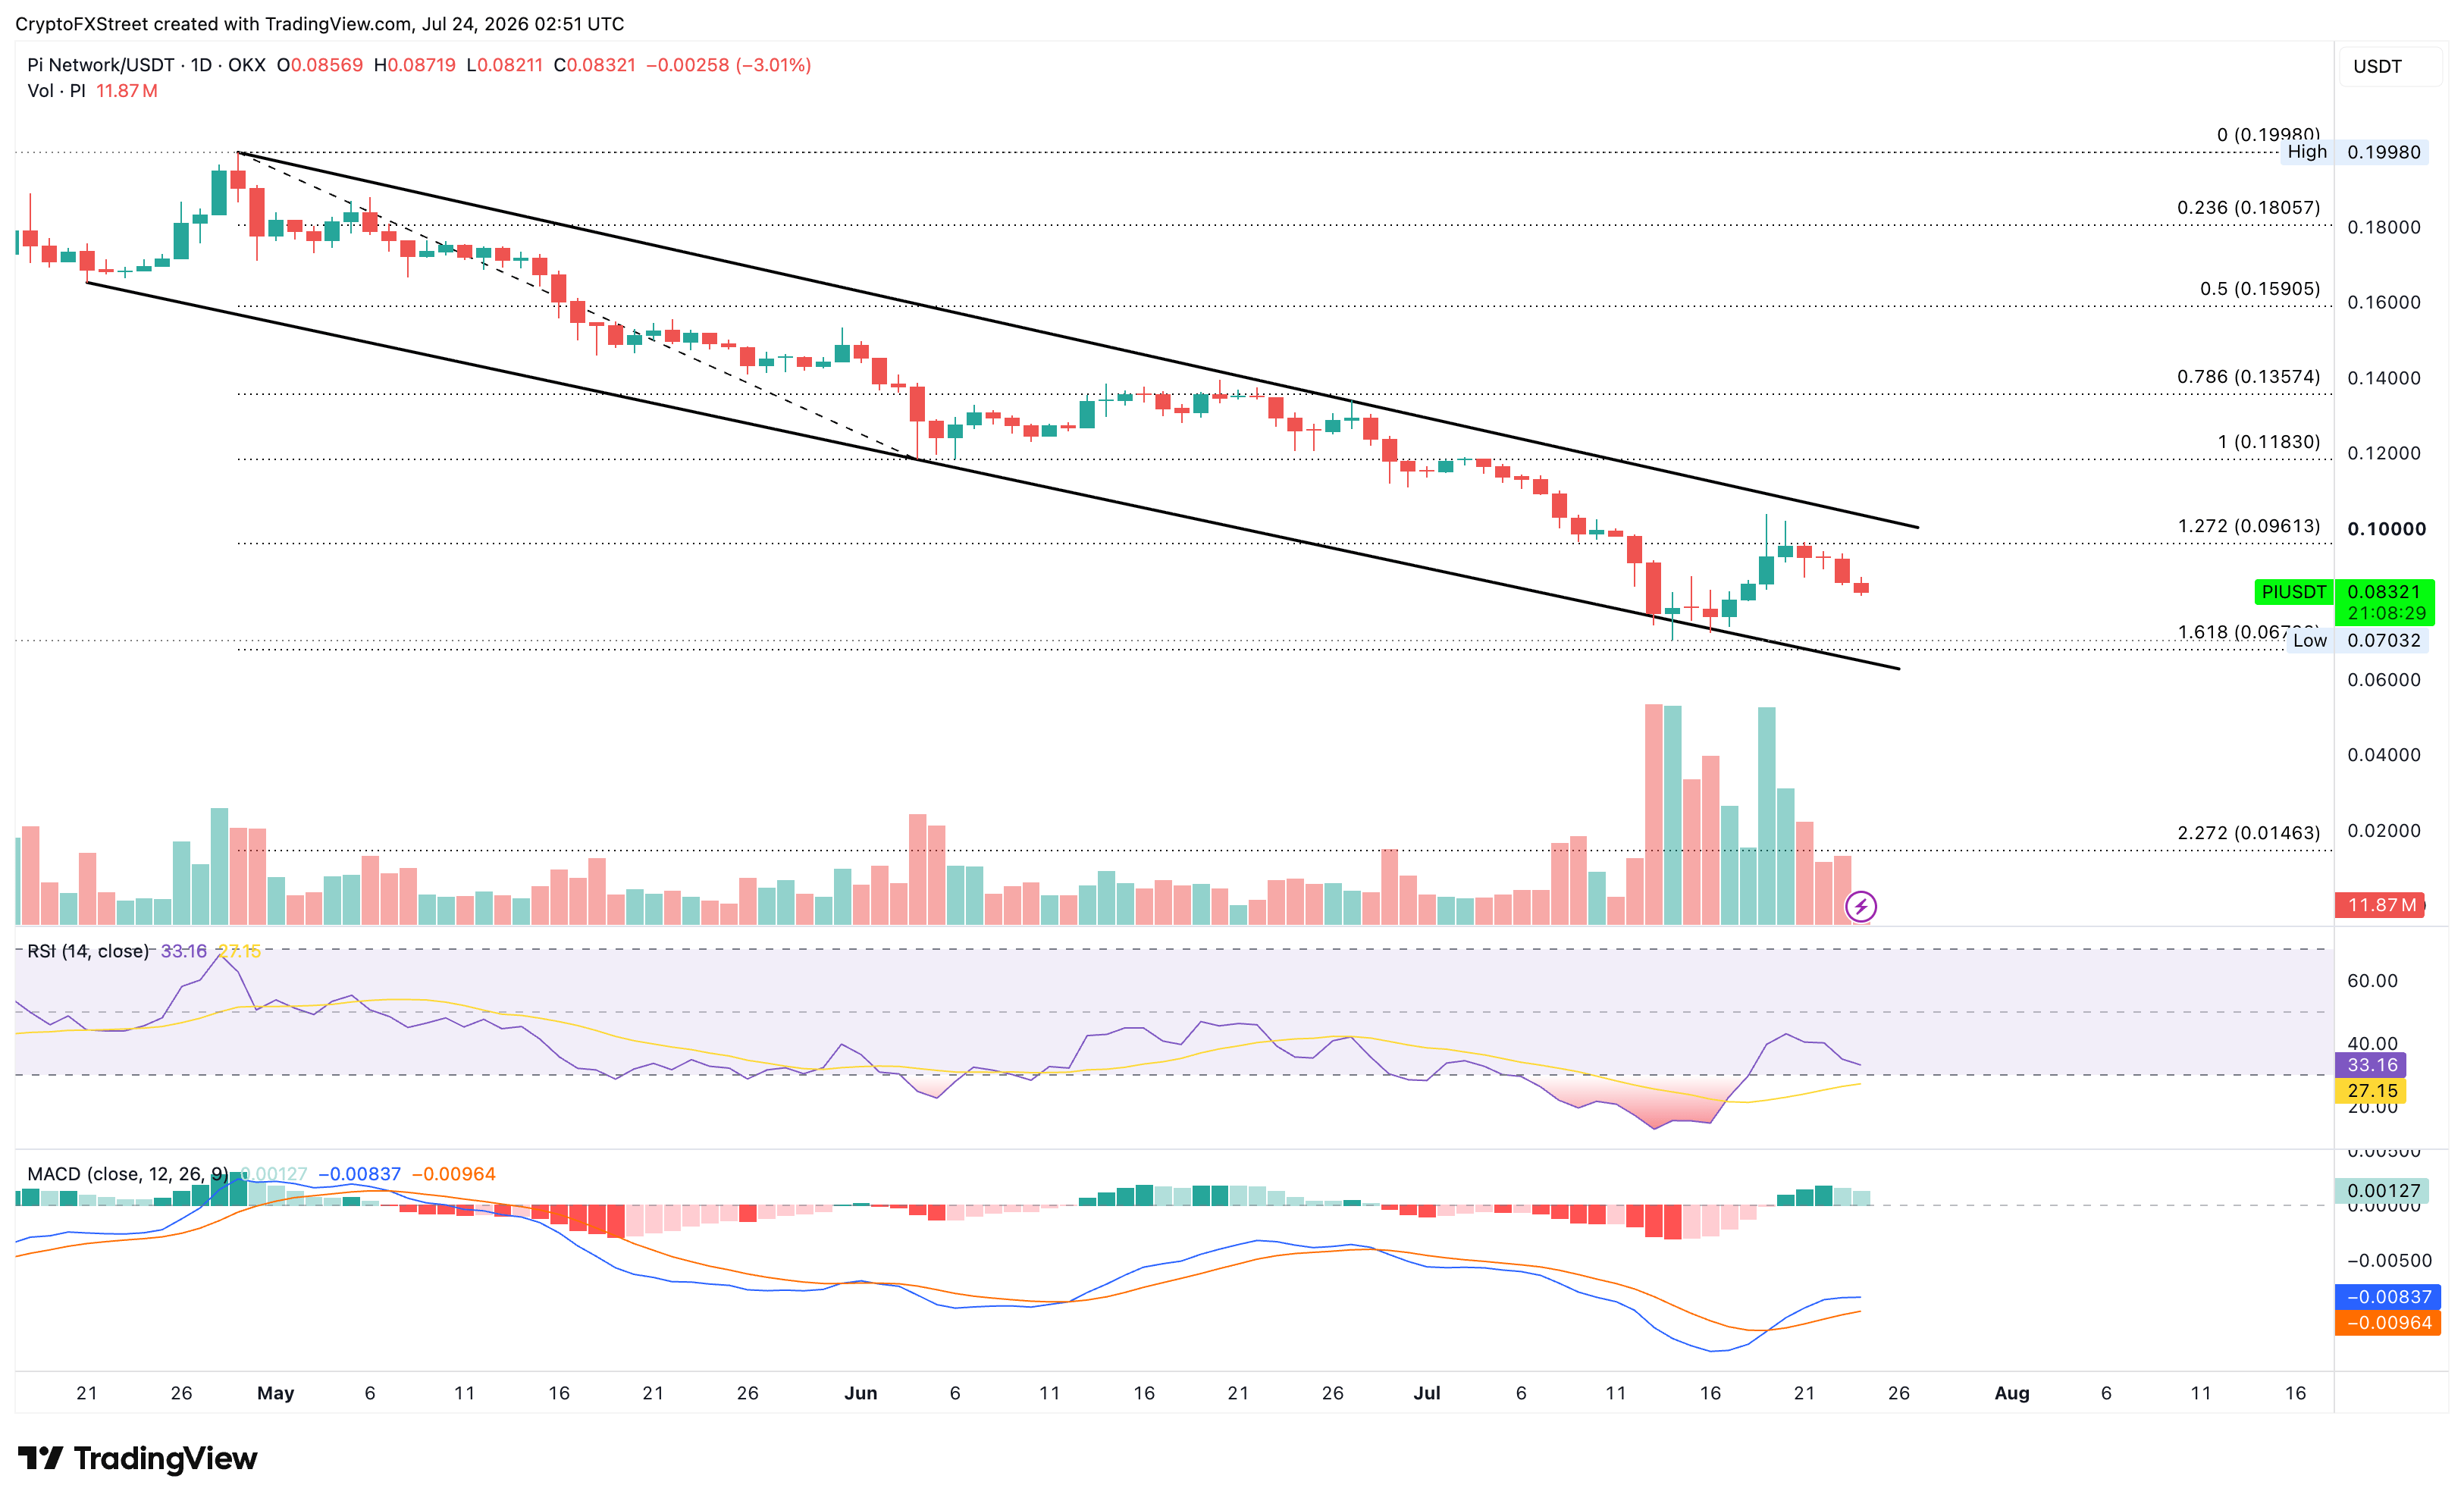
PI token must reclaim the $0.09613 level for a sustained recovery to test the overhead resistance trendline near $0.1030.
Sky maintains a bearish near-term bias as price remains below the 50-day EMA at $0.0602 and the 200-day EMA at $0.0636. The pair has retreated from recent highs and is now testing the 78.6% Fibonacci retracement of the previous downswing from $0.0900 to $0.0485, at $0.0574.
Momentum conditions are soft, with the RSI hovering around 45 and the MACD slipping just below its signal line, together hinting at waning bullish momentum.
A decisive close below $0.0574 could extend the decline toward the Fibonacci anchor at $0.0485.
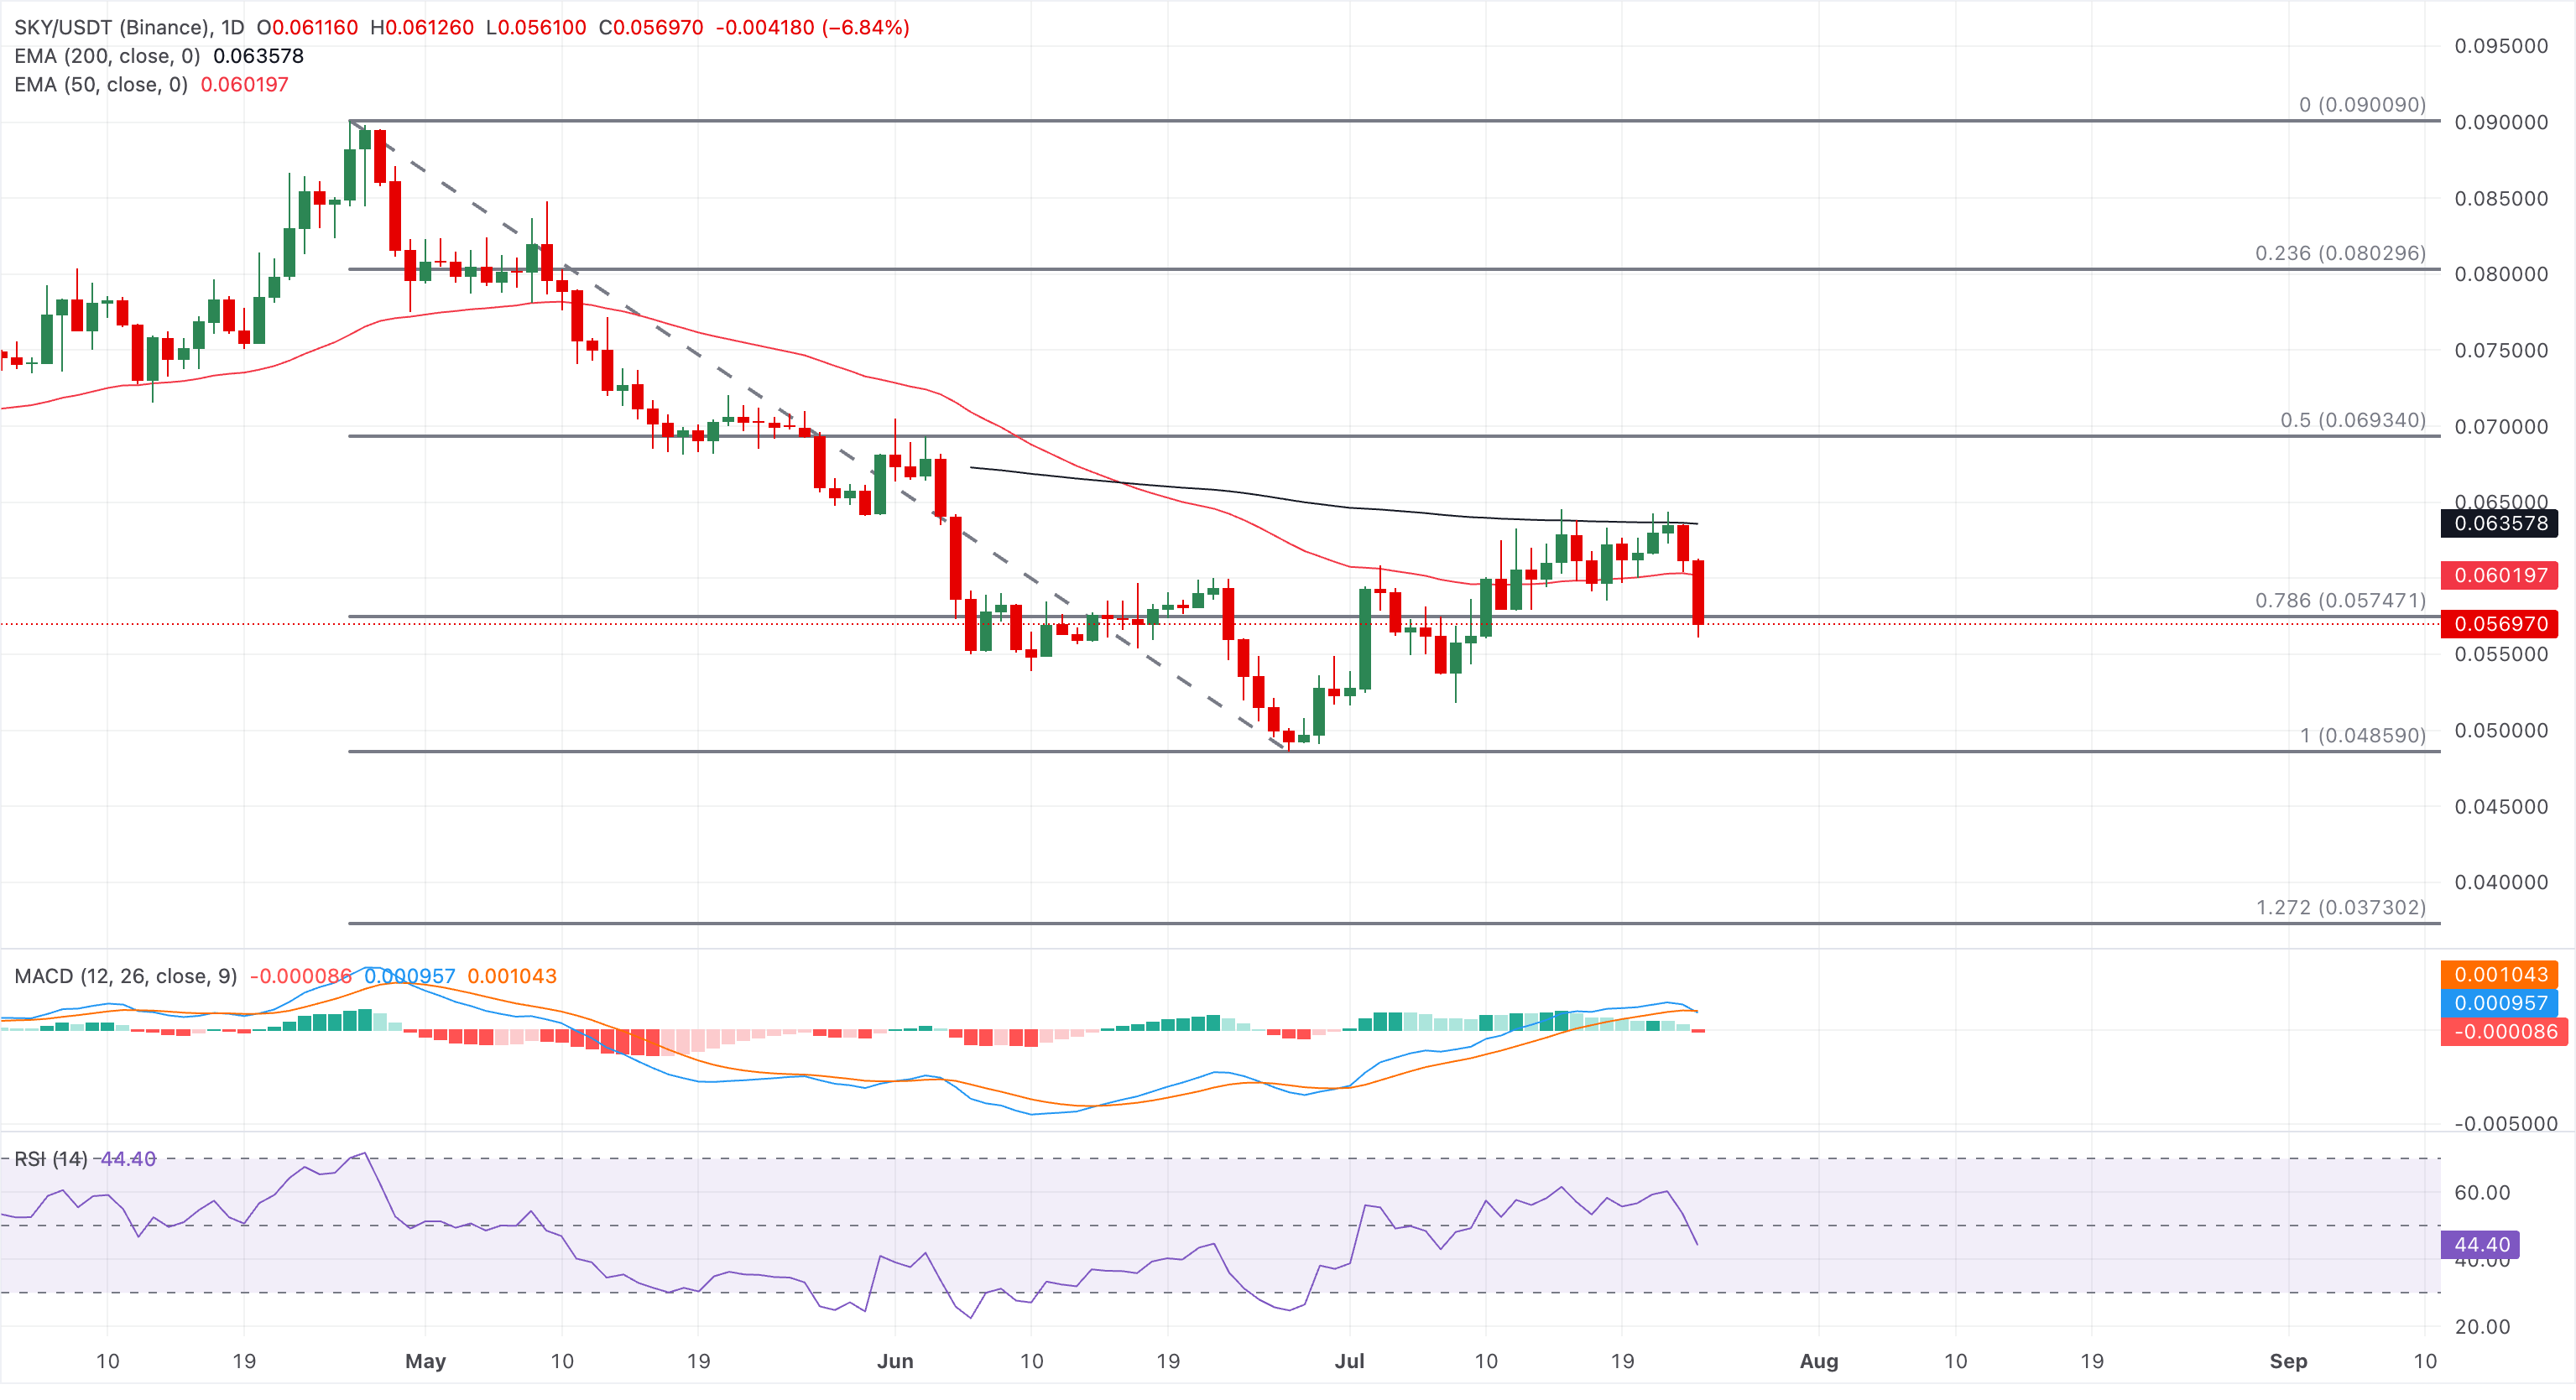
On the topside, initial resistance is seen at the 50-day EMA at $0.0602 and the 200-day EMA at $0.0636, forming a layered cap.
(The technical analysis of this story was written with the help of an AI tool. Know more.)
추천 기사


