


Cardano Price Forecast: ADA downtrend deepens despite on-chain bottoming signals
- Cardano is down roughly 3% so far on Wednesday, risking a fresh low below $0.1500, levels not seen since December 2020.
- Retail interest shifts bearish as ADA Open Interest drops to November 2024 levels.
- On-chain data shows a potential exhaustion of selling pressure from dormant long-term holding wallets, keeping hopes of a bottom formation alive.
Cardano (ADA) edges lower to $0.1600 at press time on Wednesday, signaling a potential extension of the 30% loss from last week. The altcoin remains under intense selling pressure, weighing on its retail support. Still, a spike in dormant supply re-entering circulation signals that the selling pressure has run its course, a pattern that often precedes a rebound.
Dormant supply spent signals potential bottom
Spikes in spent dormant supply often signal long-term investors finally dumping their coins under pressure. In the case of Cardano, Santiment data shows multiple spikes in dormant supply spent in early June, crossing the 20 billion ADA mark, followed by the largest spike on June 9, at 40.6 billion ADA. This sudden supply dump of long-held ADA tokens forced a pause in the average age of ADA wallets, reaffirming the exit of multiple dormant wallets.
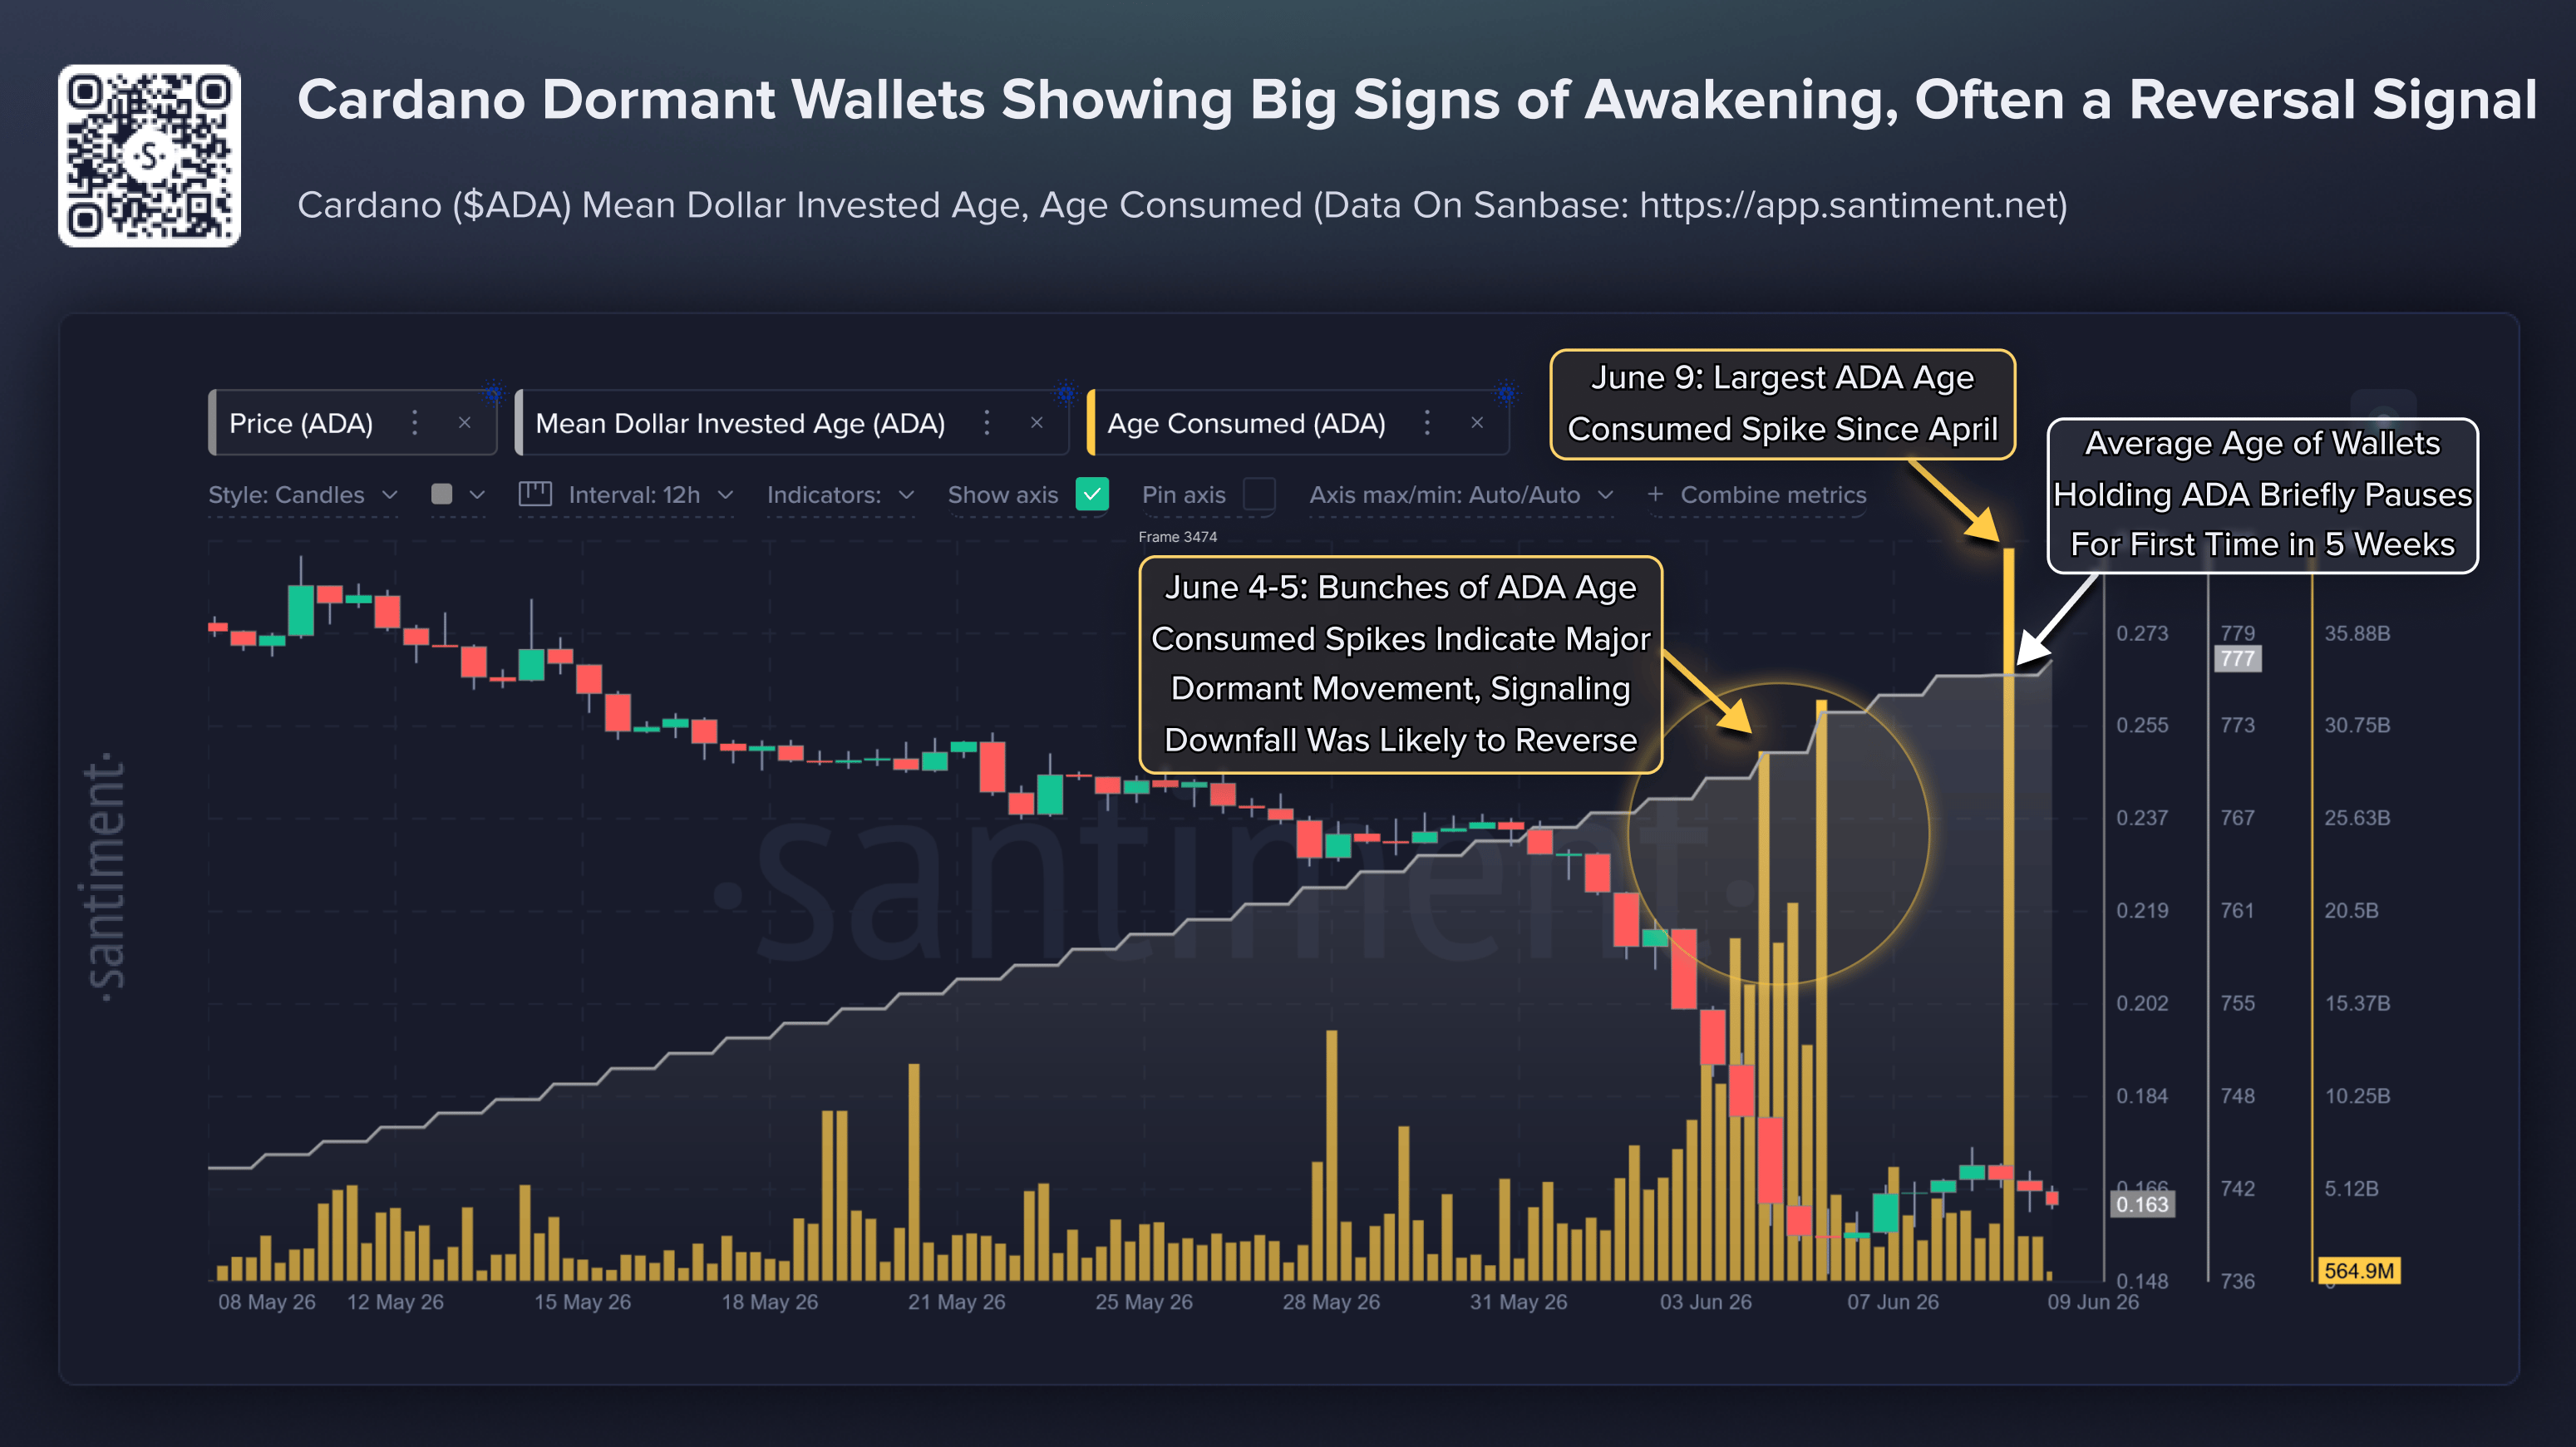
Although the investors could continue to dump their dormant supply, such spikes are considered an exhaustion signal of selling pressure, preceding a potential turning point.
Weakness in Cardano’s retail demand
Cardano is losing demand among retail investors following the 30% drop last week, which aligned with its founder, Charles Hoskinson’s misleading tweet, “I’m taking a break, TTYL.” The latter clarifications that Hoskinson meant to take a break from social media and remain committed to development failed to quell the speculation.
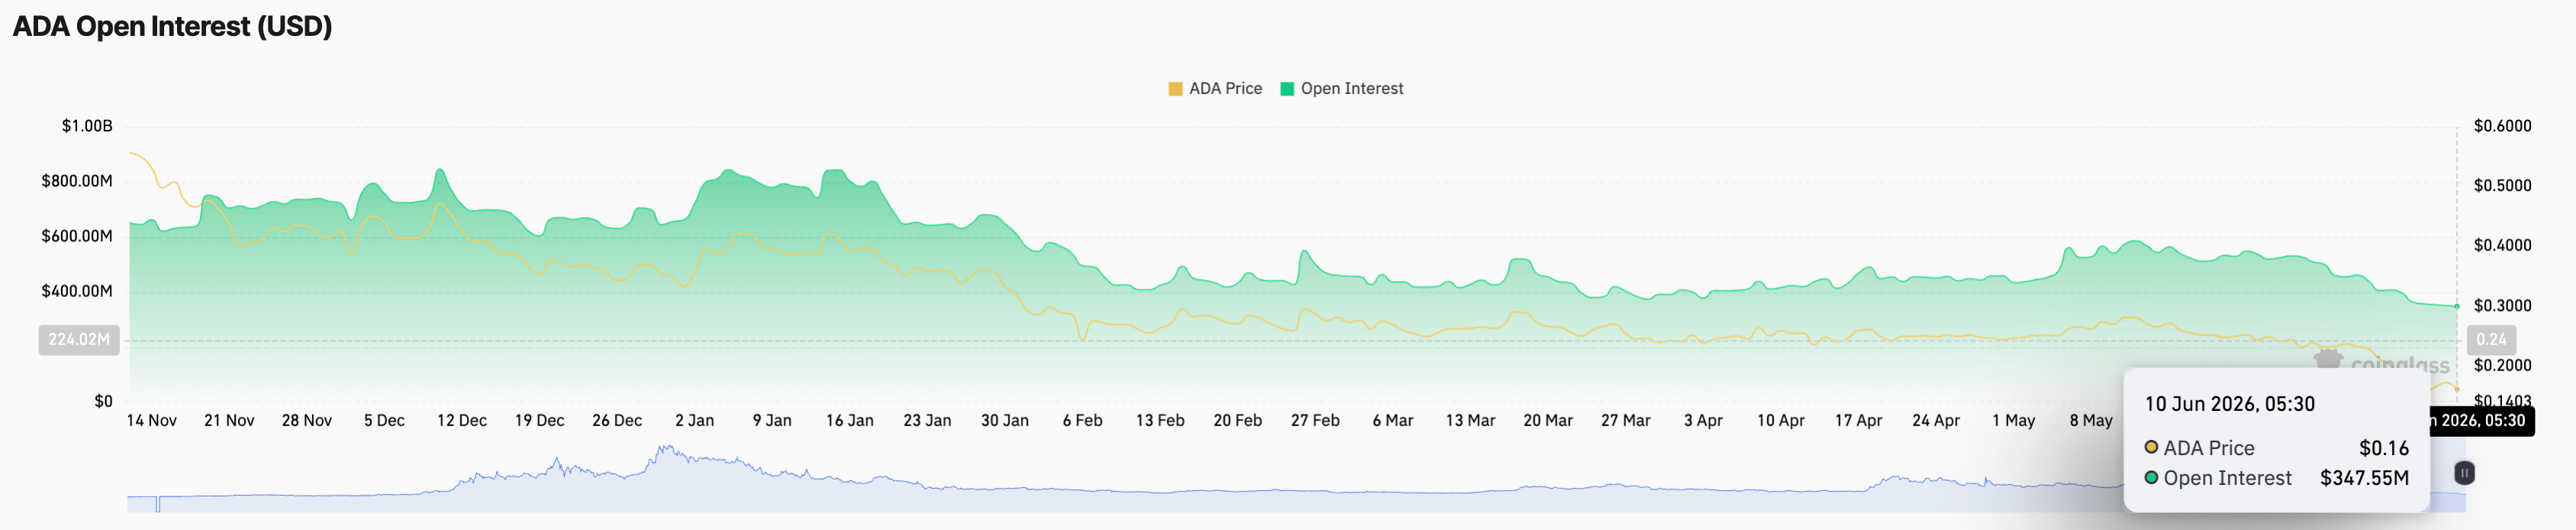
CoinGlass data show that ADA futures Open Interest (OI) has dropped to $347.55 million on Wednesday, the lowest level since November 10, 2024, continuing a steady decline from $585.35 million on May 12. Typically, a decline in OI results from the closing of leveraged positions as traders become risk-averse.
Could Cardano hold its ground above $0.1500?
Cardano hovers just above $0.1600 at press time on Wednesday, extending a bearish trend after forming a short-term peak at $0.1745 on Monday. ADA price remains well below the 50-, 100-, and 200-day Exponential Moving Averages (EMAs), which now act as overhead resistance.
From a technical perspective, the cluster of medium- and long-term EMAs, led by the 50-day EMA at roughly $0.2275 and the 100-day EMA near $0.2552, suggests the broader trend remains pressured.
That said, the momentum indicators reinforce the weak tone on the daily chart, with the Relative Strength Index (RSI) at 21 hovering deep into the oversold territory and the Moving Average Convergence Divergence (MACD) lines remaining below zero, hinting that downside pressure is still dominant despite the risk of intermittent relief bounces.
On the downside, the next notable technical floor is at Saturday's low at $0.1486, followed by the September 1, 2020, high at $0.1000, the primary structural reference if selling resumes aggressively.
On the topside, initial resistance is seen at Monday's high at $0.1745, followed by the $0.2000 psychological threshold. However, to ease the prevailing bearish outlook, ADA should reclaim the $0.2205 support-turned-resistance level, near the 50-day EMA at $0.2275.
(The technical analysis of this story was written with the help of an AI tool.)
Cryptocurrency prices FAQs
Token launches influence demand and adoption among market participants. Listings on crypto exchanges deepen the liquidity for an asset and add new participants to an asset’s network. This is typically bullish for a digital asset.
A hack is an event in which an attacker captures a large volume of the asset from a DeFi bridge or hot wallet of an exchange or any other crypto platform via exploits, bugs or other methods. The exploiter then transfers these tokens out of the exchange platforms to ultimately sell or swap the assets for other cryptocurrencies or stablecoins. Such events often involve an en masse panic triggering a sell-off in the affected assets.
Macroeconomic events like the US Federal Reserve’s decision on interest rates influence crypto assets mainly through the direct impact they have on the US Dollar. An increase in interest rate typically negatively influences Bitcoin and altcoin prices, and vice versa. If the US Dollar index declines, risk assets and associated leverage for trading gets cheaper, in turn driving crypto prices higher.
Halvings are typically considered bullish events as they slash the block reward in half for miners, constricting the supply of the asset. At consistent demand if the supply reduces, the asset’s price climbs.
추천 기사


