

Crypto Today: Bitcoin, Ethereum pare losses as XRP rebounds amid escalating tensions in the Middle East
- Bitcoin consolidates above support at $67,000 on Wednesday, as the US attacks Iran’s Qeshm Island in “self-defence.”
- Ethereum extends its decline and holds above $1,800 after Iran launched attacks on Kuwait and Bahrain.
- XRP rises above $1.24, signaling renewed investor interest above the $1.20 support level.
The cryptocurrency market remains largely under pressure on Wednesday amid escalating tensions in the Middle East. After plunging from its May high of $82,823, Bitcoin (BTC) is showing signs of stabilization, consolidating above the key $67,000 support level. At the same time, Ethereum (ETH) remains resilient above $1,800, while Ripple (XRP) stages a recovery near $1.24.
US and Iran escalate tensions in the Middle East as risk-off sentiment spreads
The United States (US) military's Central Command (Centcom) said on Tuesday that it launched "self-defence" strikes against Iran on Qeshm Island in the Strait of Hormuz.
Centcom added that it "defeated multiple" Iranian missiles and drones in response to Iran's drone attacks on US forces in Kuwait. Additionally, Iran is reported to have launched three missiles at Bahrain, which were intercepted by US and Bahrain air defense forces.
“We had previously warned that in case of aggression, the response would be different and more severe, and we acted accordingly,” Iran’s paramilitary Revolutionary Guard said in a statement.
Despite reports that Iran had stopped communication amid peace negotiations via mediators, US President Donald Trump dismissed the allegations as “false and erroneous,” according to AP News.
“The conversations between us have been going on continuously, including four days ago, three days ago, two days ago, one day ago and today,” Trump stated in a social media post. “Where they lead, one never knows, but as I told Iran, ‘It’s time, one way or another, for you to make a Deal.’”
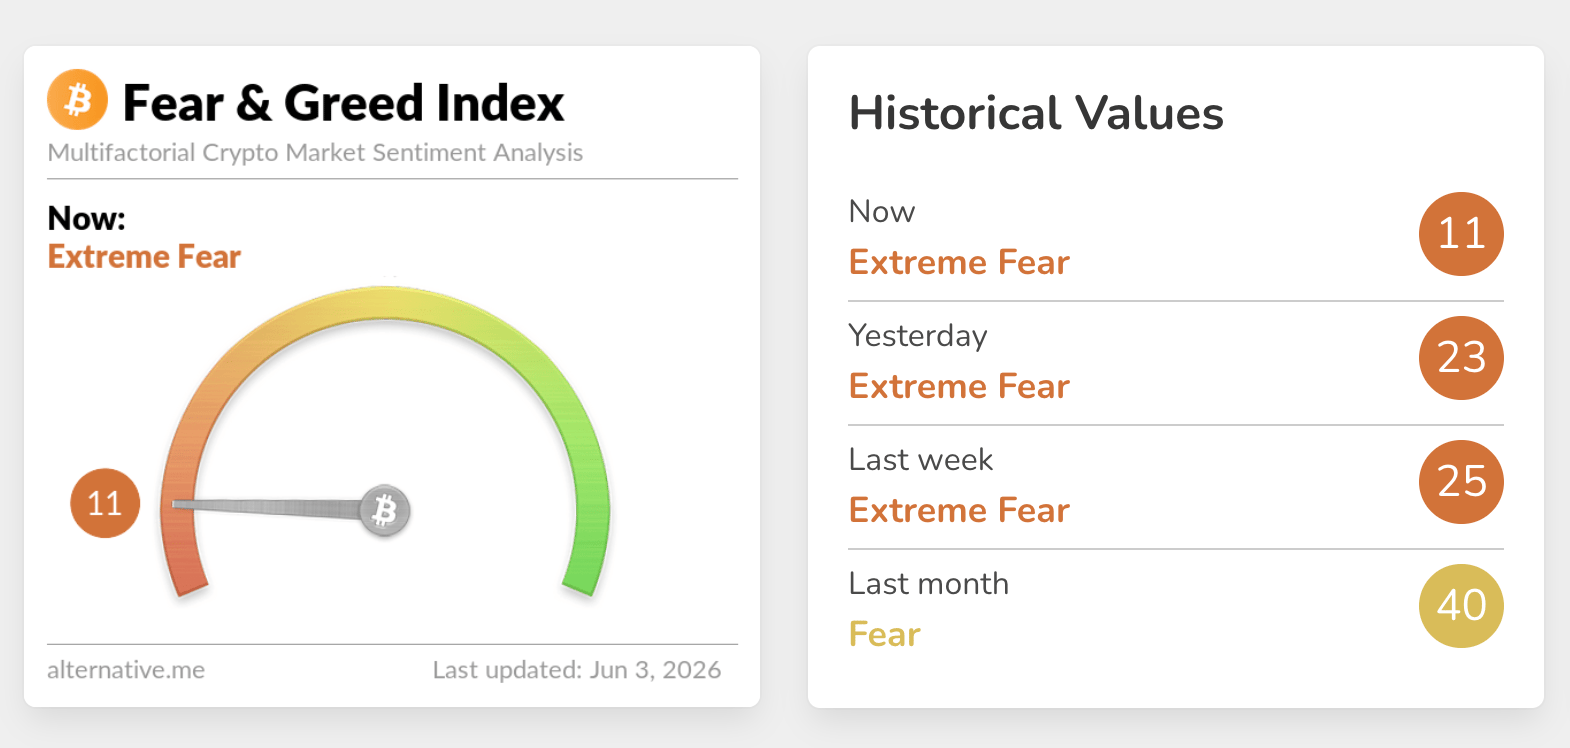
As the back-and-forth between the US and Iran continues, markets remain heavily pressured, as evidenced by the crypto Fear & Greed Index, which holds at 11 in the Extreme Fear territory on Wednesday, down from 23 the previous day. This slump suggests that risk-averse sentiment prevails and may continue to weigh on the appetite for cryptocurrencies.
Price analysis: Bitcoin defends lower support amid market pressure
Bitcoin trades at $67,035.30, extending its slide below all major Exponential Moving Averages (EMAs) and the active SuperTrend line, which keeps the near-term bias firmly bearish. The 50-day, 100-day and 200-day EMAs around $75,330, $76,096 and $80,736 respectively all sit well above spot, suggesting the broader uptrend has lost traction and rallies are likely to run into supply.
Momentum reinforces this downside tone, with the Relative Strength Index (RSI) hovering in oversold territory near 23 on the daily chart and the Moving Average Convergence Divergence (MACD) histogram deeply negative, hinting that bearish pressure remains dominant even as the risk of a corrective rebound grows.
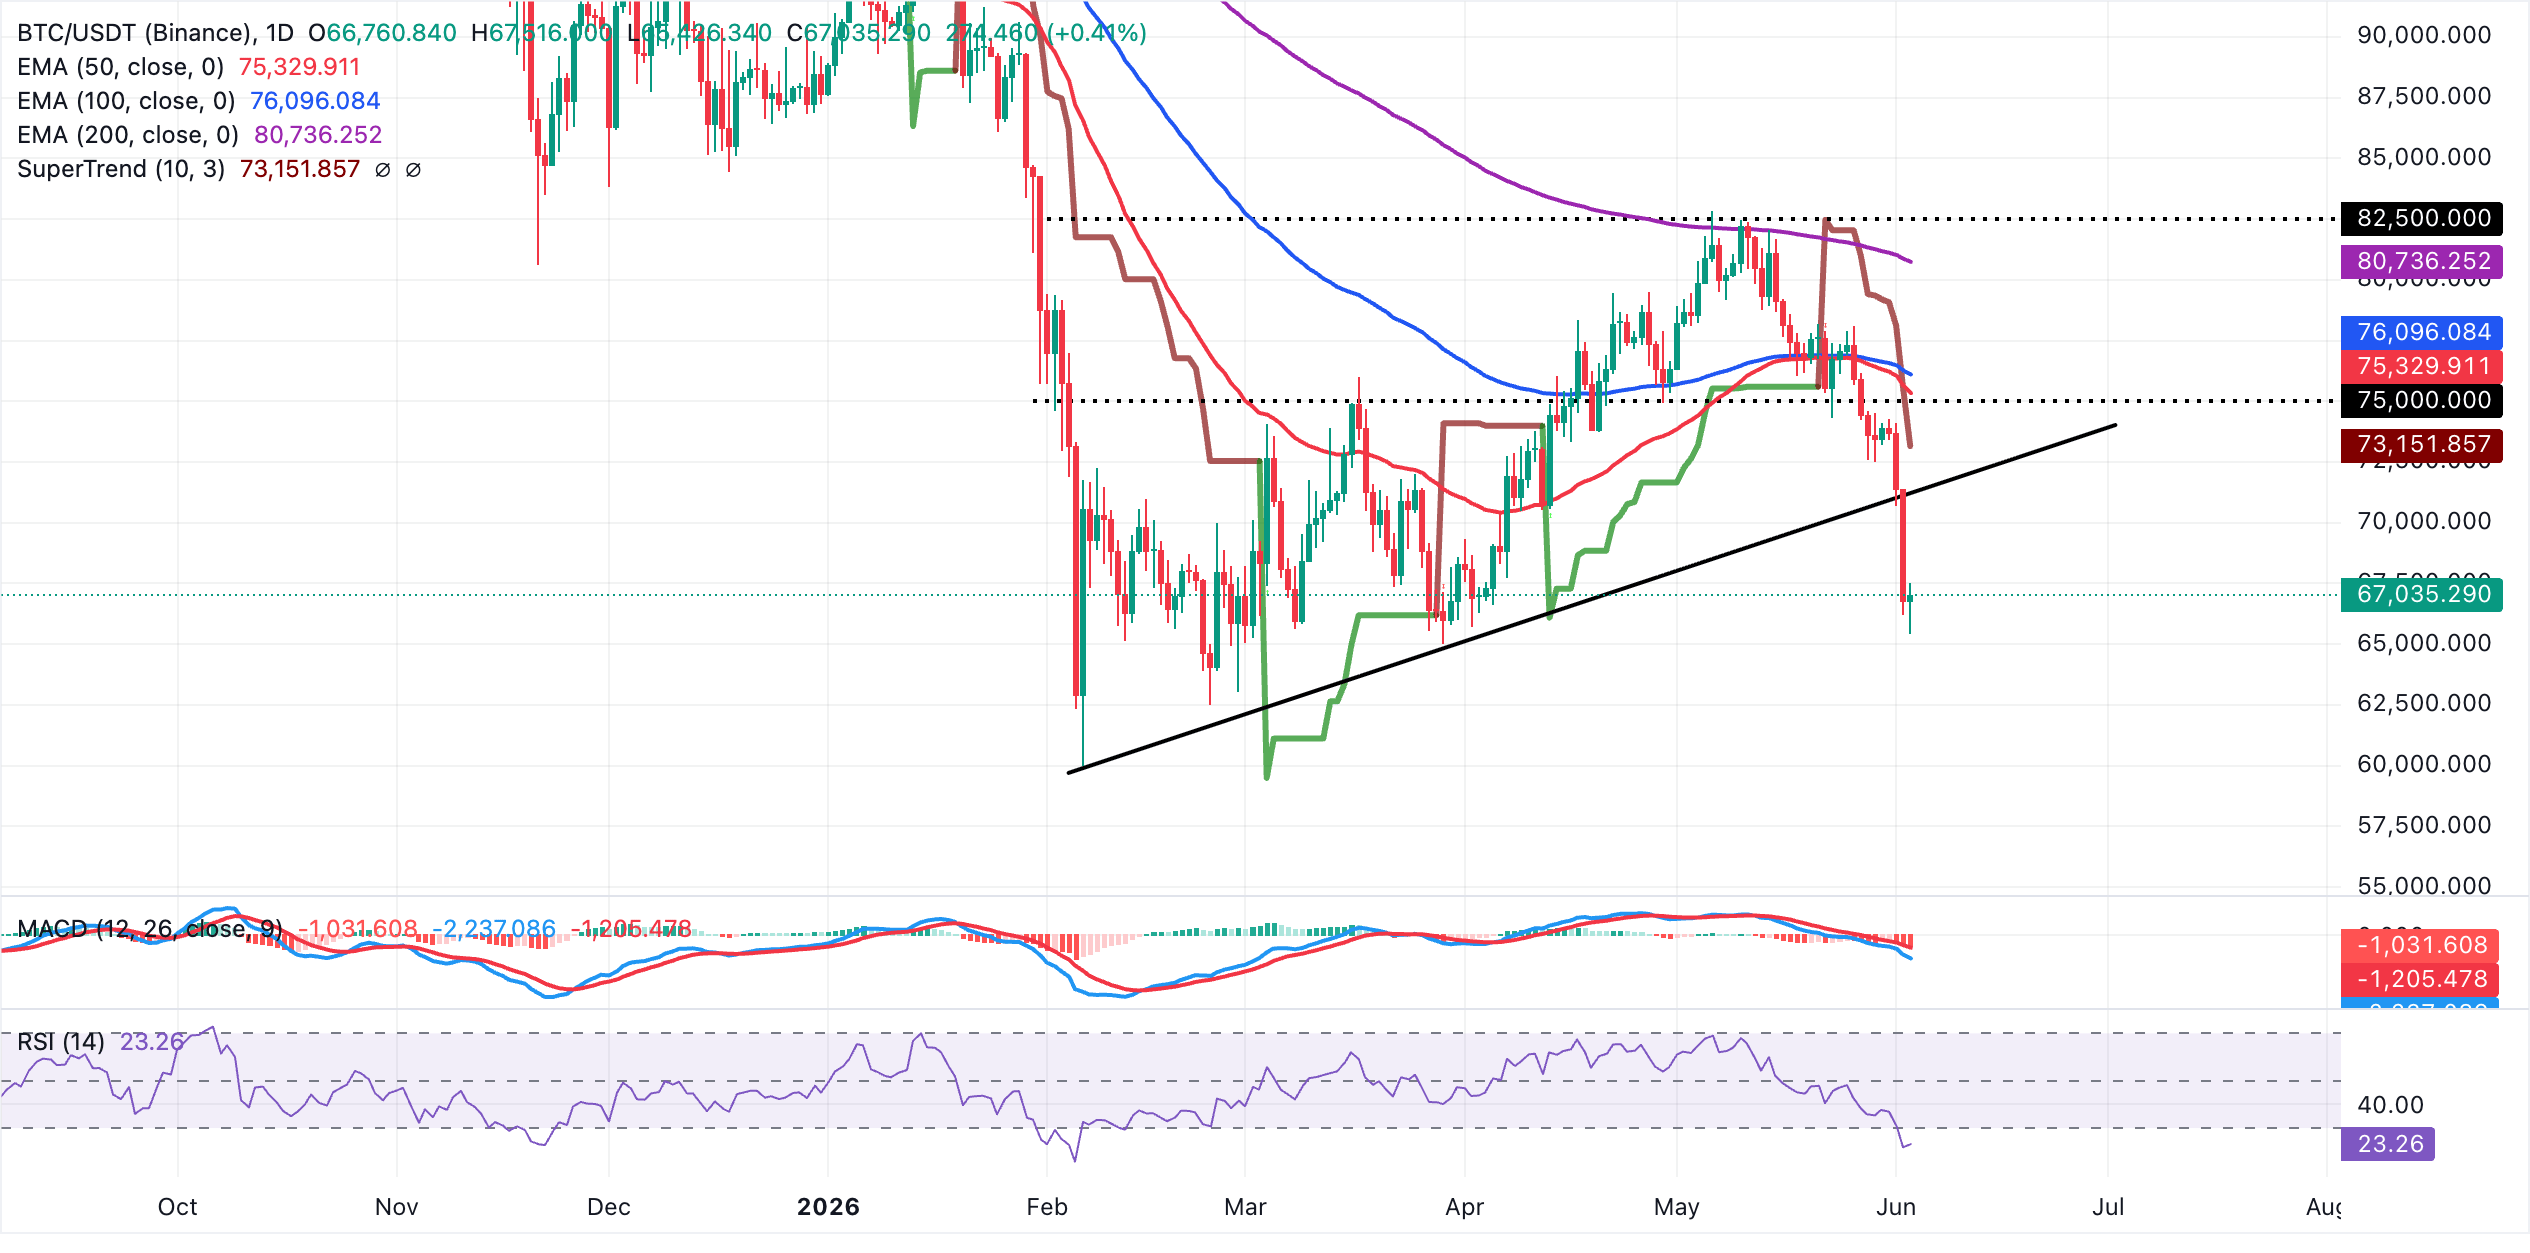
On the topside, initial resistance appears near the broken rising trendline region around $71,250, where any short-covering bounce could stall. Above that, the SuperTrend level at $73,152 forms a secondary cap before a denser resistance band comes in at the 50-day and 100-day EMAs near $75,330 and $76,096, with the 200-day EMA around $80,736 acting as a more distant barrier. A daily close above the current $67,000 support area could push Bitcoin toward $65,000 and if losses accelerate then the $60,000 level would be within reach.
Altcoins technical outlook: Ethereum clings to lower support as XRP edges higher
Ethereum trades at $1,874, maintaining a bearish near-term bias as price holds well below the key EMAs and the last SuperTrend reading at $2,079. The pair has also slipped under the rising trendline, whose break price near $2,049 now sits overhead, while the RSI hovers in oversold territory around 24 on the daily chart and the MACD remains deeply negative, together suggesting persistent downside pressure despite the risk of short-lived corrective bounces.
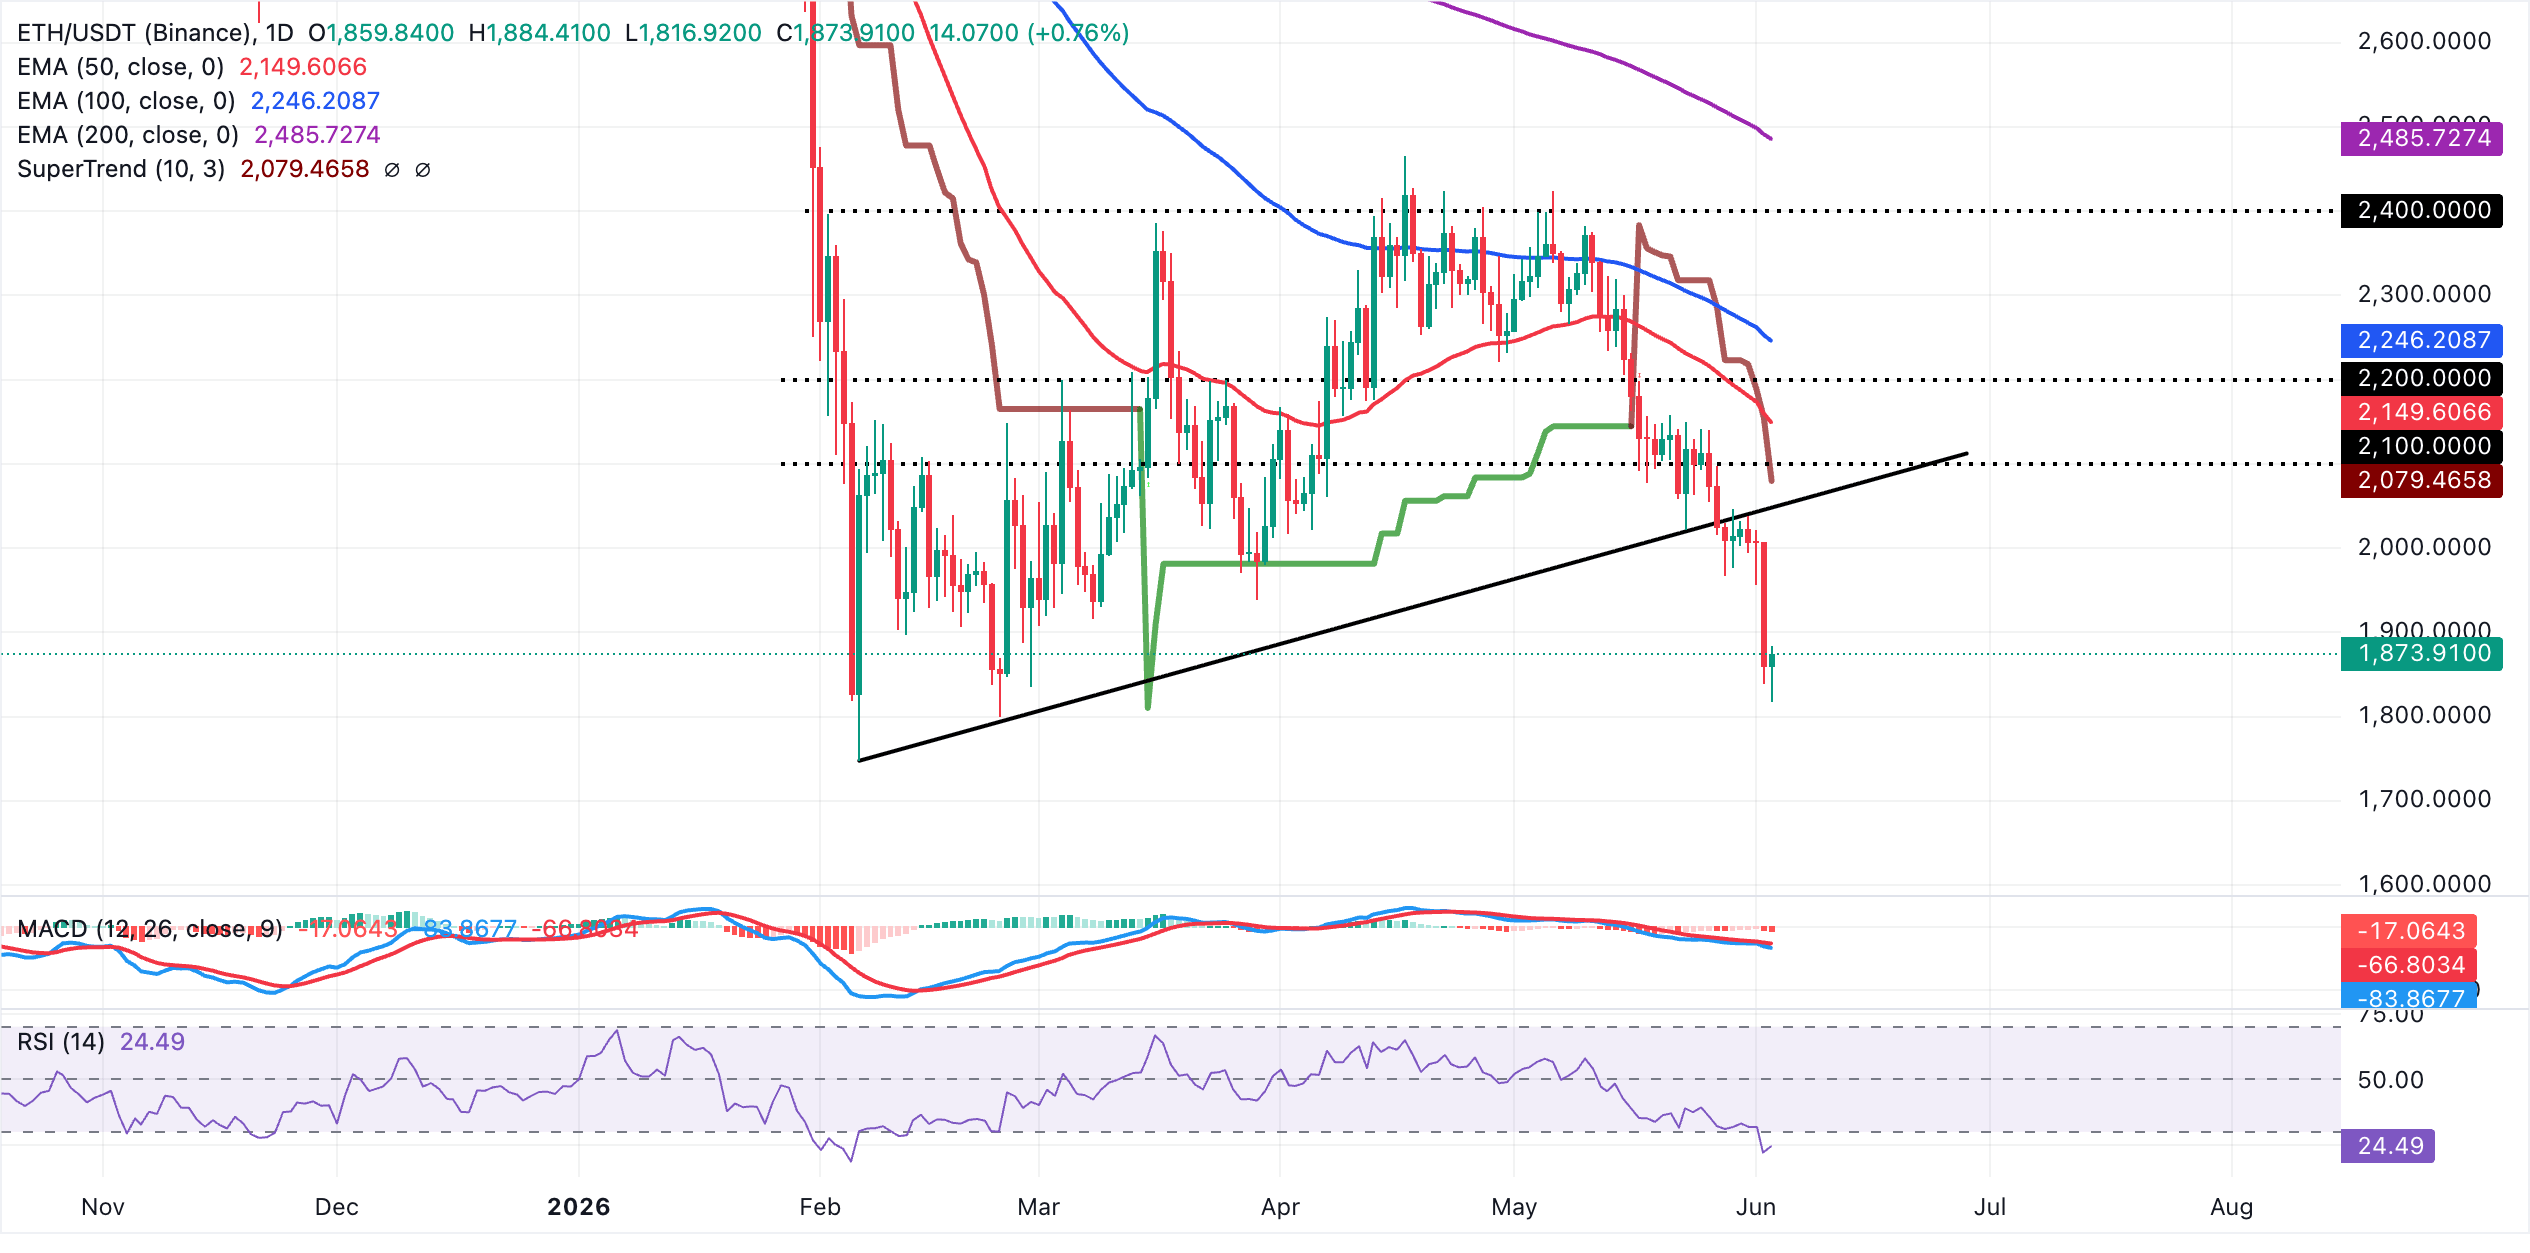
On the topside, initial resistance is defined by the former uptrend support area around $2,049, followed closely by the latest SuperTrend barrier near $2,079. Above that, the 50-day EMA at about $2,149, the 100-period EMA near $2,246 and the 200-day EMA around $2,486 form a layered supply zone that would likely cap any recovery attempts unless decisively reclaimed. The region around $1,800 serves as the initial support, where buyers are likely to re-engage. If the sell-off deepens, Ethereum could drop to test the next support range between $1,600 and $1,700.
XRP, on the other hand, trades at $1.24, maintaining clear bearish pressure, with price lodged below the 50-day, 100-day and 200-day EMAs at $1.37, $1.44 and $1.65 respectively, while the SuperTrend indicator at $1.38 also sits overhead and reinforces the downside bias.
Momentum readings back this weak tone, as the RSI hovers near 33 on the daily chart, keeping XRP close to oversold territory, and the MACD remains negative with the line below its signal and the histogram in contraction, hinting at persistent but not accelerating selling pressure.
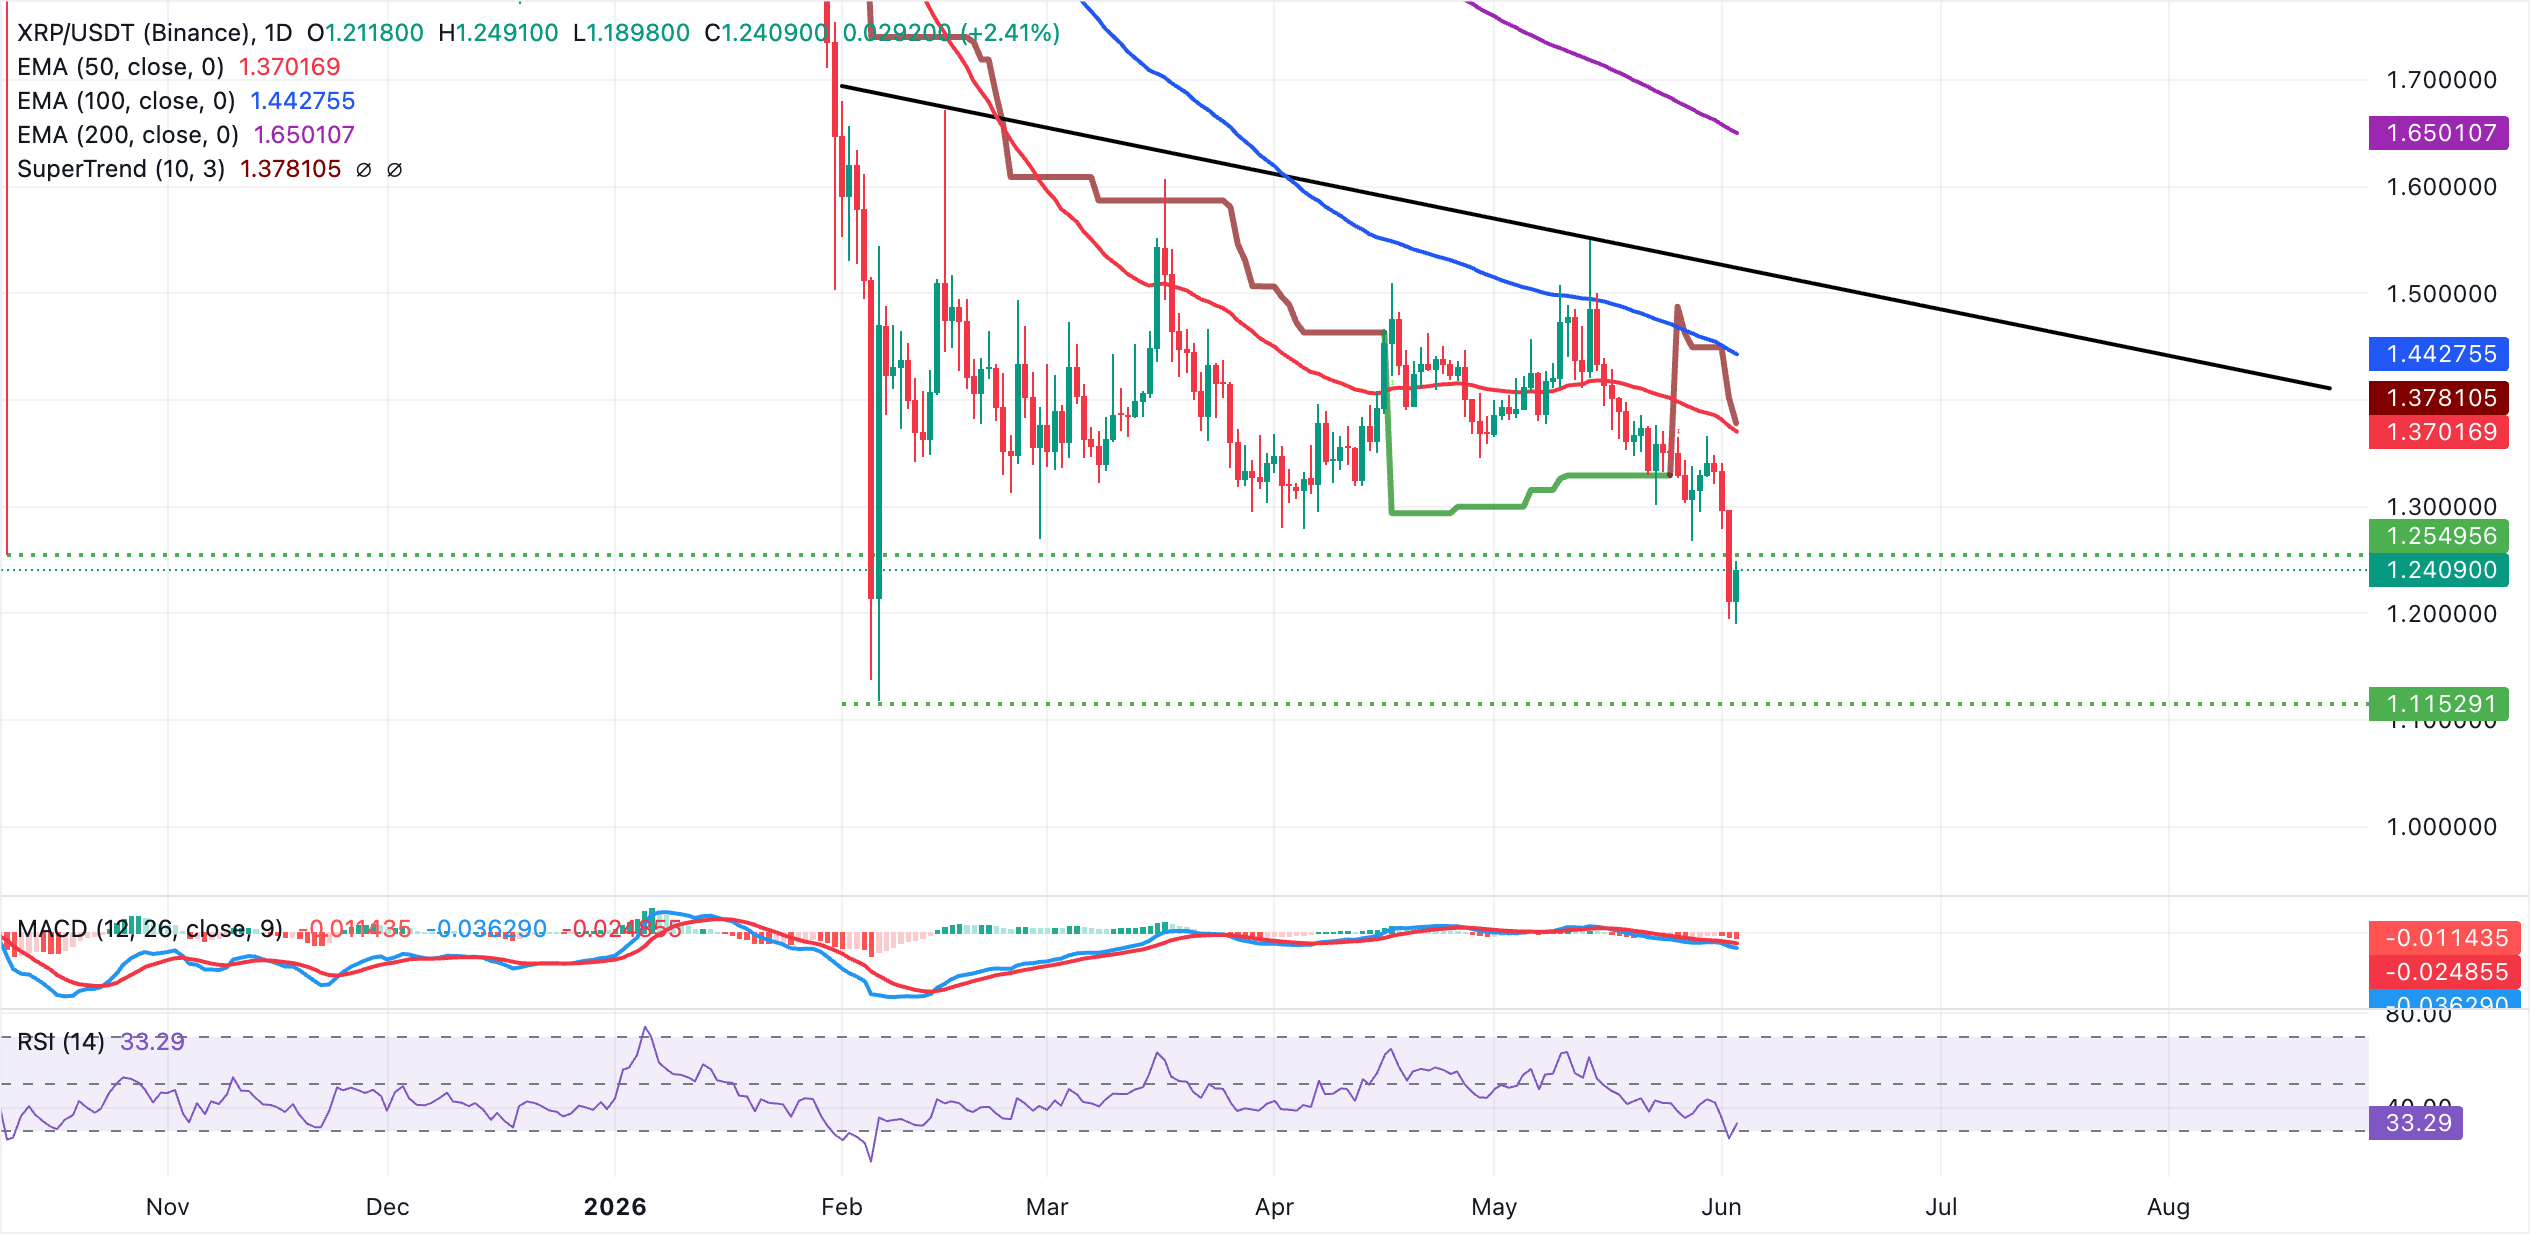
On the topside, initial resistance lies at the 50-day EMA around $1.37, closely followed by the SuperTrend line near $1.38, forming a short-term supply zone that buyers would need to reclaim to ease the immediate bearish tone. Above that, the 100-day EMA at roughly $1.44 aligns with the longer-term downward resistance trendline projected toward the $1.52 area, while the 200-day EMA near $1.65 stands as a more distant cap. As long as XRP trades below this layered EMA and trendline structure, rallies are likely to be viewed as corrective rather than the start of a sustained recovery.
(The technical analysis of this story was written with the help of an AI tool.)
Bitcoin, altcoins, stablecoins FAQs
Bitcoin is the largest cryptocurrency by market capitalization, a virtual currency designed to serve as money. This form of payment cannot be controlled by any one person, group, or entity, which eliminates the need for third-party participation during financial transactions.
Altcoins are any cryptocurrency apart from Bitcoin, but some also regard Ethereum as a non-altcoin because it is from these two cryptocurrencies that forking happens. If this is true, then Litecoin is the first altcoin, forked from the Bitcoin protocol and, therefore, an “improved” version of it.
Stablecoins are cryptocurrencies designed to have a stable price, with their value backed by a reserve of the asset it represents. To achieve this, the value of any one stablecoin is pegged to a commodity or financial instrument, such as the US Dollar (USD), with its supply regulated by an algorithm or demand. The main goal of stablecoins is to provide an on/off-ramp for investors willing to trade and invest in cryptocurrencies. Stablecoins also allow investors to store value since cryptocurrencies, in general, are subject to volatility.
Bitcoin dominance is the ratio of Bitcoin's market capitalization to the total market capitalization of all cryptocurrencies combined. It provides a clear picture of Bitcoin’s interest among investors. A high BTC dominance typically happens before and during a bull run, in which investors resort to investing in relatively stable and high market capitalization cryptocurrency like Bitcoin. A drop in BTC dominance usually means that investors are moving their capital and/or profits to altcoins in a quest for higher returns, which usually triggers an explosion of altcoin rallies.
추천 기사


