

Ripple Price Forecast: XRP accelerates downslide as mild capital inflows fail to provide support
- XRP sell-off deepens, nearing $1.25 support on Tuesday as risk-off sentiment broadly dominates the crypto market.
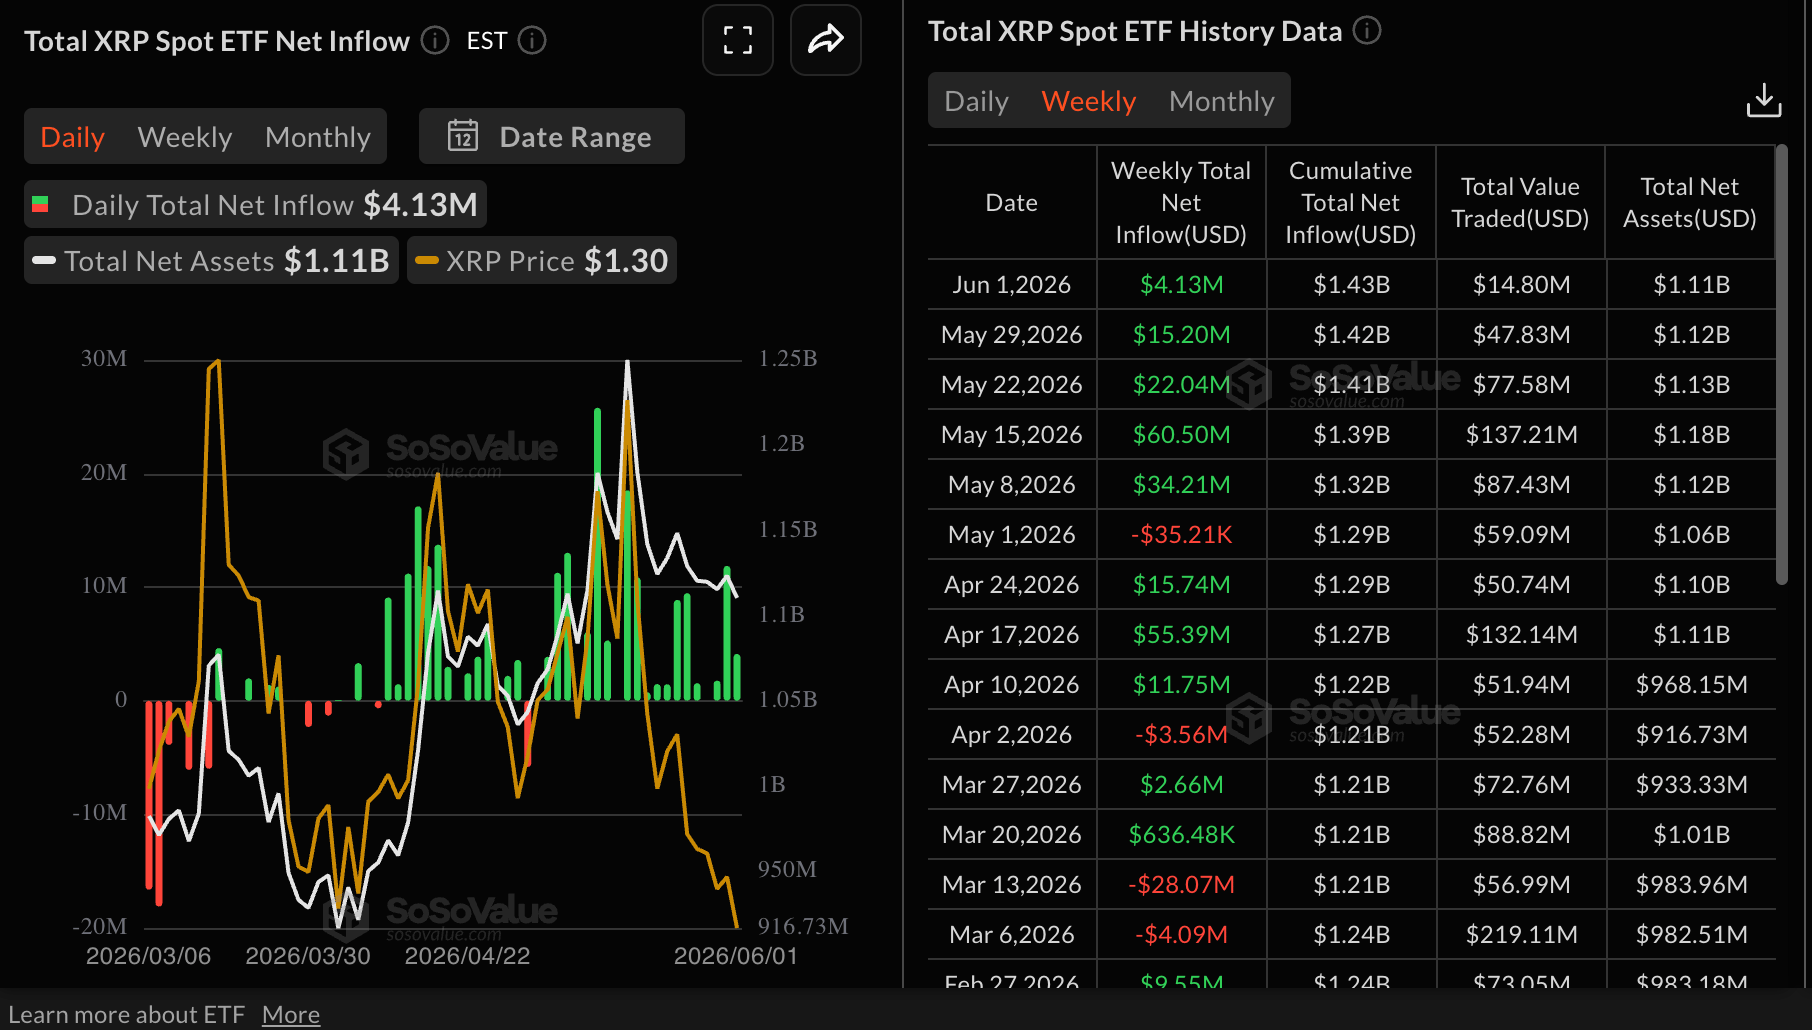
- XRP digital investment products’ inflows averaged $20 million last week, inclusive of $4.13 million in spot ETFs.
- XRP momentum indicators extend weakness, with the RSI near oversold territory and the MACD maintaining a sell signal.
Ripple (XRP) holds above $1.25 on Tuesday, a key support threshold, after extending losses for three consecutive days and hitting its lowest level since February 6. The sell-off remains broad in the cryptocurrency market, weighed down by risk-averse sentiment as tensions in the Middle East continue festering despite United States (US) President Donald Trump stating that a peace deal with Iran is reachable "over the next week.”
Additionally, a CNN report said that peace negotiations between the two countries were restarted hours after Iran suspended talks over Israel’s offensive in Lebanon.
XRP downtrend persists despite capital inflows
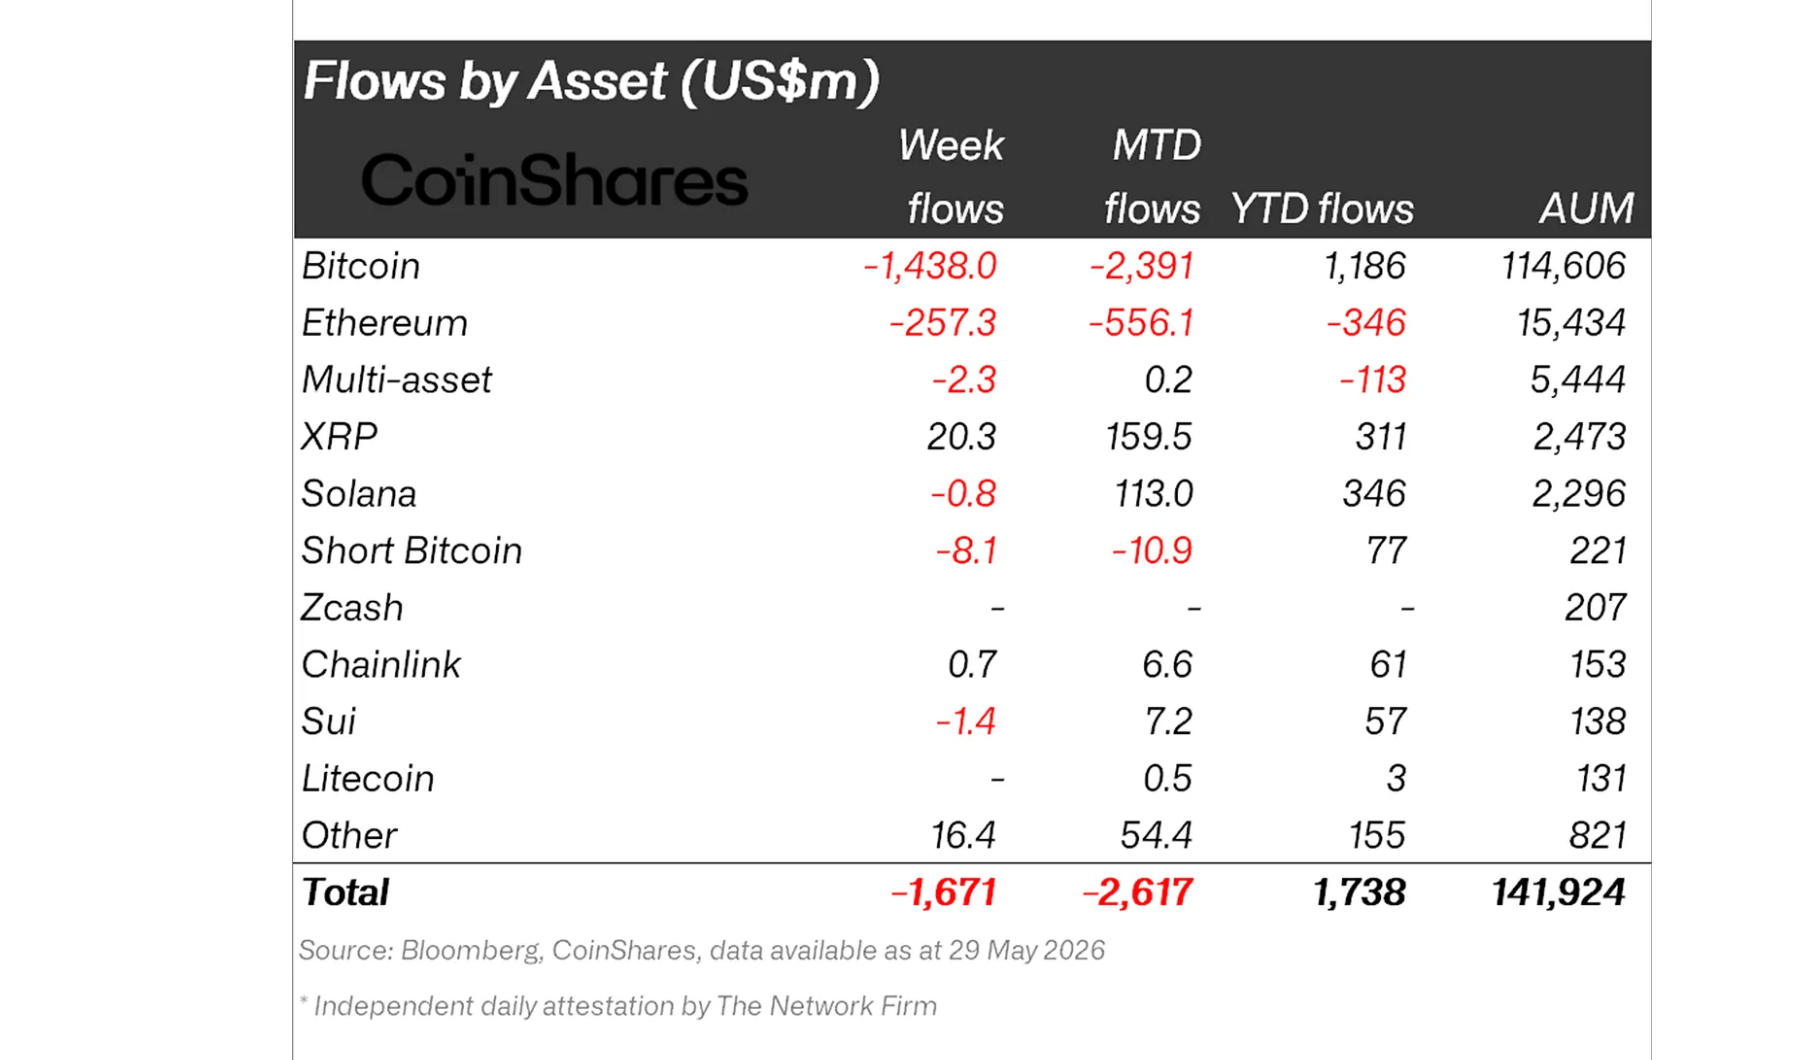
XRP has continued to sustain capital inflows through various digital investment products, including US-listed spot Exchange-Traded Funds (ETFs). CoinShares’ Monday report on capital flows in the crypto market indicates that investors deposited roughly $20 million last week through June 1.
“Only five assets recorded meaningful inflows above US$1M, down from nine last week, with XRP at US$20.3M, Hyperliquid US$10.8M and Near US$7.6M the only notable inflows,” the CoinShares report states.
Meanwhile, XRP spot ETFs beat the odds to post mild inflows of $4.13 million last week, extending the bullish streak for five consecutive weeks. Cumulative inflows average $1.43 billion, with net assets under management standing at $1.11 billion.
Price analysis: XRP losses escalate as sellers tighten grip
XRP trades at $1.26, extending its decline well beneath the short, medium and long-term Exponential Moving Averages (EMAs), which keeps the near-term bias clearly bearish. The 50-day EMA at $1.38, the 100-day EMA at $1.45 and the 200-day EMA at $1.65 all sit comfortably above spot, suggesting that rebounds are likely to face supply into this stacked dynamic resistance zone.
The Moving Average Convergence Divergence (MACD) histogram remains in negative territory on the daily chart, and the Relative Strength Index (RSI) hovers near oversold levels around 32, hinting that downside momentum persists even if price is becoming stretched.
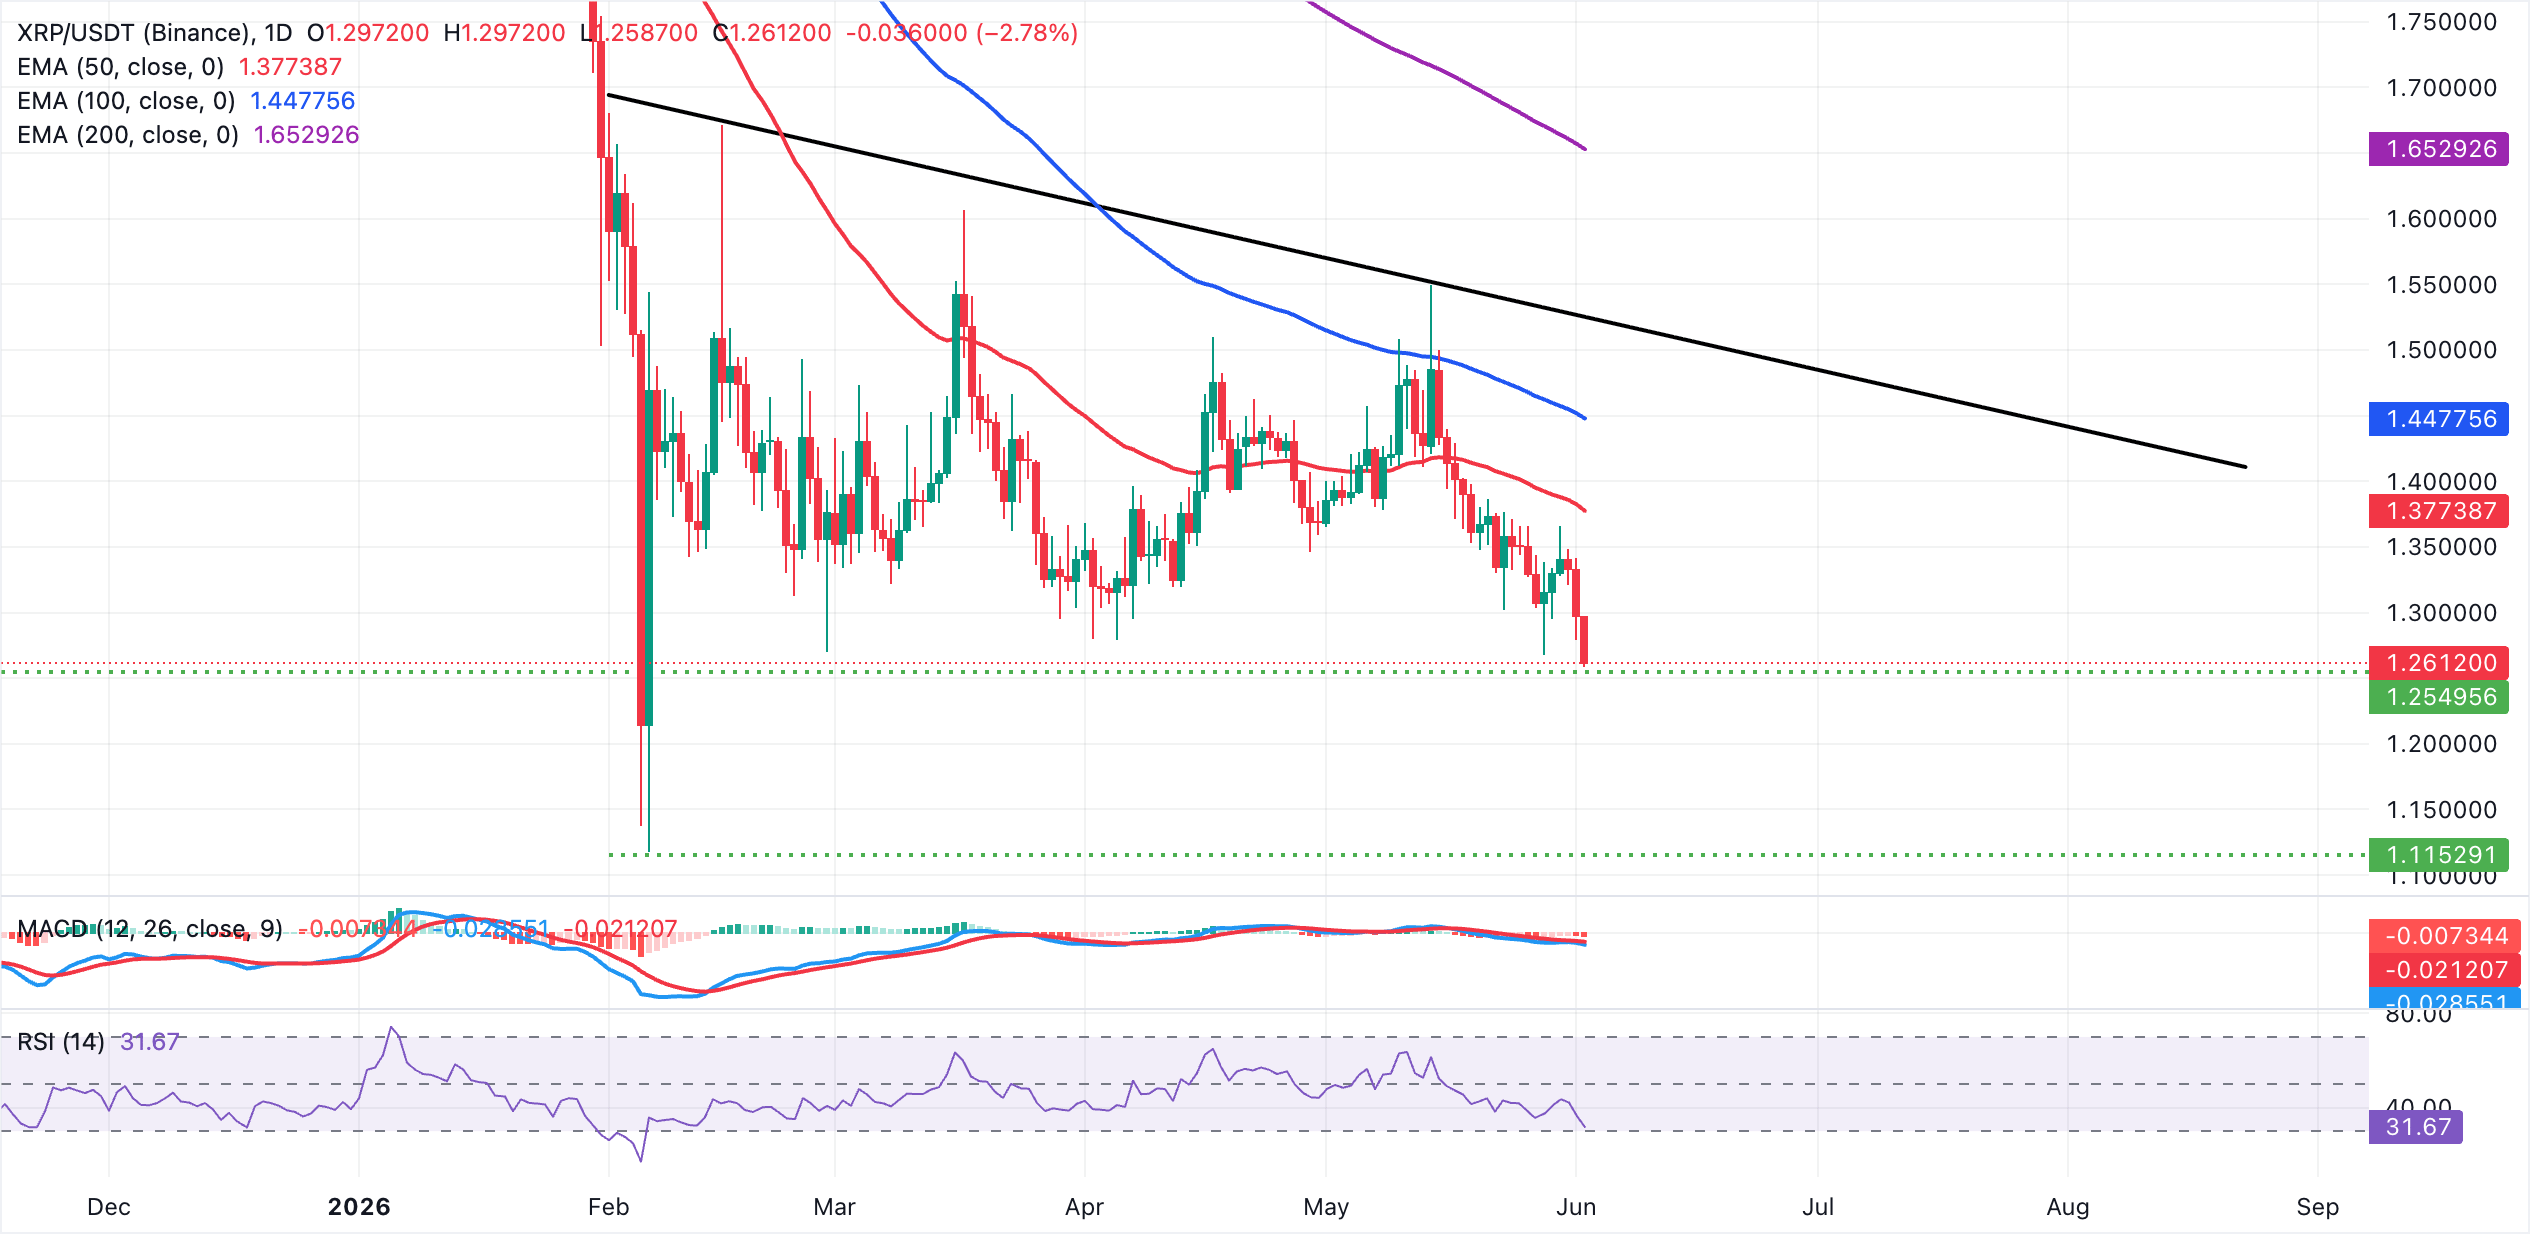
On the topside, initial resistance lies at the 50-day EMA near $1.38, followed by the 100-day EMA around $1.45, where sellers could attempt to reassert control on any corrective bounce. A more decisive recovery would need a break above the descending resistance trend line, currently intersecting near $1.52, with the 200-day EMA around $1.65 acting as a broader bearish pivot whose recovery would be required to ease the prevailing negative outlook.
(The technical analysis of this story was written with the help of an AI tool.)
Crypto ETF FAQs
An Exchange-Traded Fund (ETF) is an investment vehicle or an index that tracks the price of an underlying asset. ETFs can not only track a single asset, but a group of assets and sectors. For example, a Bitcoin ETF tracks Bitcoin’s price. ETF is a tool used by investors to gain exposure to a certain asset.
Yes. The first Bitcoin futures ETF in the US was approved by the US Securities & Exchange Commission in October 2021. A total of seven Bitcoin futures ETFs have been approved, with more than 20 still waiting for the regulator’s permission. The SEC says that the cryptocurrency industry is new and subject to manipulation, which is why it has been delaying crypto-related futures ETFs for the last few years.
Yes. The SEC approved in January 2024 the listing and trading of several Bitcoin spot Exchange-Traded Funds, opening the door to institutional capital and mainstream investors to trade the main crypto currency. The decision was hailed by the industry as a game changer.
The main advantage of crypto ETFs is the possibility of gaining exposure to a cryptocurrency without ownership, reducing the risk and cost of holding the asset. Other pros are a lower learning curve and higher security for investors since ETFs take charge of securing the underlying asset holdings. As for the main drawbacks, the main one is that as an investor you can’t have direct ownership of the asset, or, as they say in crypto, “not your keys, not your coins.” Other disadvantages are higher costs associated with holding crypto since ETFs charge fees for active management. Finally, even though investing in ETFs reduces the risk of holding an asset, price swings in the underlying cryptocurrency are likely to be reflected in the investment vehicle too.
추천 기사


