


Crypto Overview: Worldcoin, Sei, Terra Classic rally amid $300 million liquidations
- Bitcoin edges below $76,000 on Wednesday, signaling a short-term weakness.
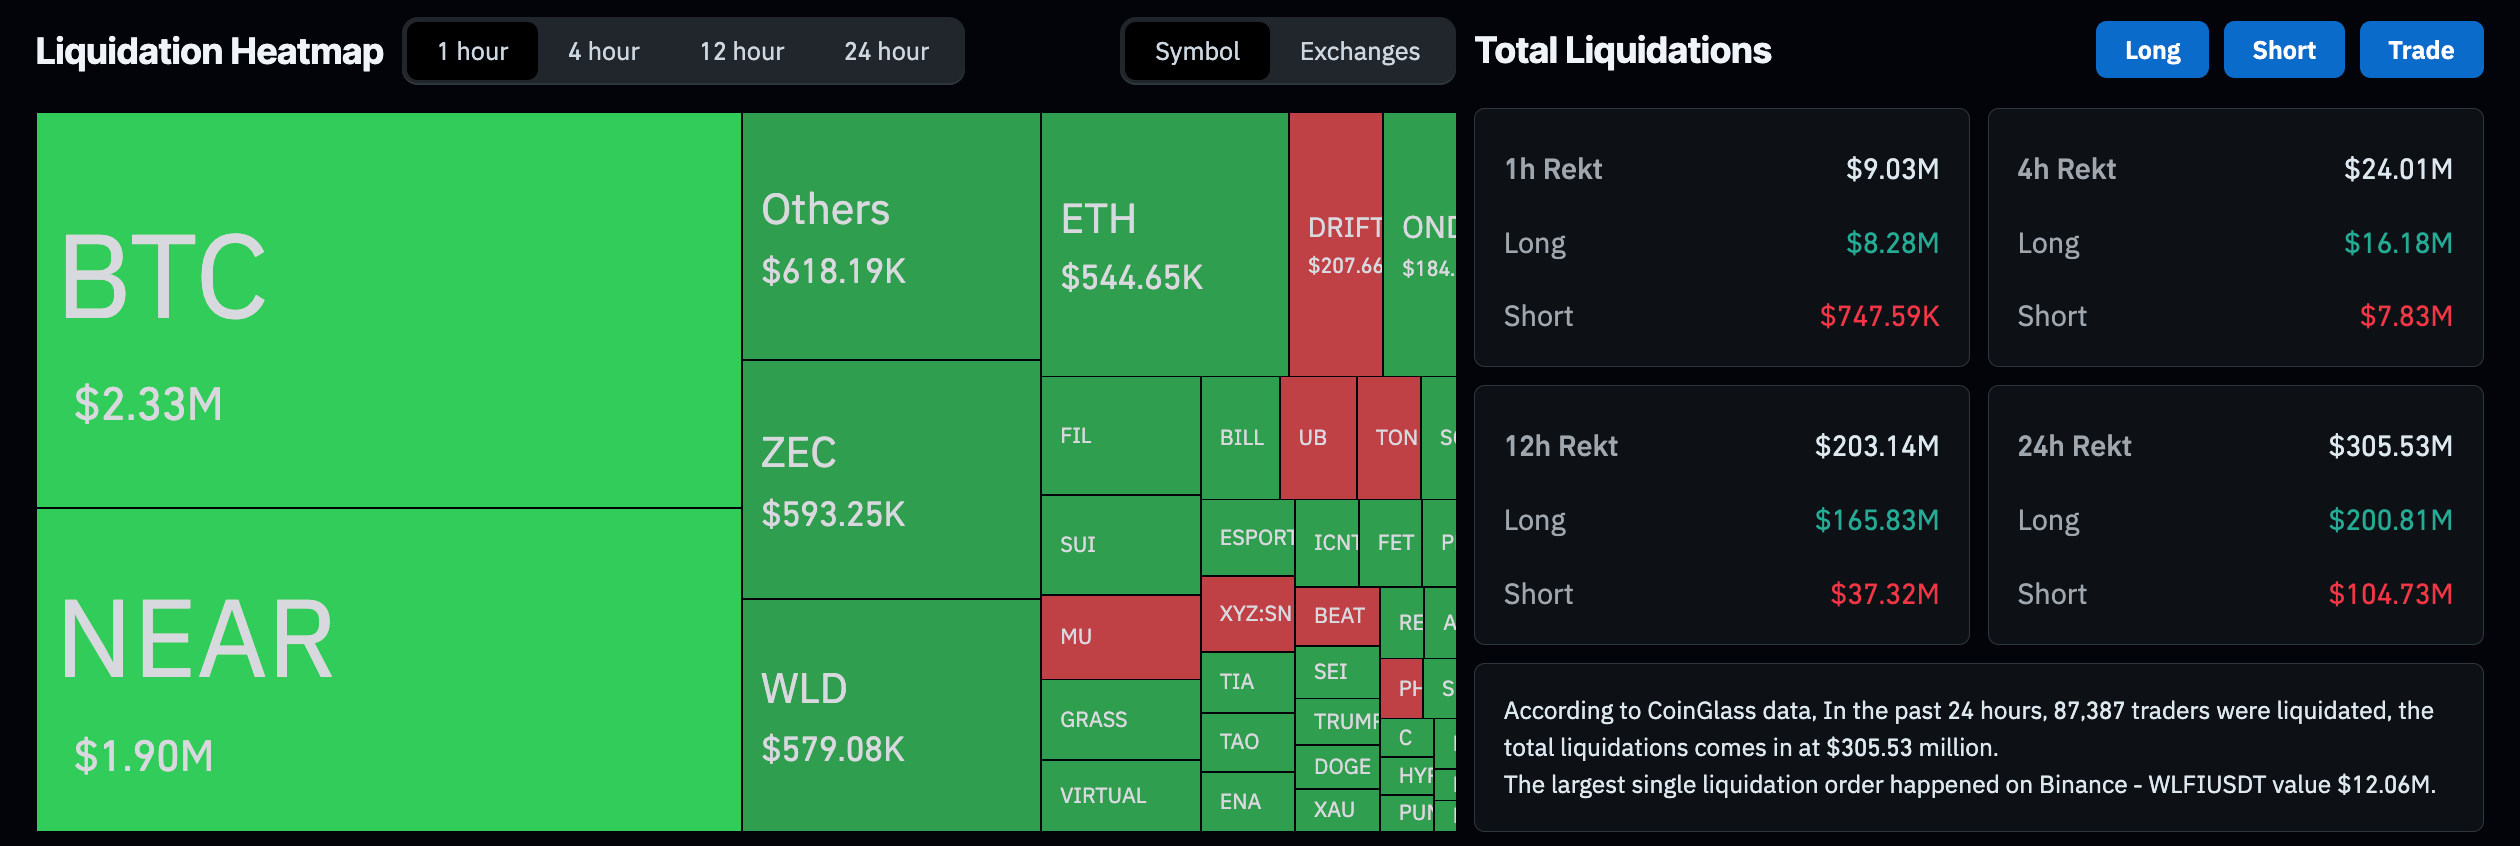
- The crypto market records over $300 million in total liquidations over the last 24 hours, mirroring Bitcoin’s drag.
- Worldcoin, Sei, and Terra Classic outperform the broader market over the last 24 hours.
Bitcoin (BTC) is trading below $76,000 at press time on Wednesday, cascading bearish pressure to altcoins. Total liquidations over the last 24 hours have surpassed $300 million, signaling mild volatility. Still, Worldcoin (WLD), Sei (SEI), and Terra Classic (LUNC) hold gains over the same period.
Bitcoin under $76,000 triggers $300 million liquidation spike
Bitcoin hovers below $76,000 on Wednesday after a minor pullback the previous day, triggering a broader market pullback. CoinGlass data shows that total liquidations over the last 24 hours exceeded $300 million, led by $200 million in long liquidations, indicating a forced wipeout of bullish positions under pressure. However, the long-term data shows that the liquidations are within normal limits, suggesting a mild near-term volatility.
Technical outlook: Could Worldcoin, Sei, and Terra Luna sustain their gains?
Worldcoin is down 4% at press time on Wednesday, after a 13% jump the previous day. The WLD token holds a bullish bias above the 50- and 100-day Exponential Moving Averages, while the 200-day EMA at $0.4533 remains the next major topside cap.
Momentum backs the constructive tone, with the Relative Strength Index (RSI) sitting in overbought territory near 71 and Moving Average Convergence Divergence (MACD) holding in positive territory with a positive histogram, which together suggest strong but increasingly stretched upside conditions.
The falling wedge breakout rally in WLD faces short-term resistance at the March 16 high of $0.4060, followed by the 200-day EMA at $0.4533.
Looking down, immediate support is emerging at the 100-day EMA at roughly $0.3265 and the 50-day EMA near $0.2830.
SEI rises above its 50-day EMA at $0.0628 with its third day of recovery but remaining capped by the 100-day EMA at $0.0706, which maintains a neutral-to-bearish near-term bias while price stays within this band. The RSI at 57 and the MACD line rising toward its signal line for a bullish crossover, hint at upside traction.
On the topside, initial resistance is located at the 100-day EMA around $0.0706, and a daily close above this barrier would be needed to open the way toward the more substantial 200-day EMA resistance near $0.0984.
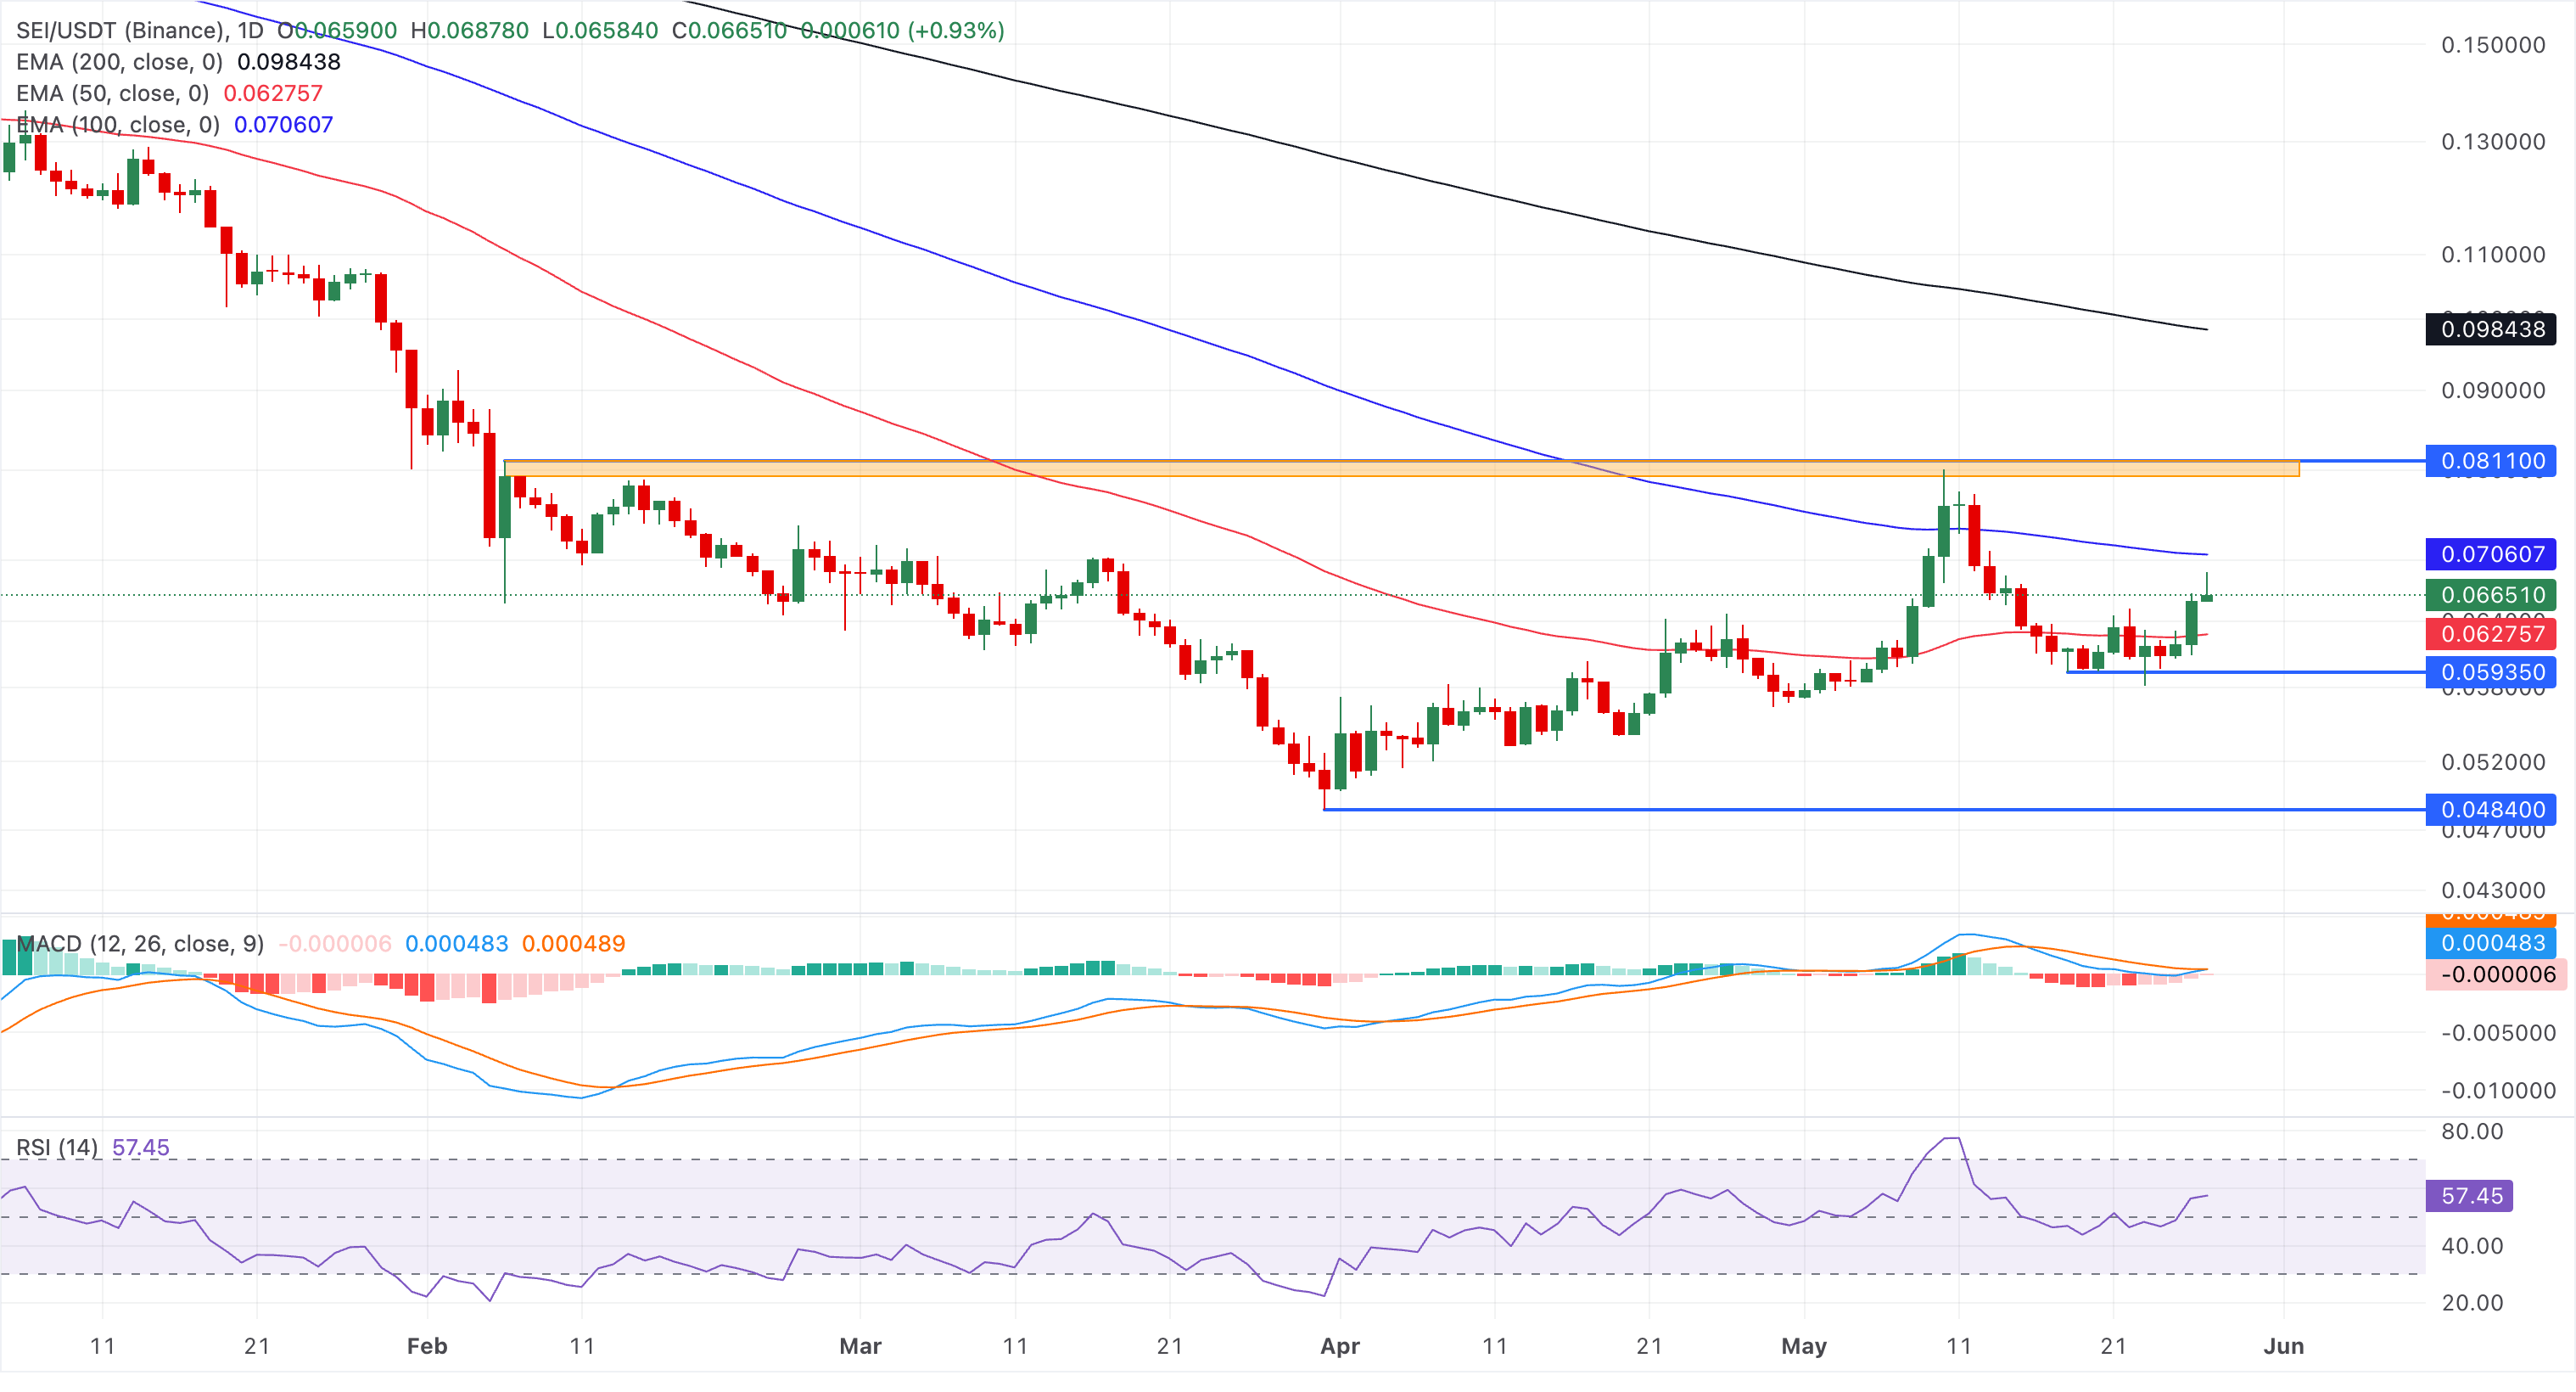
On the downside, immediate support comes from the 50-day EMA at $0.0628; a clear break below this floor would expose the pair to deeper retracements, reinforcing the broader corrective tone.
Terra Classic is effectively pinned above the tight cluster of the 50-day, 100-day, and 200-day Exponential Moving Averages (EMAs), supporting the bullish recovery.
The RSI at about 57 suggests mildly positive but not overextended momentum, while the flat MACD line nears the signal line, hinting at a lack of strong directional conviction in the near term.
A decisive close above $0.000091 would open the path above the $0.000100 psychological level, potentially targeting the $0.000125 mark.
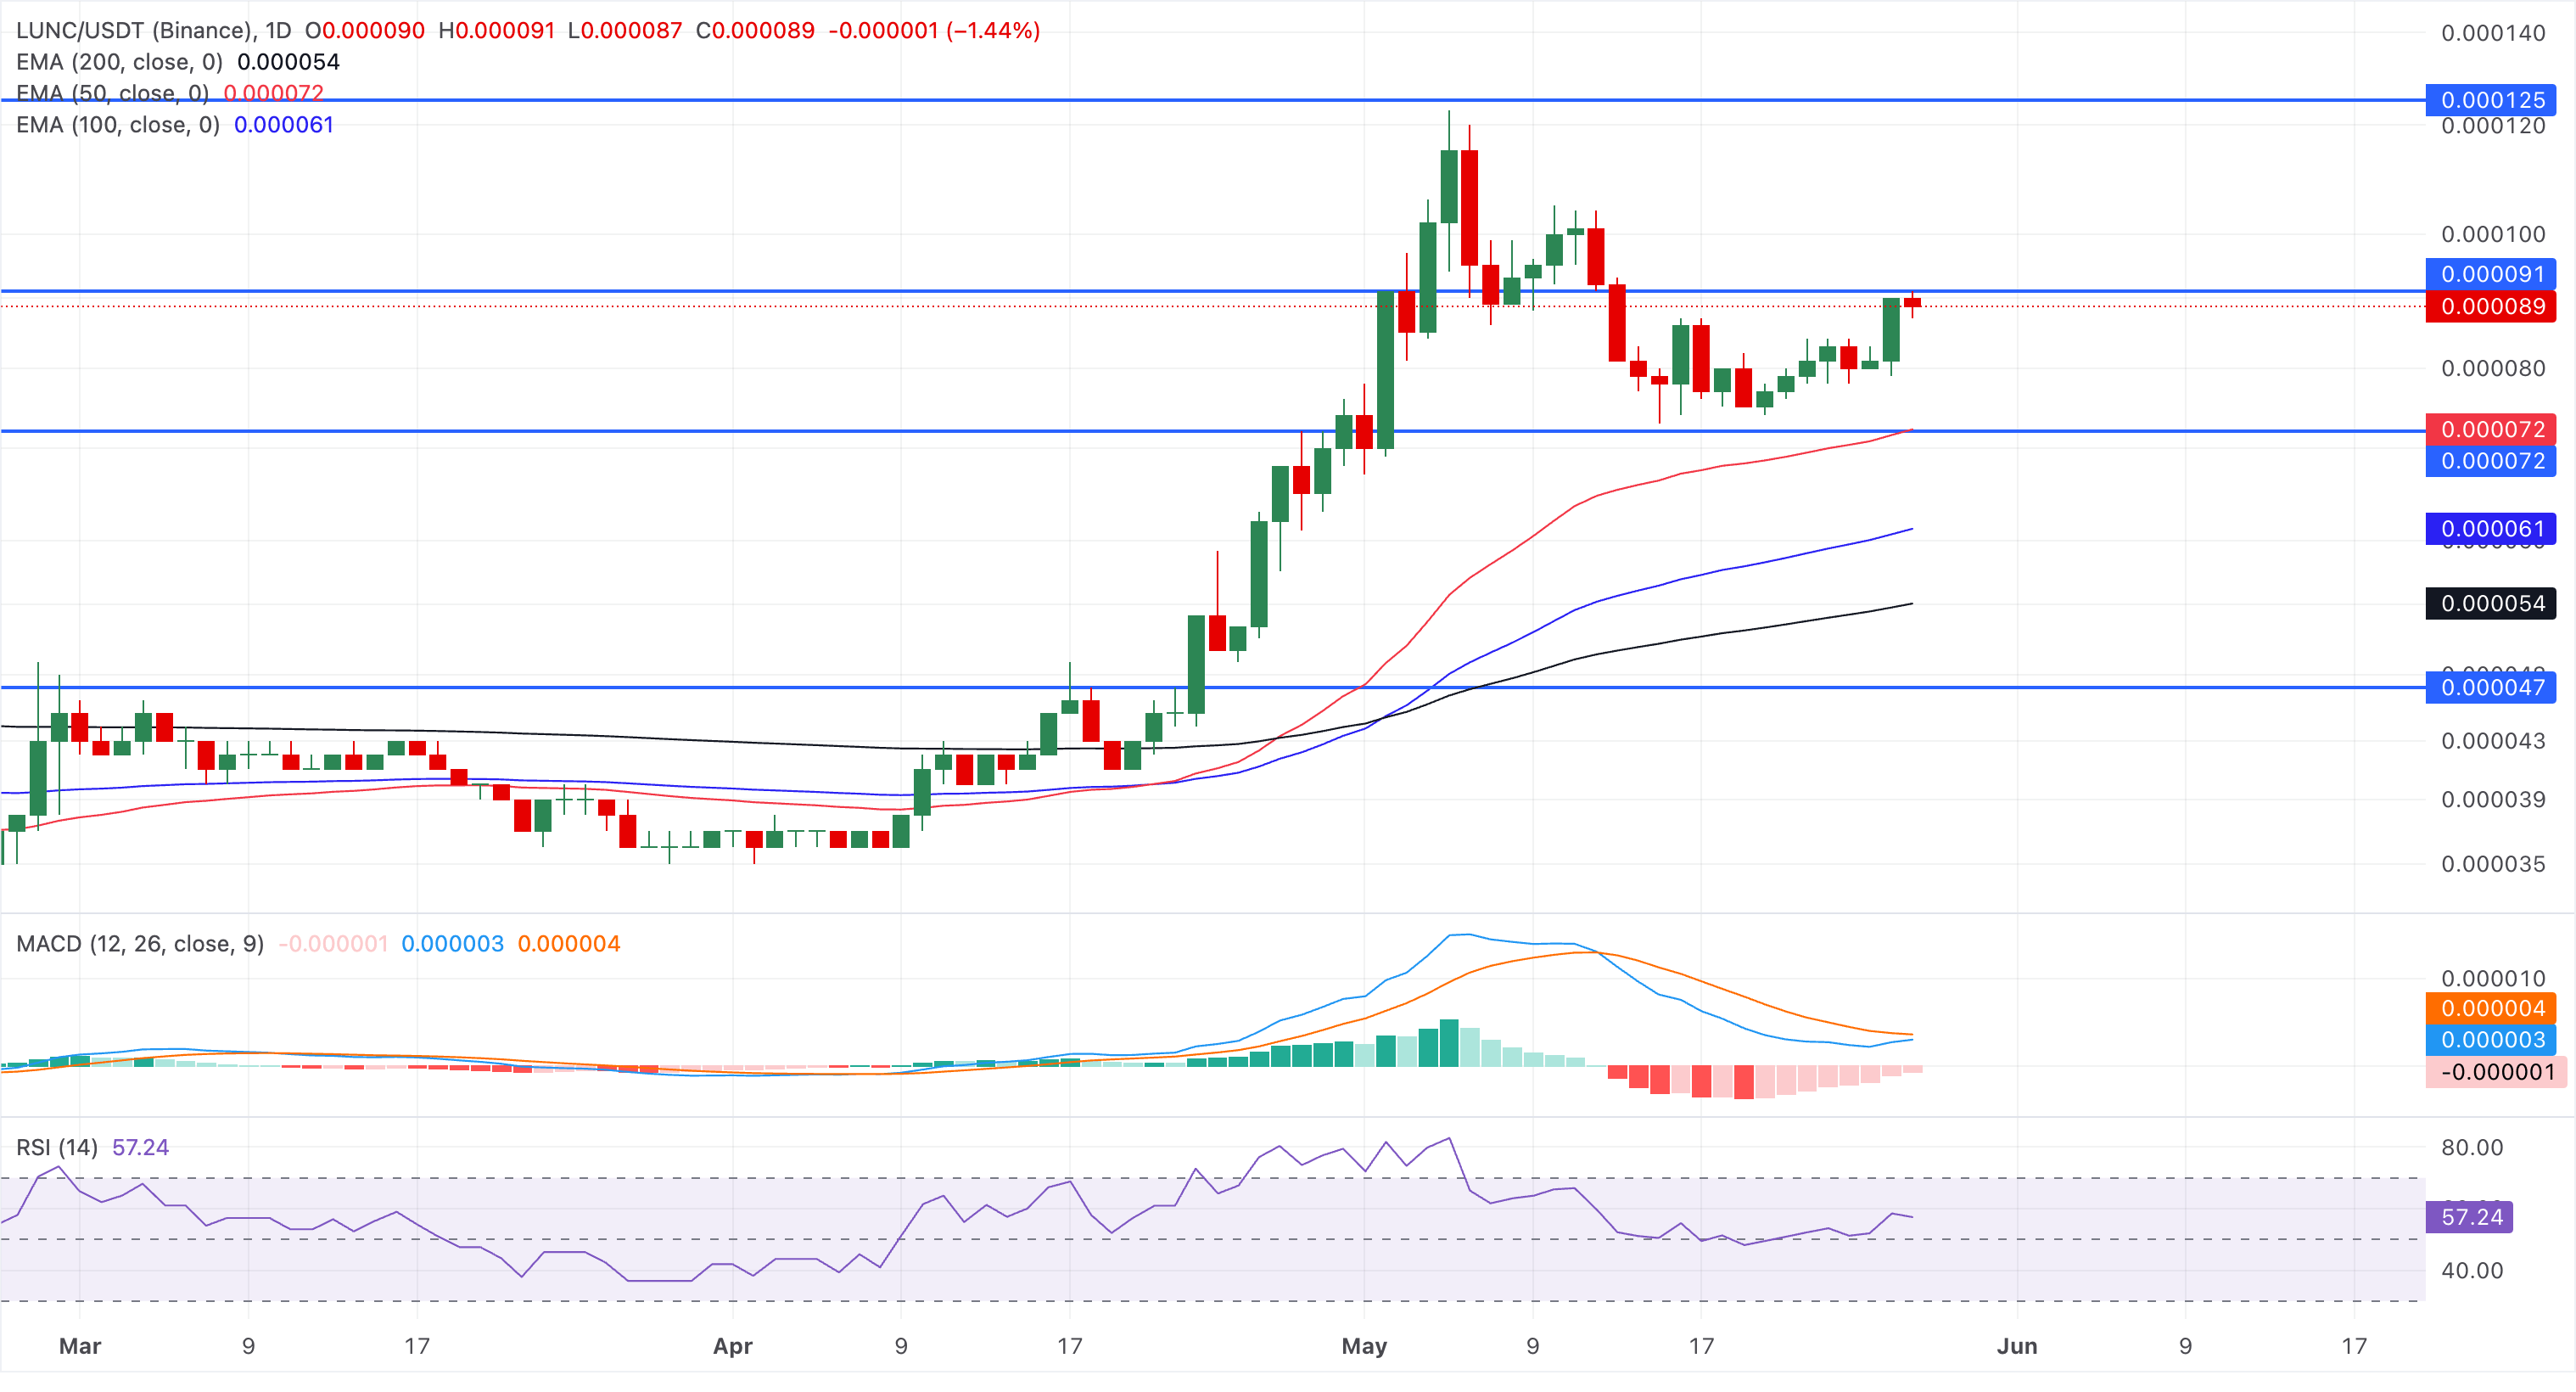
Looking down, the 50-day and 100-day EMAs at $0.000072 and $0.000061, respectively, serve as immediate support levels.
(The technical analysis of this story was written with the help of an AI tool.)
추천 기사


