


Cardano Price Forecast: ADA under pressure as whale selling, derivatives data reinforce bearish outlook
- Cardano price trades below key resistance zones, signaling a bearish near-term bias and limiting recovery attempts.
- Santiment data shows that certain ADA whale wallets are offloading tokens, increasing the selling pressure.
- Derivatives data shows mixed signals with a slight bearish tilt, capping upside potential.
Cardano (ADA) remains under pressure, trading below $0.250 on Friday as price action stays muted below key resistance levels. On-chain data from Santiment shows that certain whale wallets are reducing their holdings, increasing selling pressure. Derivatives market signals remain mixed with a slight bearish bias, suggesting ADA’s recovery could remain limited.
Whales decreasing exposure
Santiment’s Supply Distribution data supports a bearish outlook for Cardano, as the number of large-wallet holders (whales) is reducing exposure.
The metric indicates that whales holding between 100,000 and 1 million (red line) and 1 million and 10 million (yellow line) ADA tokens have shed 80 million tokens since April 19.
In the same period, whales holding between 10 million and 100 million tokens (blue line) have accumulated 60 million ADA. This indicates a shift in positioning among large holders: whales are reducing exposure, mid-sized whales are offloading tokens, and top-tier whales are absorbing some of the supply, often reflecting distribution at higher levels and adding to near-term downside risks for Cardano.
 [09-1777006576418-1777006576425.06.47, 24 Apr, 2026].png)
Mixed sentiment with a slight bearish tilt
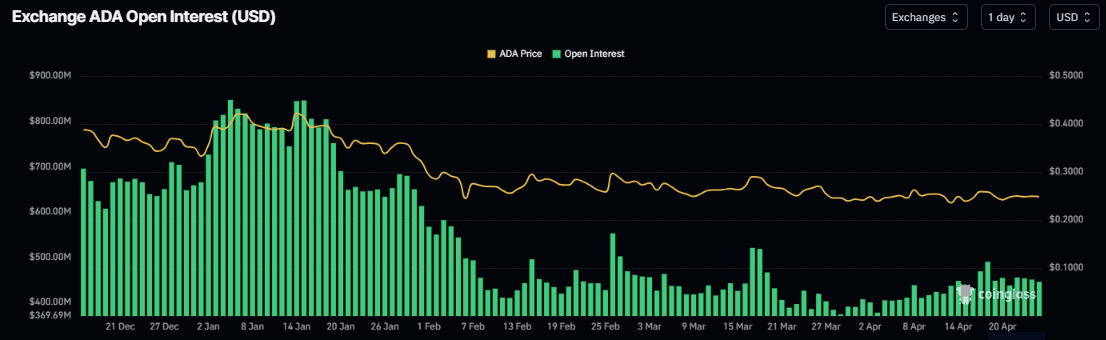
Cardano’s derivatives data shows mixed signals with a slight bearish tilt. CoinGlass’ Open Interest (OI) for ADA drops to $445 million on Friday from $490 million on April 18, and has remained silent since then. This steady drop in OI reflects waning investor participation and projects a bearish outlook.
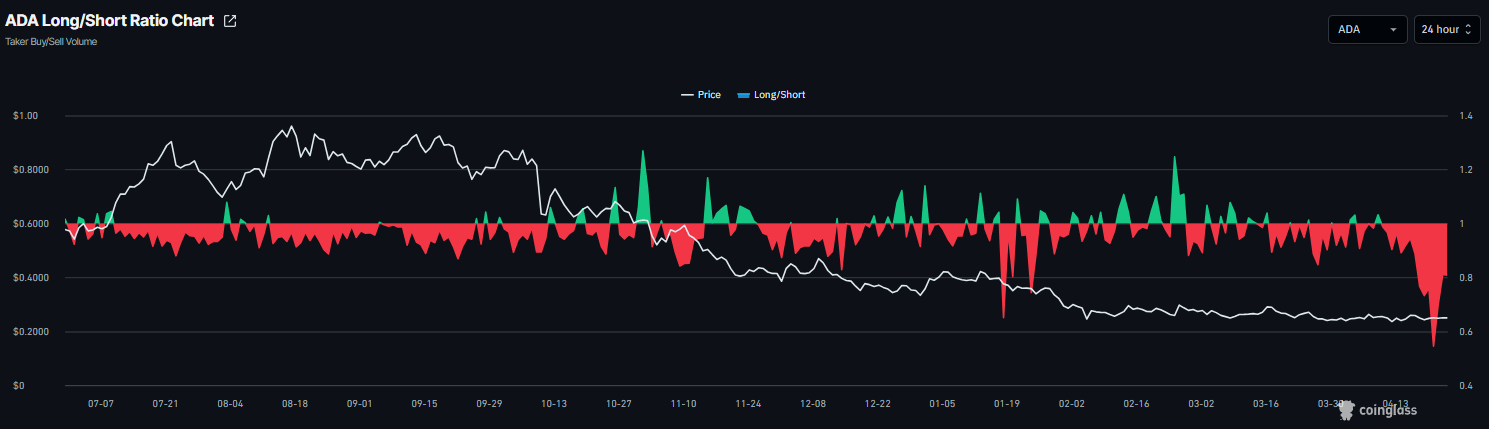
In addition, CoinGlass’ long-to-short ratio for ADA reads 0.80 on Friday, nearing the lowest level over a month. This ratio, being below one, reflects bearish sentiment in the market, as more traders are betting on the asset’s price to fall.
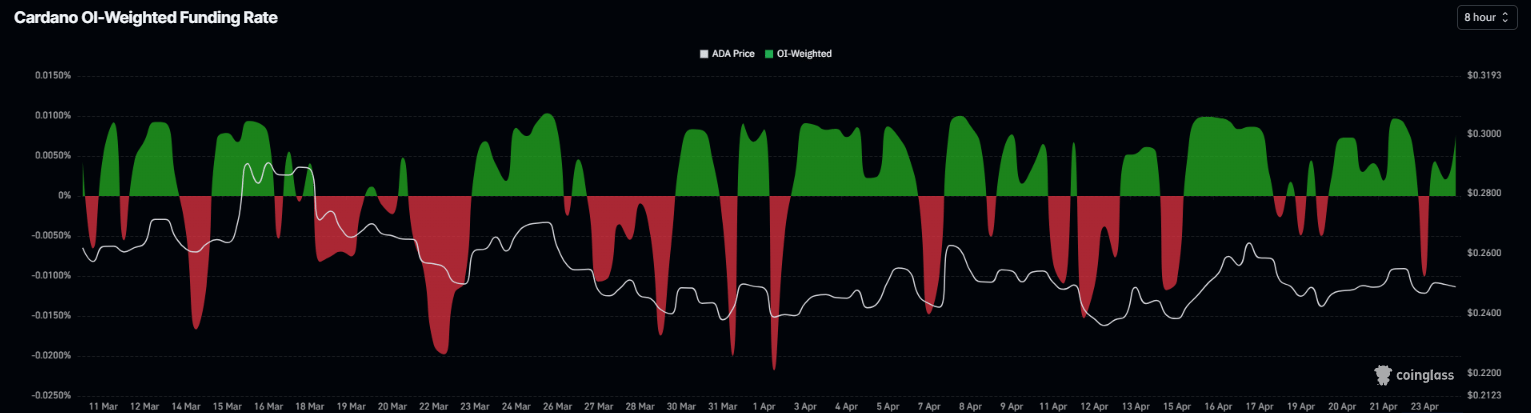
Meanwhile, the funding rates support improving sentiment. CoinGlass’ OI-Weighted Funding Rate data for Cardano flipped positive on Thursday, reading 0.0076% on Friday. This positive rate indicates that longs are paying shorts and projecting a bullish sentiment.
This combination suggests indecision among Cardano investors with a mid-bearish bias, which limits the chances of a sustained recovery.
Cardano Price Forecast: Key resistance keeps ADA capped
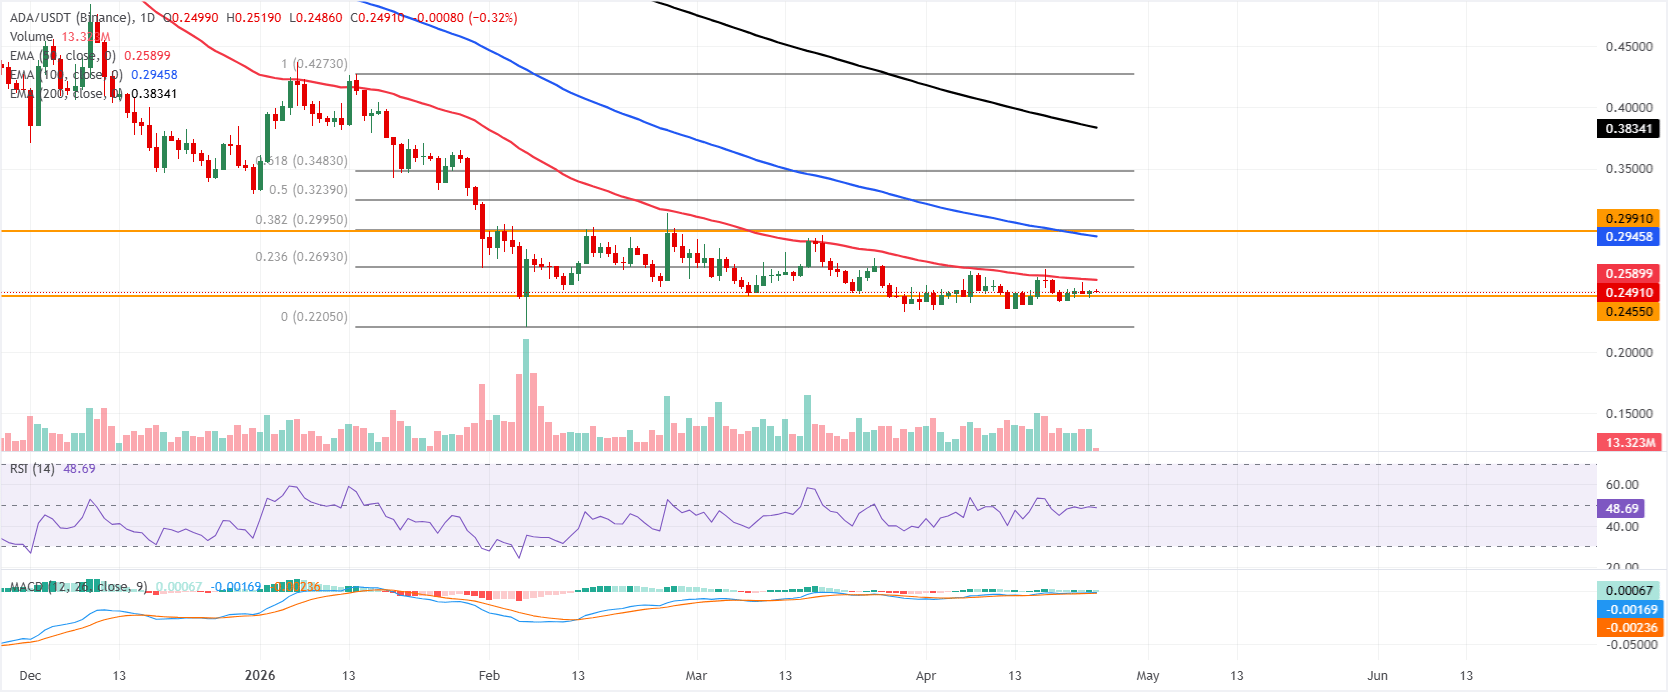
Cardano price is trading below $0.250 on Friday, holding a bearish near-term bias as price remains capped beneath a dense band of Exponential Moving Average (EMA) resistance. The 50-day Exponential Moving Average (EMA) at $0.258 is the first ceiling overhead, followed by the 23.6% Fibonacci retracement at $0.269 and the 100-day EMA at $0.294, collectively reinforcing a topside cap well below the broader resistance cluster around $0.299.
Momentum is broadly neutral, with the Relative Strength Index (RSI) on the daily chart hovering near 48 and the Moving Average Convergence Divergence (MACD) line flat and marginally above zero, suggesting a lack of decisive buying pressure while price trades below all major trend averages.
On the downside, initial support is at the horizontal level of $0.245, where a break would expose further downside toward the Fibonacci anchor region near the prior cycle low at $0.220.
On the topside, a daily close above the 50-day EMA at $0.258 would be the first sign of easing downside pressure, opening the way toward the 23.6% retracement at $0.269 and then the confluence band between the 100-day EMA at $0.294 and the $0.299 resistance cluster. Only a sustained move above the 50% retracement levels at $0.323, and ultimately toward the 200-day EMA near $0.383, would materially challenge the prevailing bearish structure.
(The technical analysis of this story was written with the help of an AI tool.)
추천 기사


