


Bitcoin Price Forecast: BTC struggles amid failed US-Iran peace talks, hawkish Fed
- Bitcoin price nears the 50-day EMA at $70,700 on Monday, with a close below suggesting losses ahead.
- The US-Iran peace talks fail to reach a deal, and Trump orders the US Navy to blockade the Strait of Hormuz, jeopardizing a fragile two-week ceasefire.
- US inflation rises at its fastest monthly pace in four years, bolstering expectations of a hawkish Fed and potential rate hikes.
Bitcoin (BTC) is trading under pressure at the start of the week, near the key support zone at $70,700 on Monday. A breakout below this level would signal a correction ahead. Risk sentiment has been dampened in crypto markets, with the US-Iran ceasefire failing to reach an agreement and US inflation accelerating sharply, which raises concerns of further downside for the Crypto King.
US-Iran talks fail to reach an agreement
The US and Iran concluded their round of talks in Pakistan without reaching an agreement to end the war. US Vice President JD Vance said he made a final, best offer, but Iran declined to accept it, leading to a stalemate. Iranian state media said that excessive demands sank the possibility of a deal.
Meanwhile, on Sunday, US President Donald Trump said the US Navy would start blockading the Strait of Hormuz, jeopardizing a fragile two-week ceasefire.
Added to this, the continued Israeli strikes in Lebanon raise the risk of a renewed escalation of tensions in the Middle East, which dampens the risk appetite.
US equity futures and Asian markets have opened the week on a negative note, while Crude Oil prices trade higher. Meanwhile, Bitcoin is struggling around the $70,700 as of Monday.
Macroeconomic headwinds cap Bitcoin upside
On the macroeconomic side, the US Consumer Price Index (CPI) data released on Friday by the US Bureau of Labor Statistics showed that US inflation rose at its fastest monthly pace in four years.
The headline US CPI rose 0.9% in March from 0.3% the previous month, the highest monthly gain since June 2022. The yearly figure picked up to 3.3% from 2.4% in February, marking the highest since May 2024. This led investors to abandon bets on Federal Reserve (Fed) interest rate cuts this year, bolstering expectations of a hawkish outlook and potential rate hikes. BTC and the broader crypto market generally struggle in high-interest-rate environments because higher borrowing costs reduce liquidity and push markets towards safer, yield-bearing assets, which cap Bitcoin's upside move.
Institutional demand shows signs of optimism
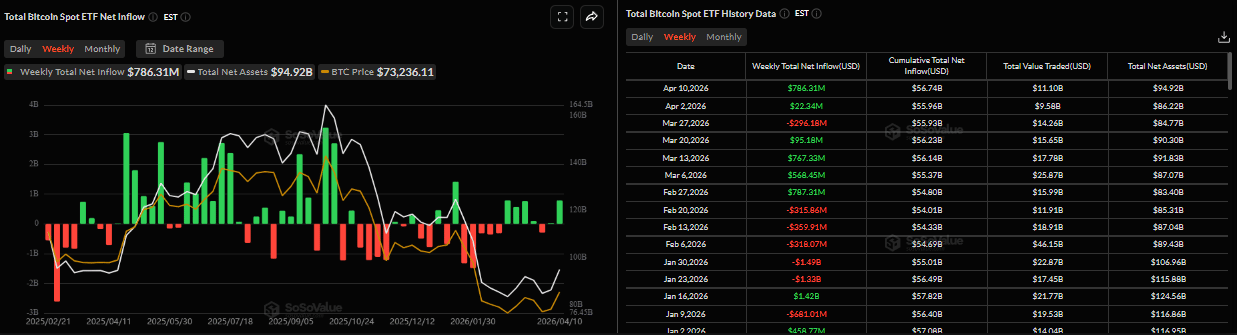
Institutional demand for Bitcoin supported its price last week. SoSoValue data shows that spot Bitcoin Exchange Traded Funds (ETFs) recorded inflows of $786.31 million last week, following a mild inflow the previous week. If these inflows continue and intensify this week, BTC could see an upward move.
Bitcoin Price Forecast: BTC nears key support
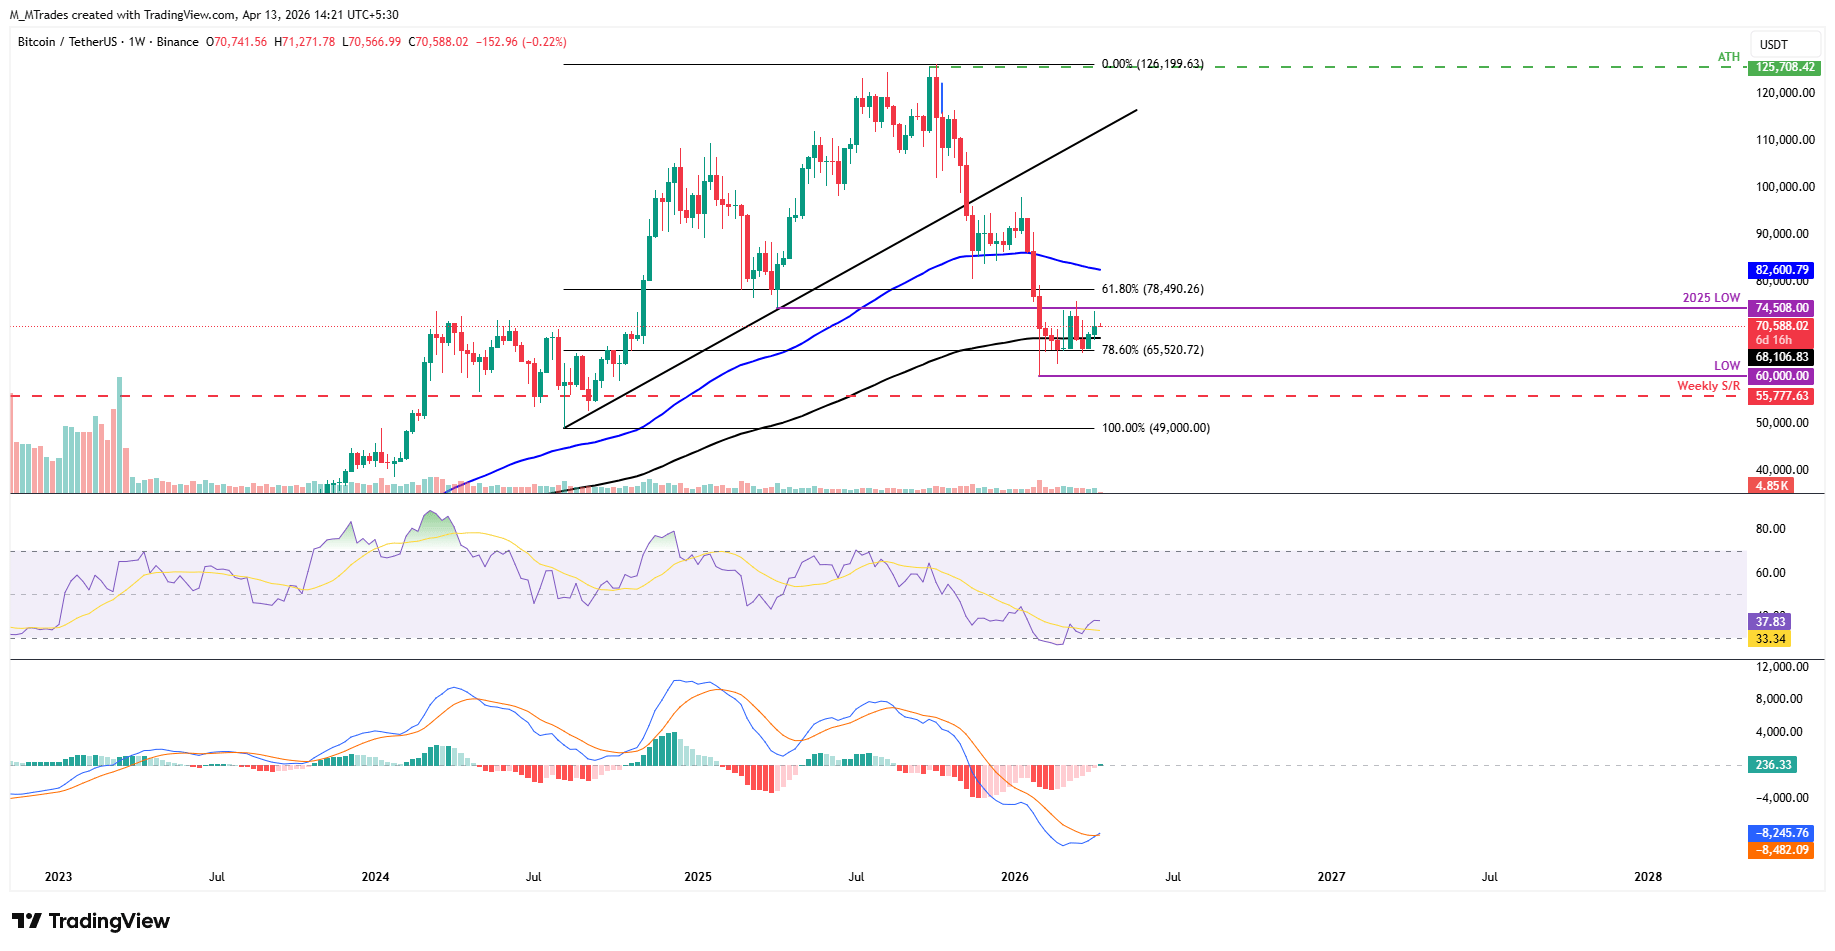
As seen on the weekly chart below, the largest cryptocurrency by market capitalization found support around this broken 200-Week Exponential Moving Average (EMA) at $68,106 and rose 2.47% last week. As of writing on Monday, BTC is trading at $70,588.
If BTC continues its upward move, it could extend the rally toward the 2025 yearly low of $74,508.
The Relative Strength Index (RSI) reads 37 on the weekly chart, above the oversold territory, pointing upward toward the neutral level of 50, indicating fading bearish momentum. The Moving Average Convergence Divergence (MACD) indicator on the same chart shows a bullish crossover and a positive histogram, supporting a bullish thesis.
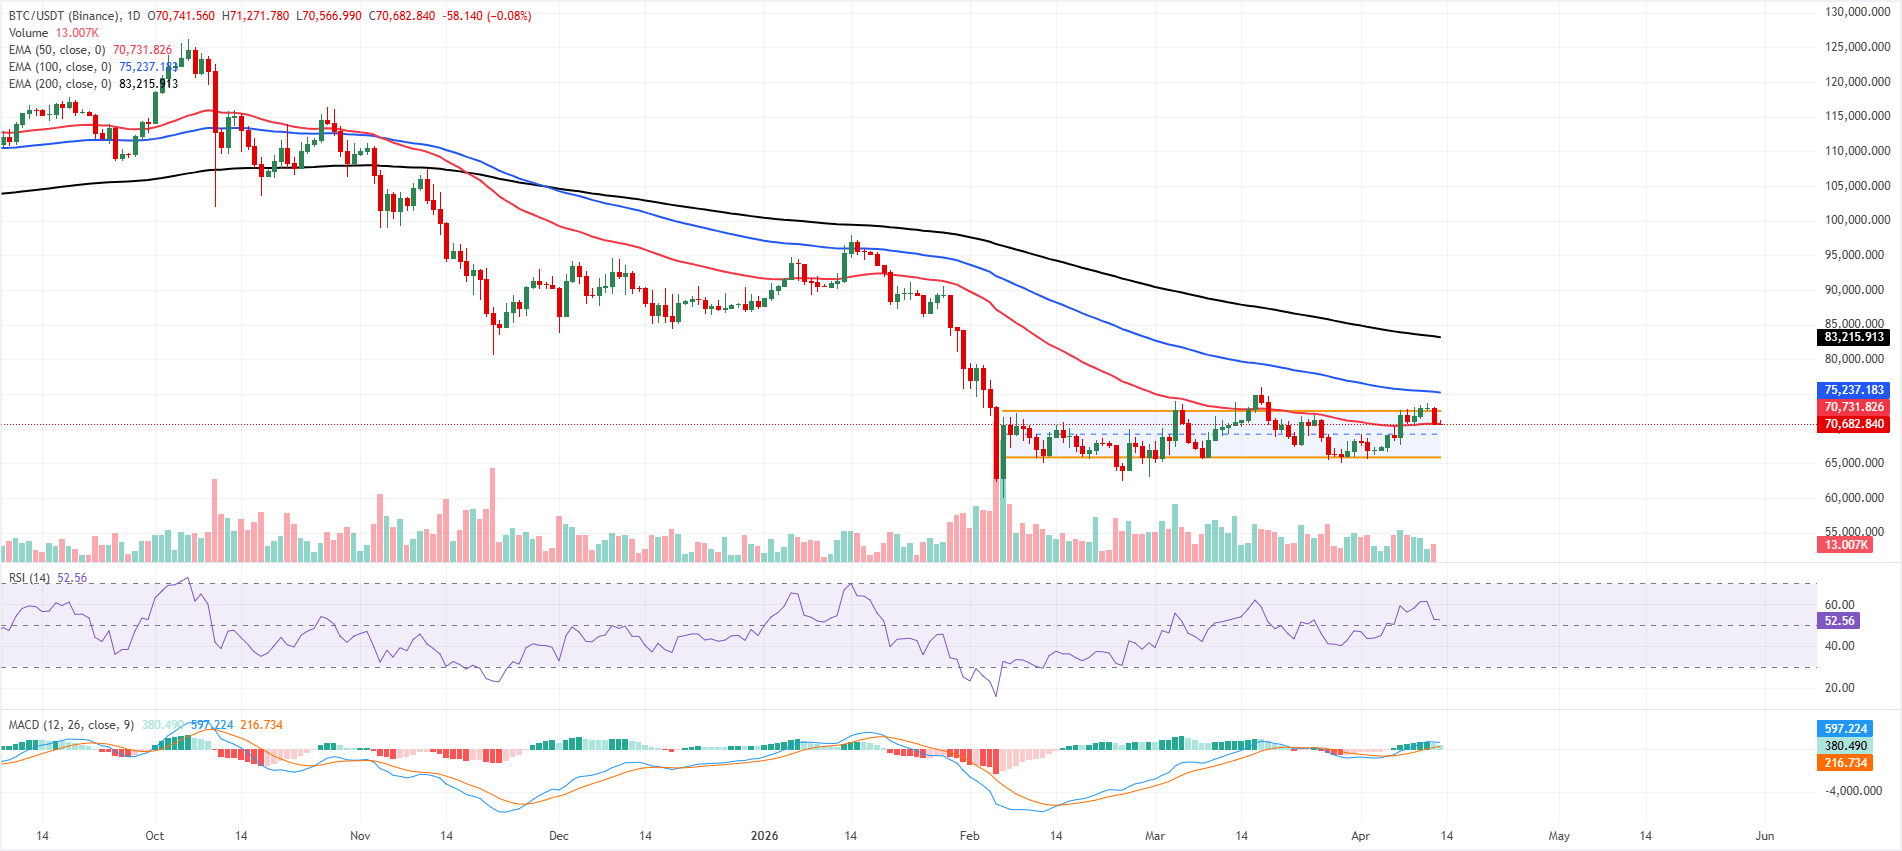
On the daily chart, BTC keeps a capped near-term tone as price holds beneath a dense layer of exponential moving average resistance. The price hovers near the 50-day EMA at $70,731 while remaining below the 100-day EMA near $75,237 and the 200-day EMA around $83,216, reinforcing the broader bearish structure.
Momentum is stabilizing, as the RSI on the daily chart hovers slightly above 50 and the MACD remains positive above the zero line, hinting that sellers are losing some control but still dominating while these averages remain unreclaimed.
On the topside, immediate resistance is at the 50-day EMA around $70,731. A daily close above this barrier would open the way toward the upper channel boundary near $72,576, ahead of the more substantial 100-day EMA at $75,237.
On the downside, a confirmed daily close below the 50-day EMA at $70,731 would trigger a deeper loss toward the lower edge of the channel around $65,872.
(The technical analysis of this story was written with the help of an AI tool.)
Bitcoin, altcoins, stablecoins FAQs
Bitcoin is the largest cryptocurrency by market capitalization, a virtual currency designed to serve as money. This form of payment cannot be controlled by any one person, group, or entity, which eliminates the need for third-party participation during financial transactions.
Altcoins are any cryptocurrency apart from Bitcoin, but some also regard Ethereum as a non-altcoin because it is from these two cryptocurrencies that forking happens. If this is true, then Litecoin is the first altcoin, forked from the Bitcoin protocol and, therefore, an “improved” version of it.
Stablecoins are cryptocurrencies designed to have a stable price, with their value backed by a reserve of the asset it represents. To achieve this, the value of any one stablecoin is pegged to a commodity or financial instrument, such as the US Dollar (USD), with its supply regulated by an algorithm or demand. The main goal of stablecoins is to provide an on/off-ramp for investors willing to trade and invest in cryptocurrencies. Stablecoins also allow investors to store value since cryptocurrencies, in general, are subject to volatility.
Bitcoin dominance is the ratio of Bitcoin's market capitalization to the total market capitalization of all cryptocurrencies combined. It provides a clear picture of Bitcoin’s interest among investors. A high BTC dominance typically happens before and during a bull run, in which investors resort to investing in relatively stable and high market capitalization cryptocurrency like Bitcoin. A drop in BTC dominance usually means that investors are moving their capital and/or profits to altcoins in a quest for higher returns, which usually triggers an explosion of altcoin rallies.
추천 기사


