

Solana Price Forecast: Downside pressure builds amid fading momentum

출처 Fxstreet
  • Solana held above $80 on Monday after a 4% decline the previous day.
  • SOL-focused ETFs recorded over $11 million in inflows on Friday, limiting the weekly outflow to under $6 million.
  • Solana futures Open Interest is waning as traders' sentiment remains risk-averse.

Solana (SOL) is trading under pressure at around $80 at press time on Monday, after a 4% decline on Sunday, which aligned with the broader cryptocurrency market correction. Solana remains on a downside trajectory after reversing from an overhead trendline, while institutional demand whipsaws and retail interest declines. Technically, Solana should sustain above $77 to avoid a steeper correction. 

Solana ETFs limit outflow while retail walks to the sidelines

Solana is facing mixed-to-slightly bearish reactions in the institutional and derivatives markets amid the US-Iran blockade of the Strait of Hormuz. SoSoValue data shows that the Solana Exchange Traded Funds (ETFs) recorded $11.45 million in inflows on Friday, limiting the weekly outflow to $5.62 million. This sudden inflow reinforces institutional strength in Solana but marks the third consecutive weekly outflow.
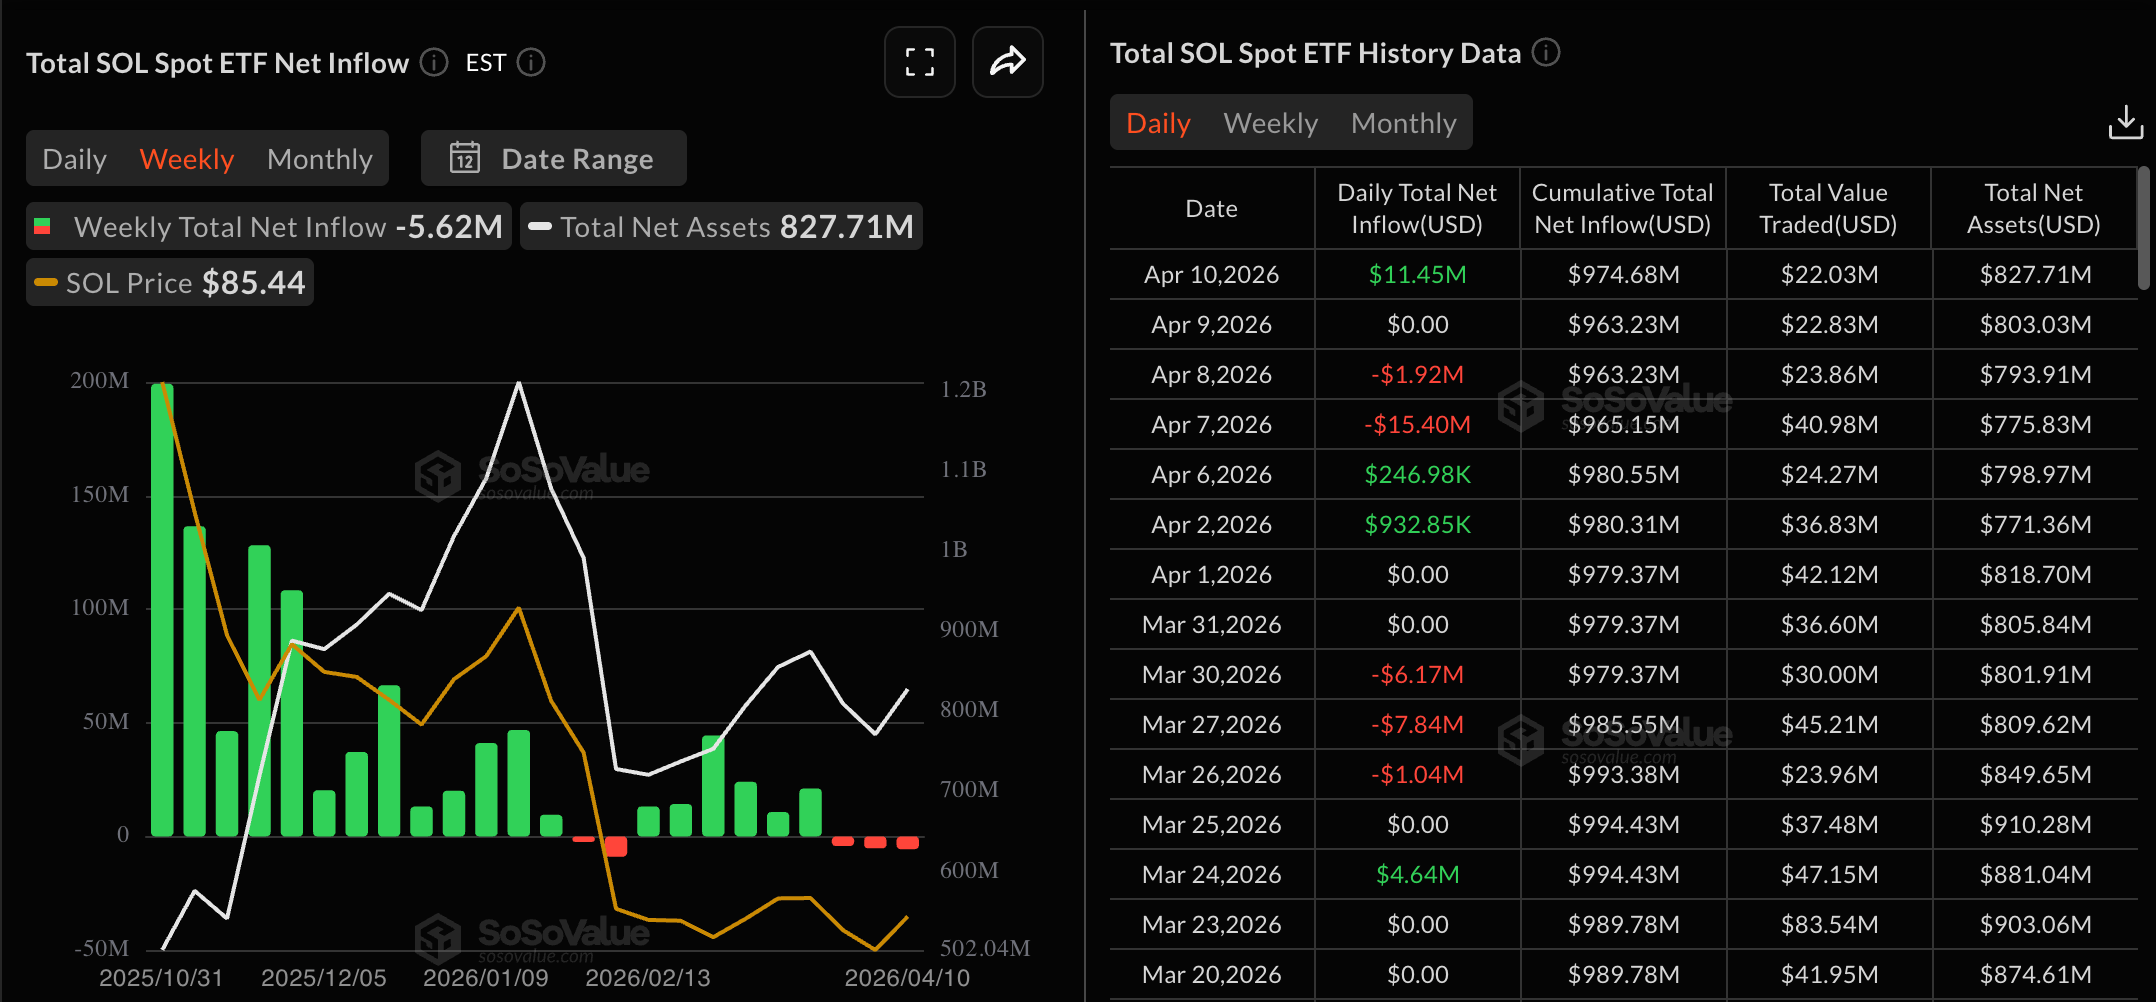
Solana ETFs data. Source: Sosovalue

Meanwhile, CoinGlass data shows a steady decline in the notional value of outstanding Solana derivatives contracts, or Solana Open Interest (OI), to $4.72 billion on Monday, down from $4.88 billion the previous day, suggesting reduced risk appetite among traders. 
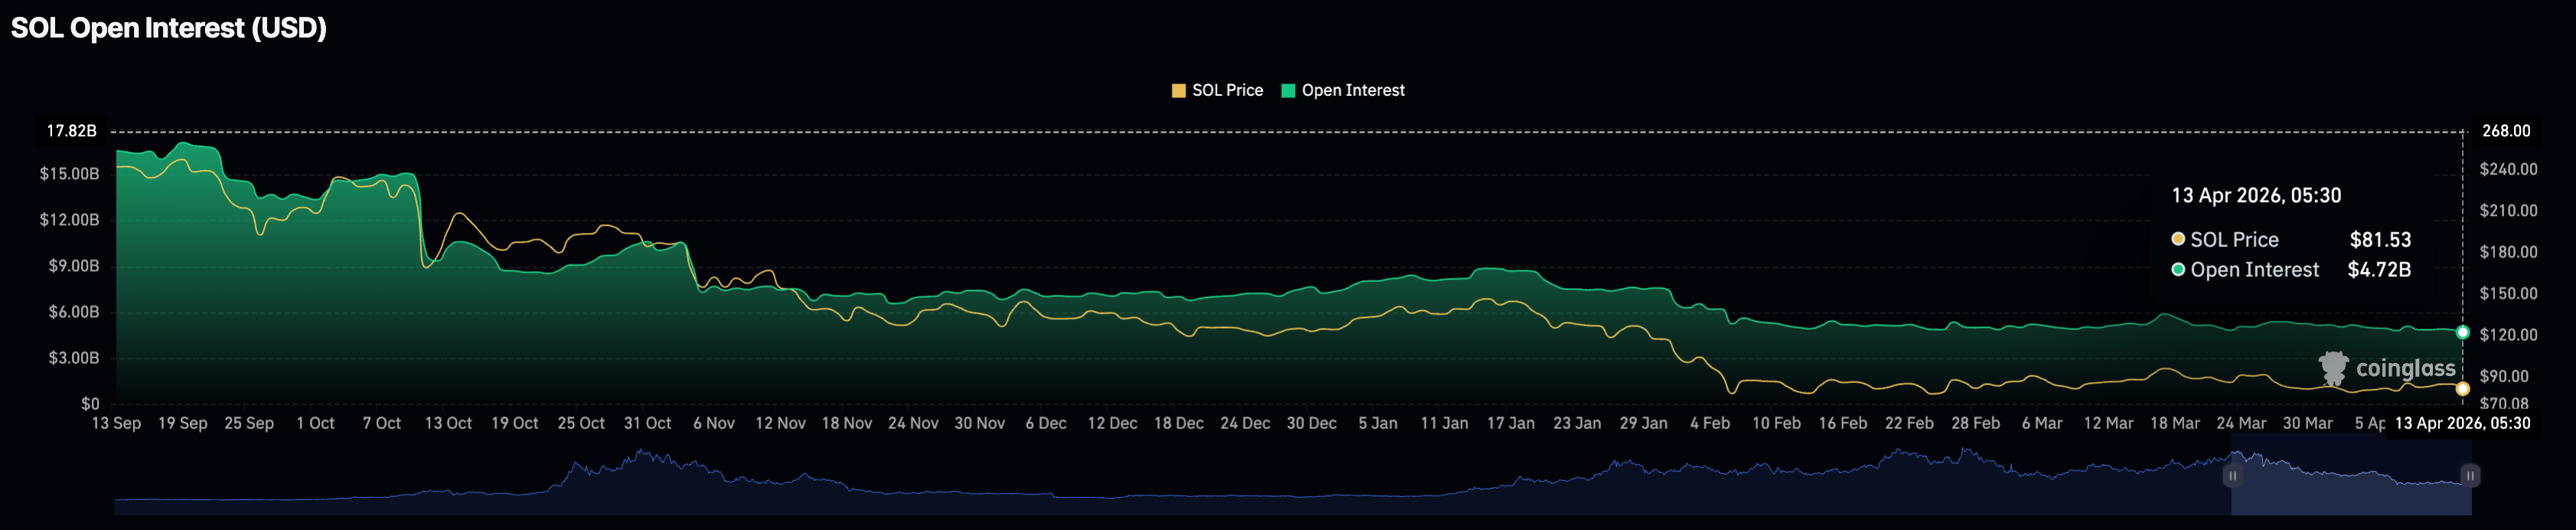
Solana Open Interest data. Source: CoinGlass

Technical outlook: Will Solana drop below $80?

Solana maintains a bearish near-term bias as price holds beneath the 50-day Exponential Moving Average (EMA) at $87.43 close to a downward resistance trendline. Meanwhile, the 100- and 200-day EMAs at $99.19 and $118.32, respectively, reinforce a broader topside cap.

Momentum is mixed, with the Relative Strength Index (RSI) hovering at 45 and the Moving Average Convergence Divergence (MACD) line below zero, hinting that downside pressure is softening but not yet reversing the overall capped structure.

The immediate support for Solana aligns with the February 5 low at $77.60, which guards the downside toward the February 6 low at $67.50.

Chart Analysis SOL/USDT (Binance)
SOL/USDT daily price chart.

On the topside, initial resistance emerges at the 50-day EMA at $87.43, where sellers could look to fade rebounds. Above that, the 100-day EMA at $99.19 and the 200-day EMA at $118.32 stand out as progressively stronger barriers.

(The technical analysis of this story was written with the help of an AI tool.)

면책 조항: 정보 제공 목적으로만 사용됩니다. 과거 성과가 미래 결과를 보장하지 않습니다.
placeholder
연준 금리 인상 악재가 선반영되었나? 금값, 4,400달러 향해 강하게 반등하며 새로운 랠리 채비TradingKey - 9월 18일 유럽 거래 세션 기준, 금 가격(XAUUSD)은 목요일의 반등세를 이어가며 오늘 장중 $4,399.75까지 강하게 상승해 심리적 마디대인 $4,400선에 바짝 다가섰다. 수요일 연방준비제도(Fed·연준)가 25bp 금리 인상을 발표한 직후, 현물 금은 $4,365 선 위에서 저점인 $4,235까지 급락했으나, 이후 2거래
저자  Mitrade팀
9 월 18 일 금요일
TradingKey - 9월 18일 유럽 거래 세션 기준, 금 가격(XAUUSD)은 목요일의 반등세를 이어가며 오늘 장중 $4,399.75까지 강하게 상승해 심리적 마디대인 $4,400선에 바짝 다가섰다. 수요일 연방준비제도(Fed·연준)가 25bp 금리 인상을 발표한 직후, 현물 금은 $4,365 선 위에서 저점인 $4,235까지 급락했으나, 이후 2거래
placeholder
삼성전자, SK하이닉스, 소프트뱅크 3% 이상 급등하며 코스피 6,800선 돌파TradingKey - 반도체·소프트뱅크·키옥시아 전반적 강세 속에 코스피 지수 2.3% 급등해 6,800선 돌파9월 18일 아시아 시간대, 한국과 일본 증시는 미국 기술주 반등에 힘입어 상승 출발 후 전반적인 오름세를 보였다. 이 중 코스피 지수는 개장 직후 약 2.3% 갭상승하며 150포인트 이상 올라 6,888선을 돌파했으며, 일시적으로 6,868.2
저자  Mitrade팀
9 월 18 일 금요일
TradingKey - 반도체·소프트뱅크·키옥시아 전반적 강세 속에 코스피 지수 2.3% 급등해 6,800선 돌파9월 18일 아시아 시간대, 한국과 일본 증시는 미국 기술주 반등에 힘입어 상승 출발 후 전반적인 오름세를 보였다. 이 중 코스피 지수는 개장 직후 약 2.3% 갭상승하며 150포인트 이상 올라 6,888선을 돌파했으며, 일시적으로 6,868.2
placeholder
삼성전자와 SK하이닉스 약세로 코스피 6,800선 상단 제한; 소프트뱅크, 닛케이 225 끌어올리며 하락세 역행TradingKey - 대형 반도체 기업들의 부진으로 코스피가 하락한 반면, 장 후반 매수세 유입으로 닛케이 지수는 상승하며 일본과 한국 증시가 혼조세로 마감했다.9월 17일 아시아 증시에서 일본과 한국 주식은 오전 중 미국 증시의 부정적 여파를 소화한 뒤 상승 출발했다. 그러나 오후 들어 차익 실현 매물이 출회되며 증시에 부담을 주었고, 특히 한국 증시에
저자  Mitrade팀
9 월 17 일 목요일
TradingKey - 대형 반도체 기업들의 부진으로 코스피가 하락한 반면, 장 후반 매수세 유입으로 닛케이 지수는 상승하며 일본과 한국 증시가 혼조세로 마감했다.9월 17일 아시아 증시에서 일본과 한국 주식은 오전 중 미국 증시의 부정적 여파를 소화한 뒤 상승 출발했다. 그러나 오후 들어 차익 실현 매물이 출회되며 증시에 부담을 주었고, 특히 한국 증시에
placeholder
WTI 선물(USOIL-F) 종목이 9월17일에 4.84% 하락했습니다. 무엇을 주의해야 할까요?WTI 선물 (USOIL-F) 종목은 9월17일 20:00(ET)에 4.84% 하락하여, 현재 가격은 $97.02이고, 최근 7일간 6.60% 하락했습니다.오늘 WTI 선물(USOIL-F) 주가 하락의 요인은 무엇인가요?미국 원유 선물 가격의 급락은 주로 타이트한 시장 심리를 일시적으로 완화한 미국 국내 재고 데이터에 기인했으며, 수일간 이어진 상승세 이후
저자  Mitrade팀
9 월 17 일 목요일
WTI 선물 (USOIL-F) 종목은 9월17일 20:00(ET)에 4.84% 하락하여, 현재 가격은 $97.02이고, 최근 7일간 6.60% 하락했습니다.오늘 WTI 선물(USOIL-F) 주가 하락의 요인은 무엇인가요?미국 원유 선물 가격의 급락은 주로 타이트한 시장 심리를 일시적으로 완화한 미국 국내 재고 데이터에 기인했으며, 수일간 이어진 상승세 이후
placeholder
비트코인 가격 전망: CLARITY 법안이 표류하고 연준 결정을 앞둔 가운데, 비트코인 가격은 계속 하락할 것인가?TradingKey - 9월 16일 유럽 거래 세션 기준, 비트코인(BTC)은 화요일 3.25% 급락한 이후 연방준비제도(연준)의 결정을 앞둔 시장의 경계감을 반영하며 7만5800달러 선에서 횡보세를 보였다.연준 금리 인상 기대가 위험 선호 심리를 더욱 위축시키면서 암호화폐 법안 표류펀더멘털 관점에서 볼 때, 비트코인 하락의 가장 큰 원인은 미국 암호화폐
저자  Mitrade팀
9 월 16 일 수요일
TradingKey - 9월 16일 유럽 거래 세션 기준, 비트코인(BTC)은 화요일 3.25% 급락한 이후 연방준비제도(연준)의 결정을 앞둔 시장의 경계감을 반영하며 7만5800달러 선에서 횡보세를 보였다.연준 금리 인상 기대가 위험 선호 심리를 더욱 위축시키면서 암호화폐 법안 표류펀더멘털 관점에서 볼 때, 비트코인 하락의 가장 큰 원인은 미국 암호화폐
goTop
quote