


Crypto Overview: Bitcoin holds at $70,000 as the US blocks the Strait of Hormuz – WLD, NEAR, TON keep steady
- Bitcoin holds steady above $70,000 and its 50-day EMA on Monday after a 3% decline on Sunday.
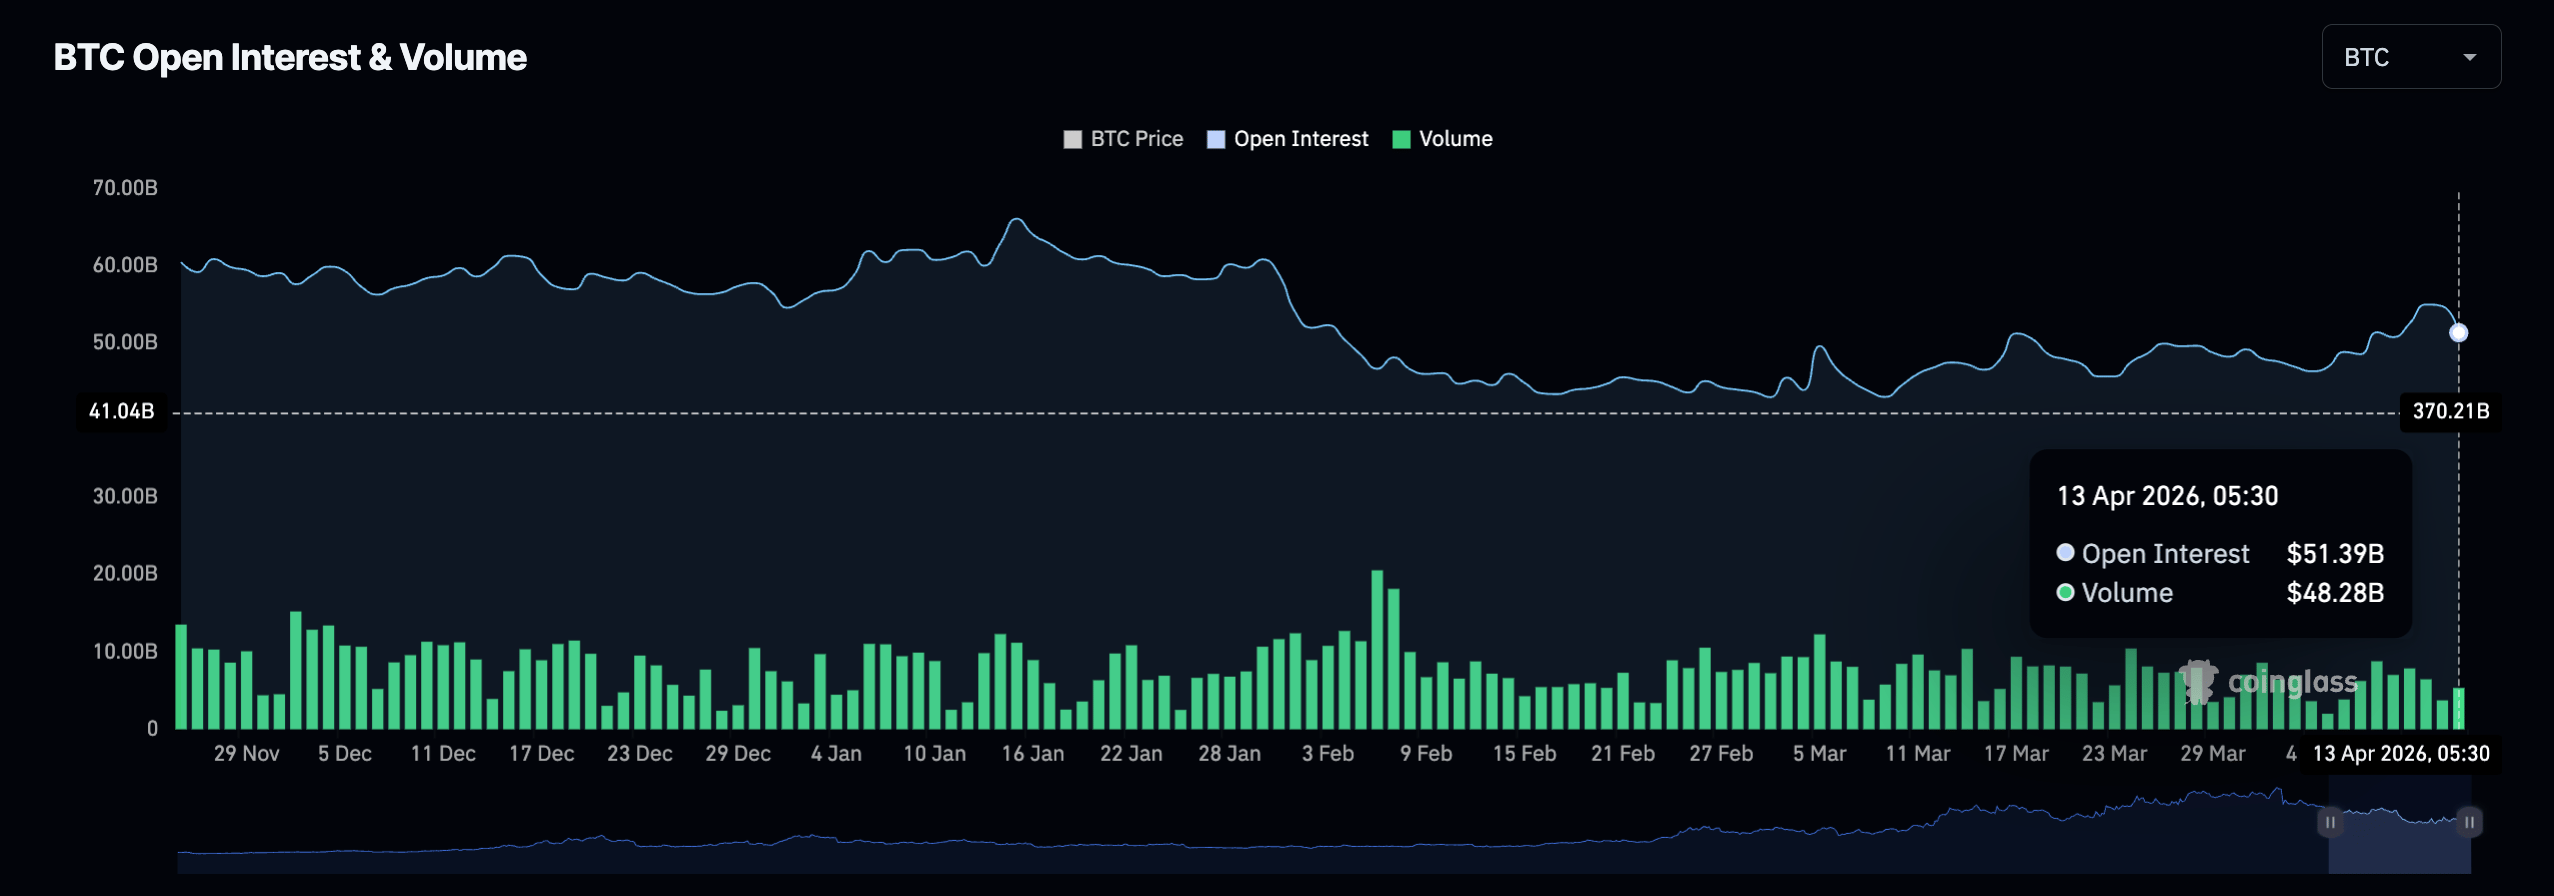
- Waning BTC futures Open Interest suggests a reduced risk-on sentiment among traders.
- Worldcoin, Near Protocol, and Toncoin are holding gains over the last 24 hours.
Bitcoin (BTC) trades above $70,000 at press time on Monday, buoyant above its 50-day Exponential Moving Average (EMA) after Sunday’s 3% decline. The blockade of all maritime traffic entering and exiting Iranian ports on Monday, 10:00 AM ET, by the US forces, has overshadowed last week’s ceasefire-driven optimism.
Bitcoin futures Open Interest fell on Monday, suggesting reduced risk appetite in the leverage market amid volatile broader market conditions. Meanwhile, Worldcoin (WLD), Near Protocol (NEAR), and Toncoin (TON) are leading gains over the last 24 hours.
The US blockade is weighing down on Bitcoin
US President Donald Trump announced retaliation by blocking the Strait of Hormuz as the US-Iran ceasefire talks failed to reach a conclusion. Brent Oil prices have surged to $98 on Monday as the war in the Middle East turns into a stand-off.
Bitcoin’s 3% decline on Sunday, which aligned with the announcement, reflected downside pressure in the cryptocurrency market. According to CoinGlass data, Bitcoin futures Open Interest (OI) fell to $51.39 billion on Monday, down from $54.82 billion the previous day.
Will Bitcoin hold above $70,000?
Bitcoin extends gains above $71,000 at press time on Monday, bouncing off its 50-day EMA support at $70,753. The broader structure remains corrective as Bitcoin sits below the 100- and 200-day EMAs and a descending trendline connecting the October 6 and January 14 highs.
A daily close above this trendline at $73,000 could extend the recovery to the 23.6% Fibonacci retracement of the $126,200 to $60,000 downswing at $75,623.
The Relative Strength Index (RSI) at 54 suggests modest positive momentum, and the Moving Average Convergence Divergence (MACD) remains in positive territory, suggesting downside pressure is softening rather than decisively reversing.
On the downside, initial support is provided by the 50-day EMA at $70,753; a break below this level would expose a deeper pullback toward the structural anchor of the Fibonacci sequence around $60,000.
Crypto Gainers: Worldcoin, Near Protocol, and Toncoin lead gains
Worldcoin is holding in a broadly bearish configuration as it remains under 50-, 100-, and 200-day EMAs within a broader descending wedge pattern.
The declining trendline near the 50-day EMA at $0.3259 acts as the initial barrier to recovery, while the 100-day EMA near $0.4048 sits higher in line with the 38.2% Fibonacci retracement level at $0.3974, measured from the $0.6539 to $0.2389 decline. Momentum shows a mildly constructive tone from the RSI at 51 and a positive MACD reading with expanding histogram bars.
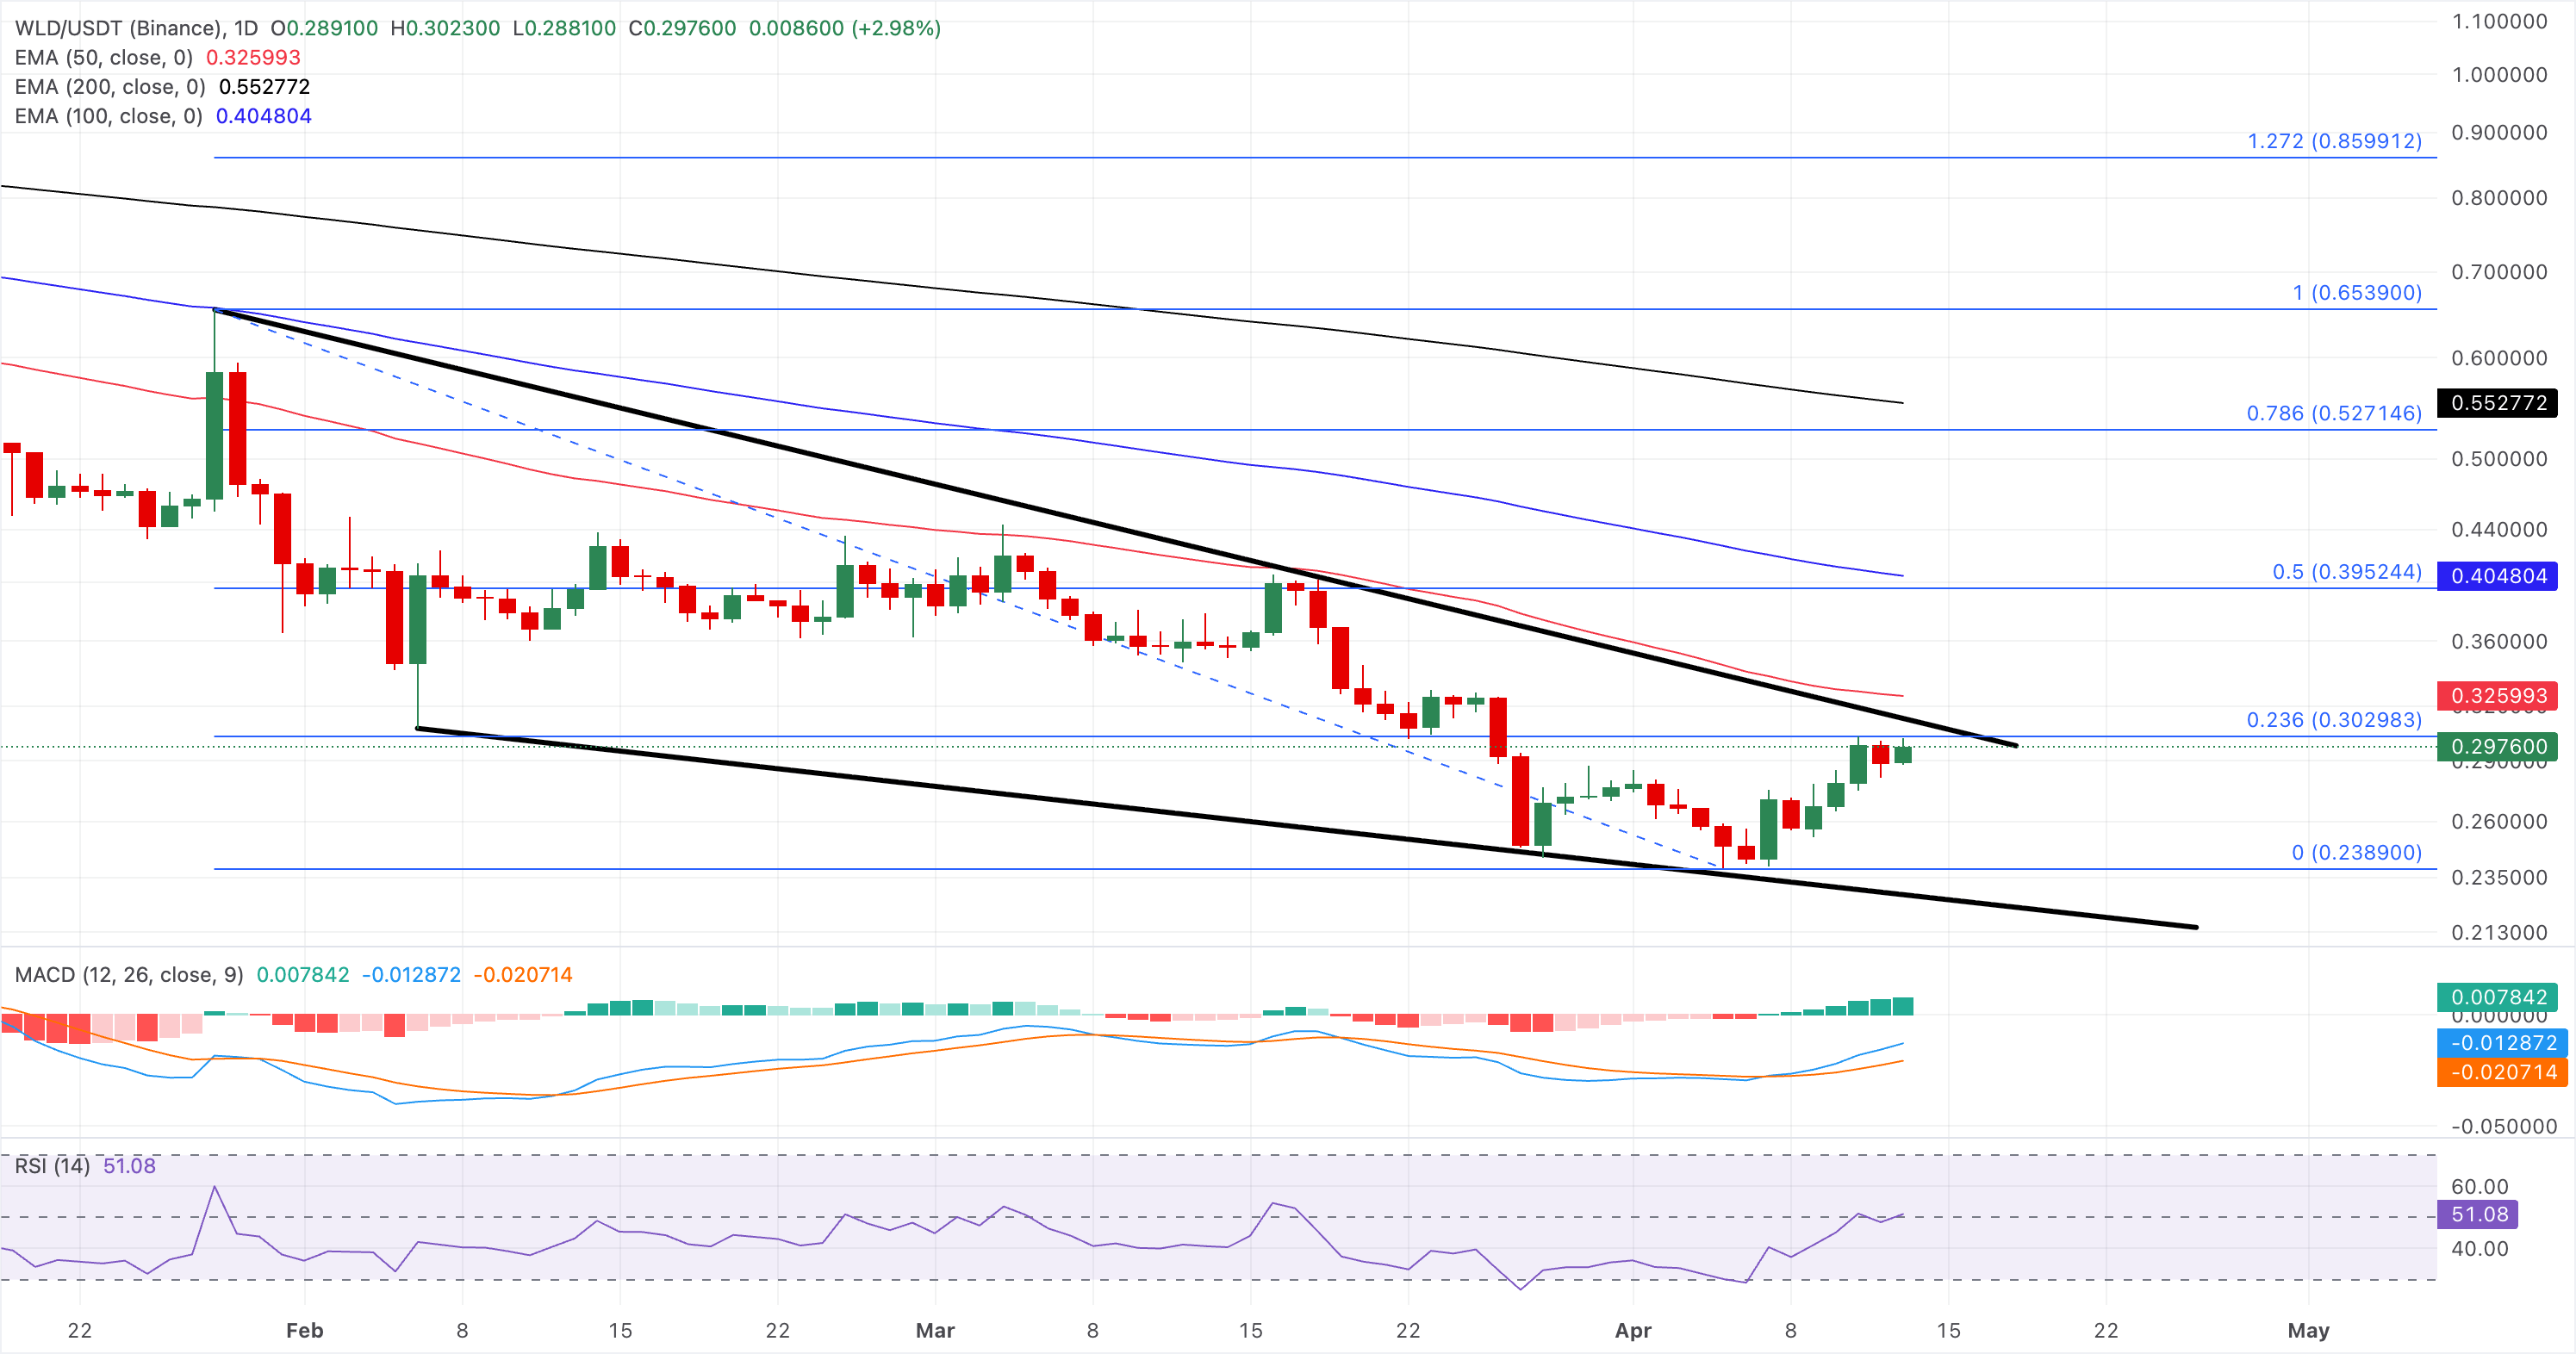
On the downside, the main structural floor lies at the Fibonacci anchor at $0.2389, where buyers are expected to show up again if the pair resumes its decline.
Meanwhile, Near Protocol keeps a constructive short-term bias as price holds above the 50-day and 100-day EMAs at $1.2813 and $1.3748, respectively, and has already reclaimed the former downtrend break around $1.3470.
On the topside, initial resistance emerges at the 61.8% Fibonacci retracement of the broader decline from $1.8940 to $0.8410 at $1.4918, ahead of the more distant 200-day EMA around $1.6257, which defines a key medium-term barrier.
The RSI at 61 leans bullish without yet signaling overbought conditions, while the MACD histogram stays mildly positive, suggesting that upward momentum is present but not explosive.
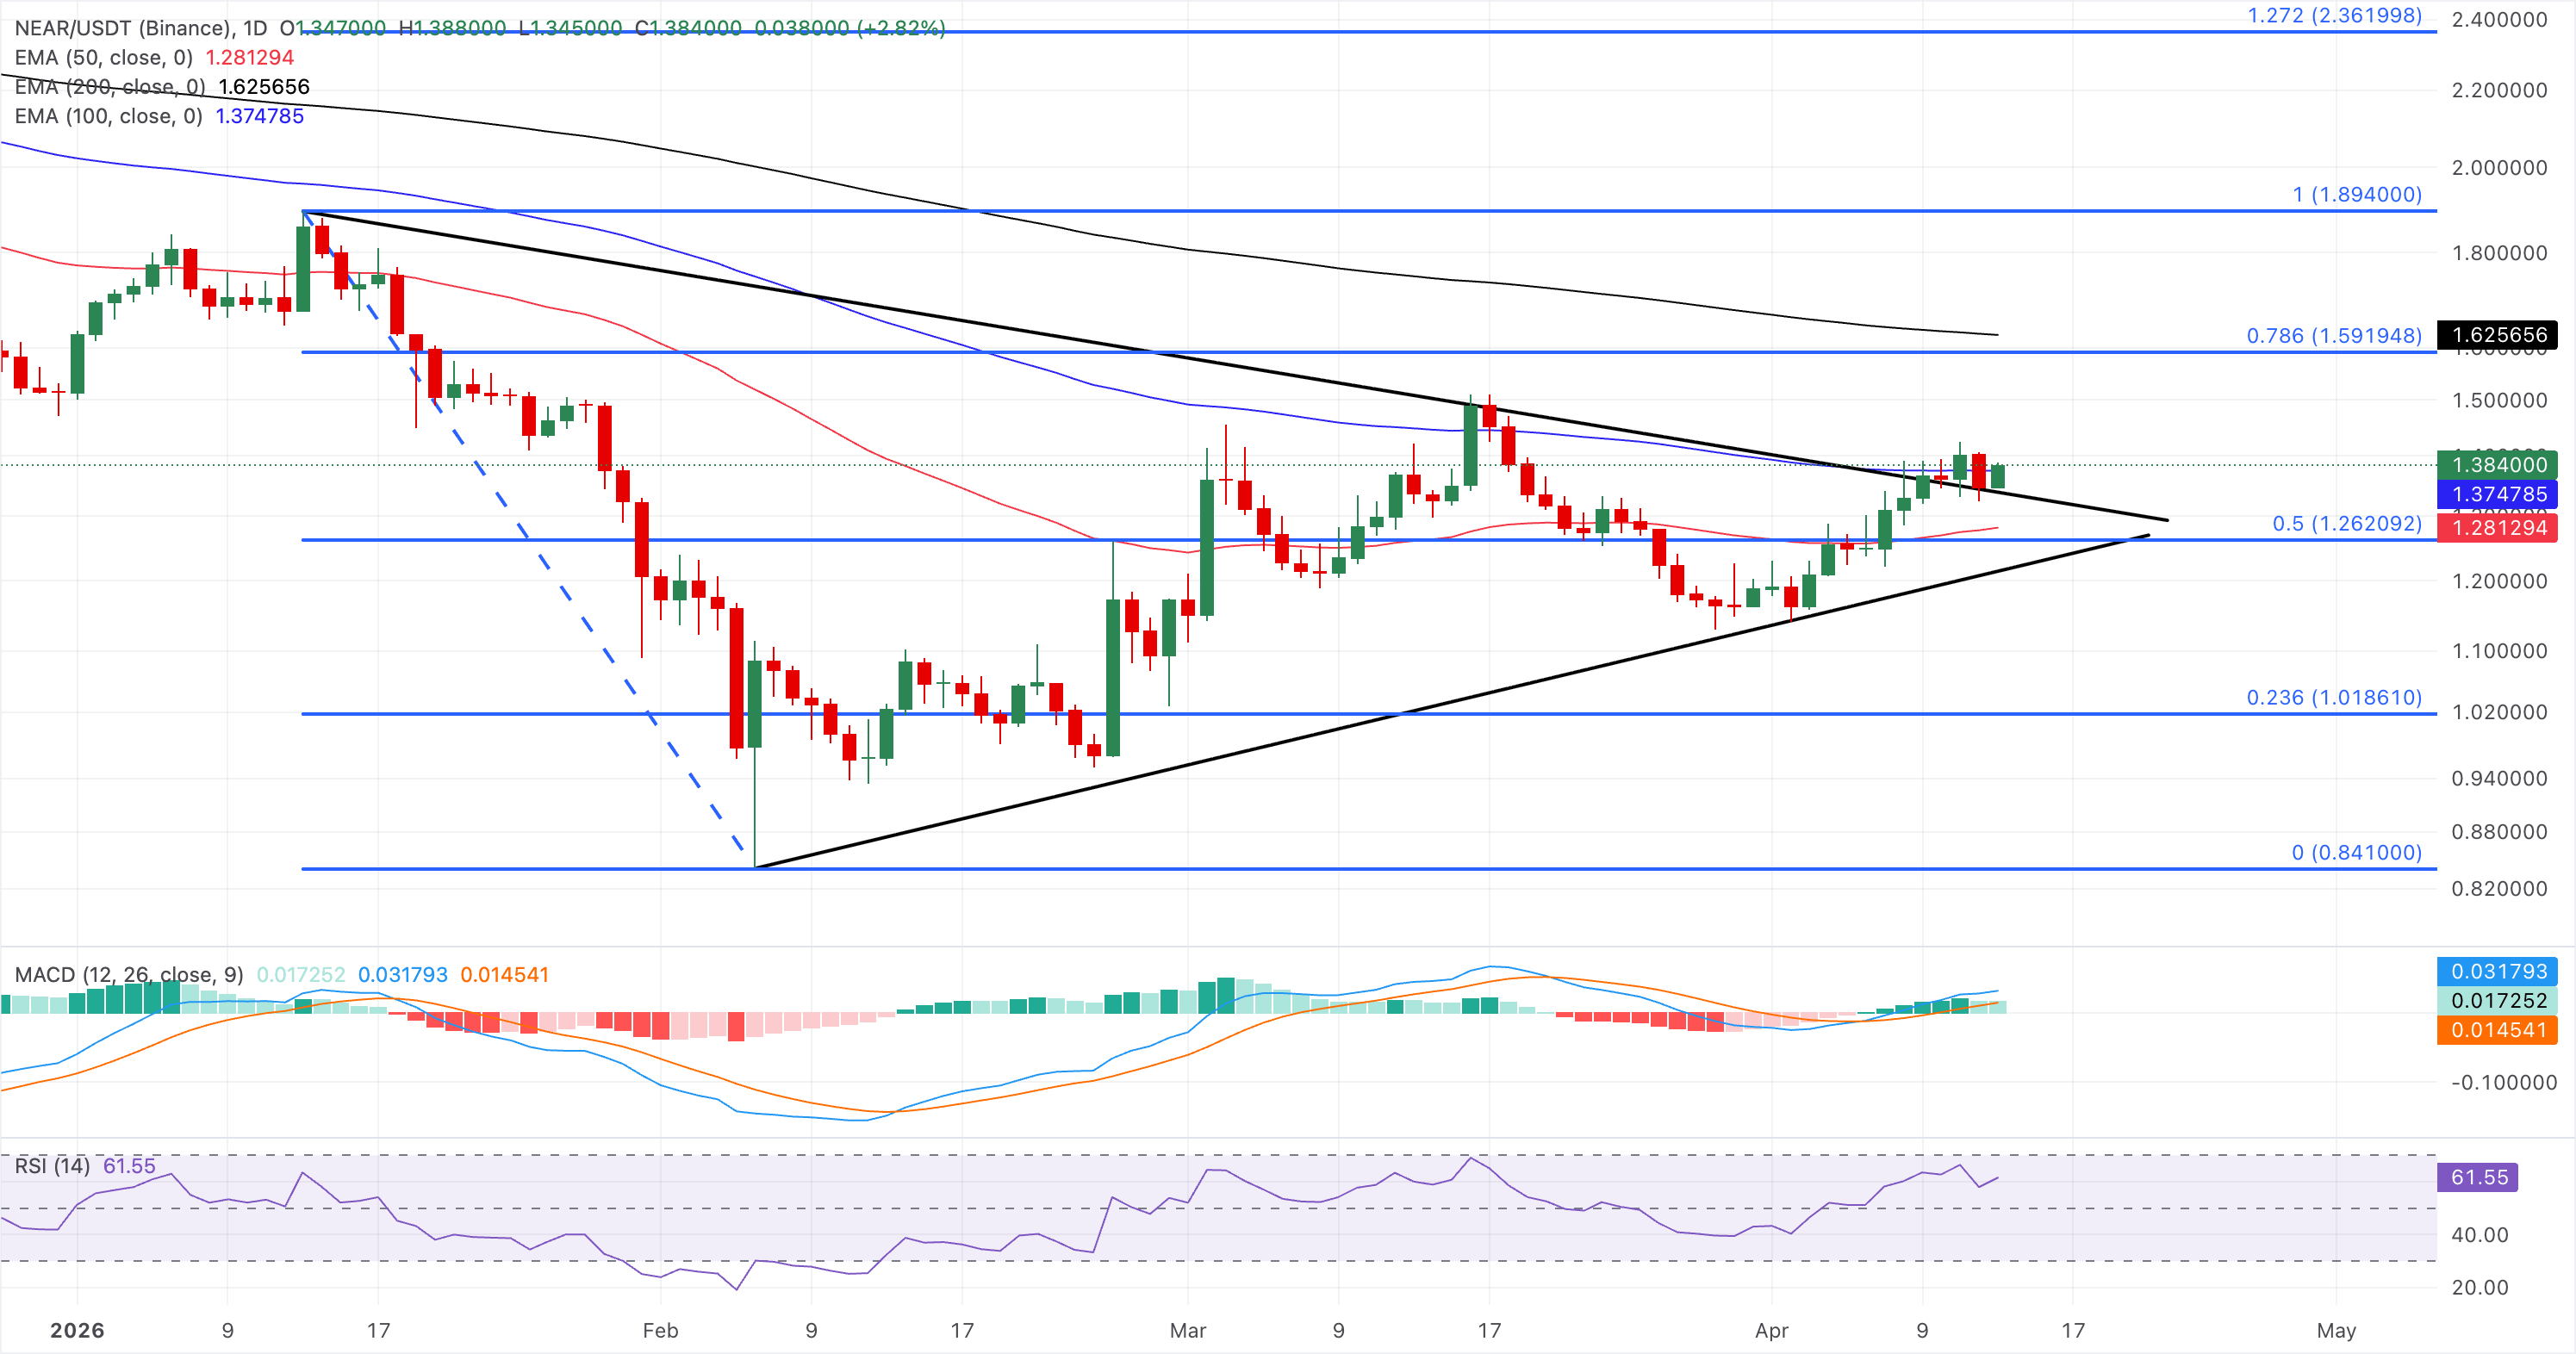
On the downside, immediate support is seen at the 50-day EMA at $1.2812, close to the 50% Fibonacci retracement at $1.3675.
Toncoin extends its rebound above the 100-day EMA at $1.4281, while testing the 50% retracement at $1.4804, maintaining a constructive near-term bias. A decisive close above this level could test the 61.8% retracement near $1.6345.
Momentum tools back this bullish stance: the RSI is near 72, in overbought territory, and the MACD is firmly positive, with an expanding histogram, suggesting buyers retain control despite stretched conditions.
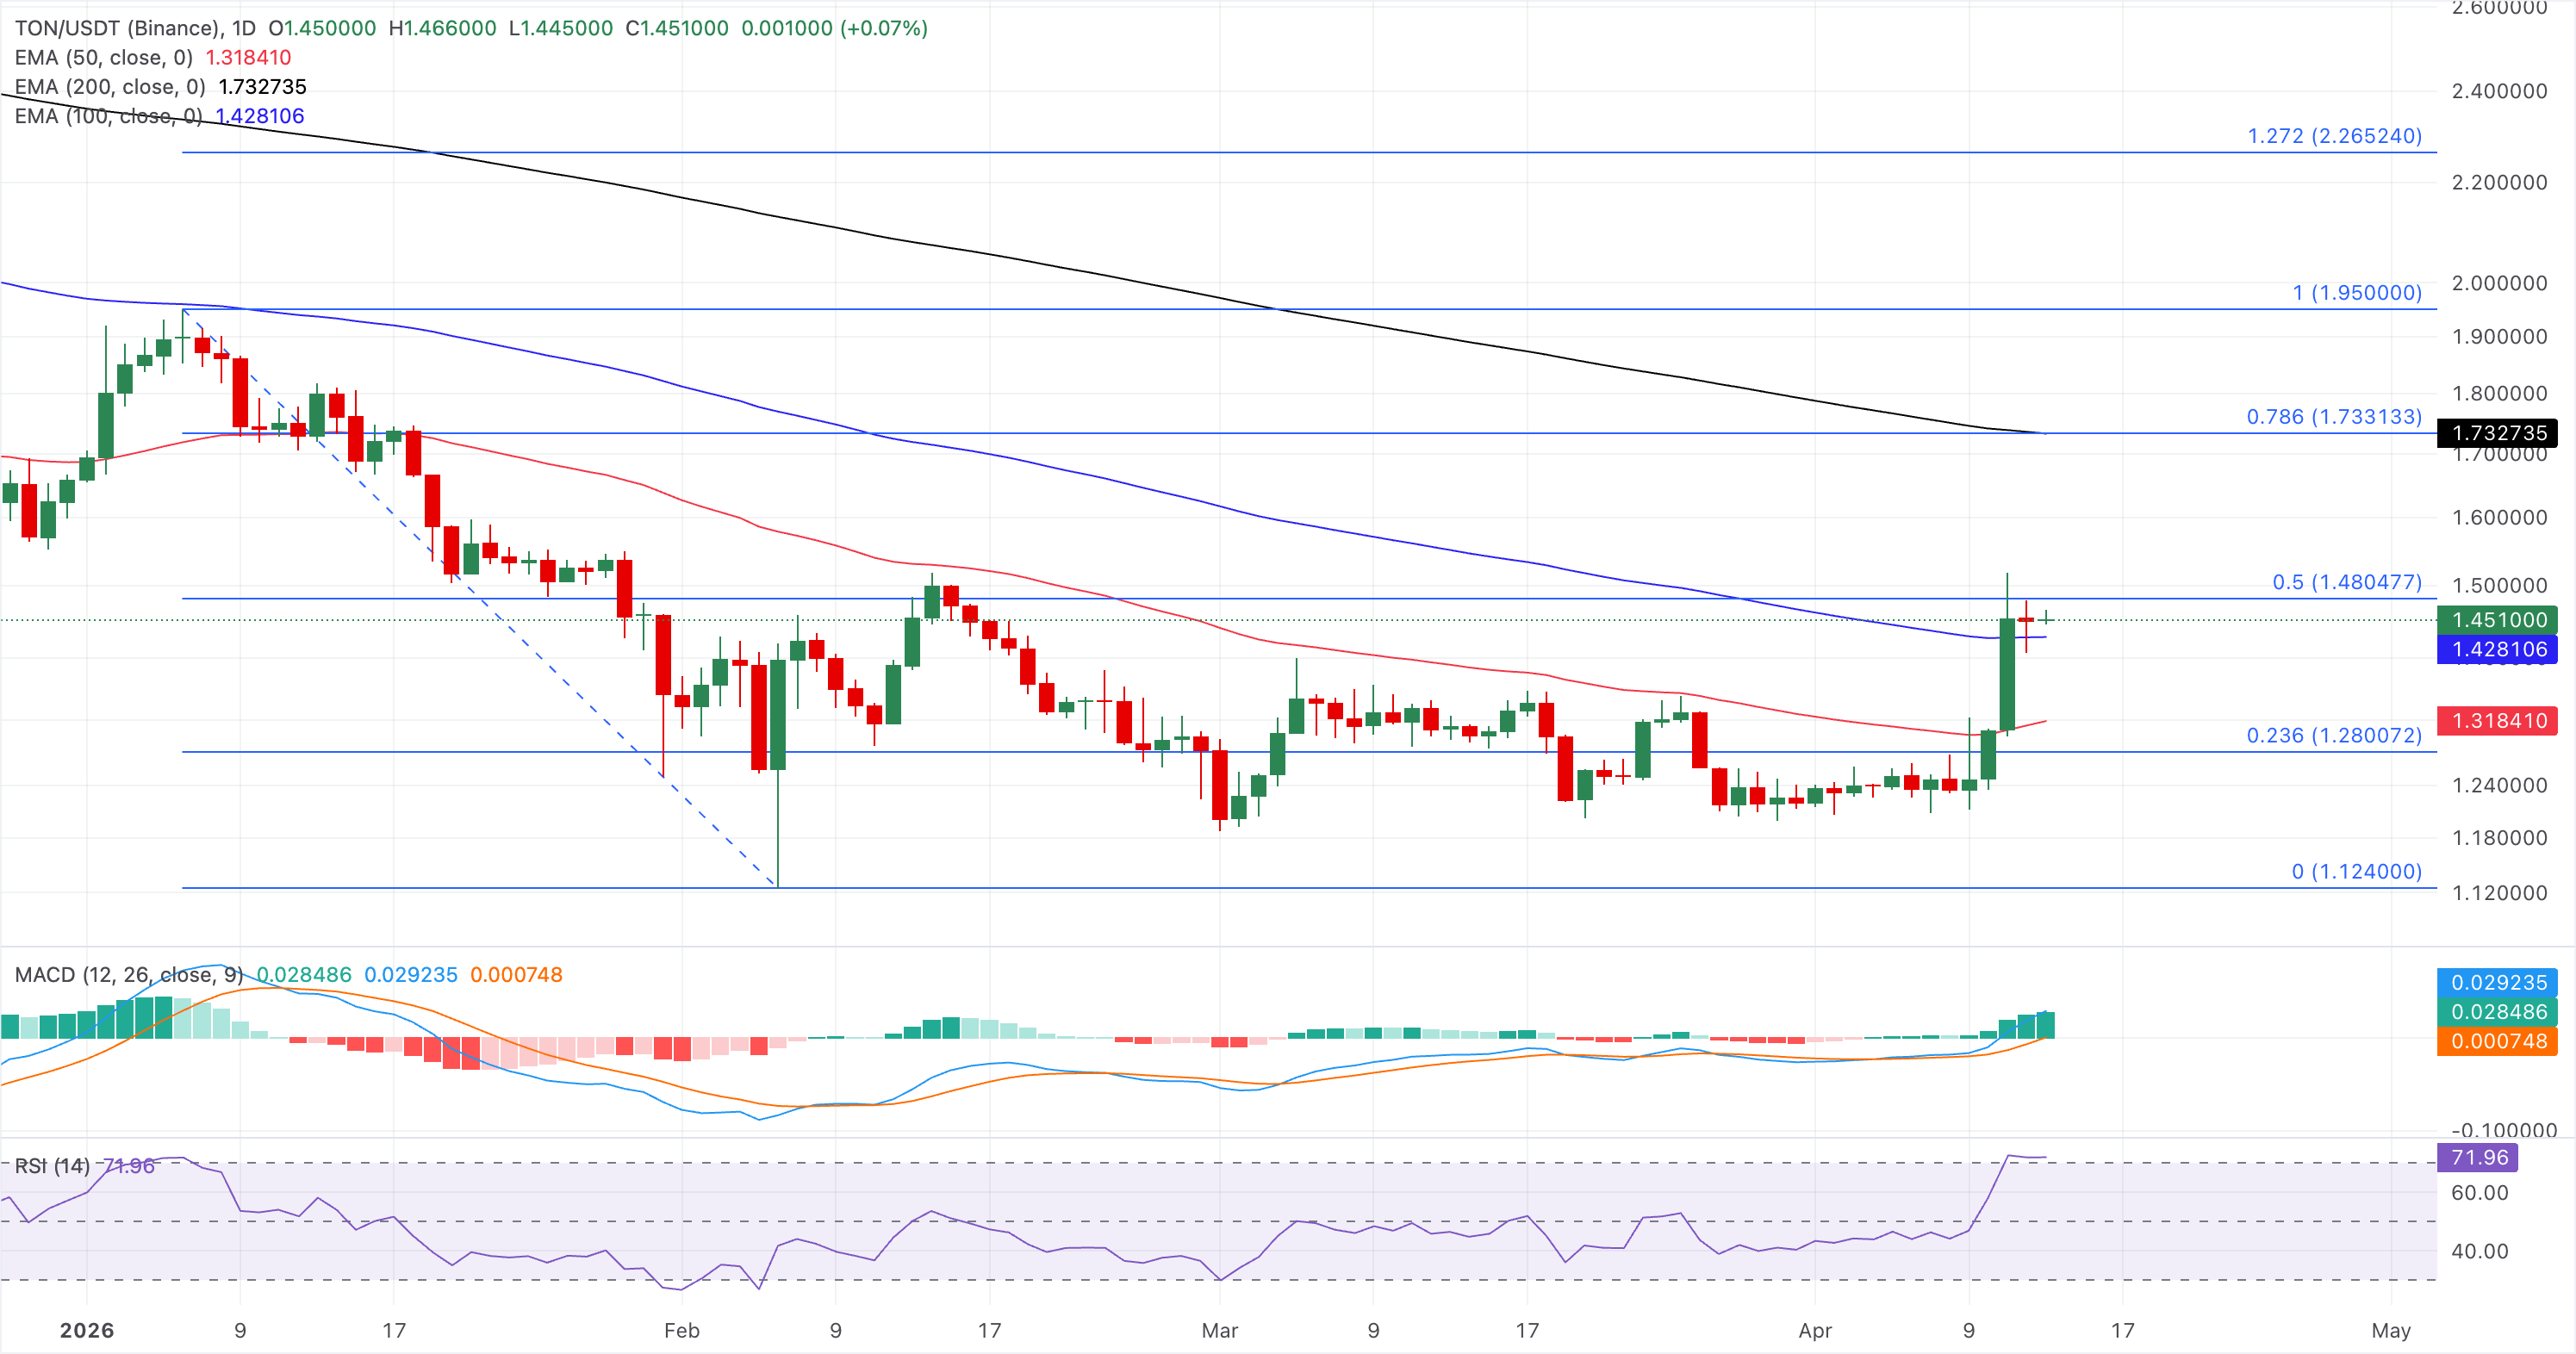
On the downside, immediate support lies at the 100-day EMA at $1.4281, which guards the 23.6% Fibonacci retracement level at $1.3189.
(The technical analysis of this story was written with the help of an AI tool.)
추천 기사


