


Crypto Market Overview: Bitcoin rises as Trump mulls exiting Iran war – River, Sky, Chiliz lead gains
- Bitcoin hovers above $68,000 as the Wall Street Journal reported that US President Donald Trump is willing to end the war in Iran.
- Derivatives data reflects a surge in bullish sentiment as capital inflows align with positive funding rates.
- River, Sky, and Chiliz are leading gains over the last 24 hours.
Bitcoin (BTC) shows a steady recovery above $68,000 at press time on Tuesday, as downside pressure eases amid Donald Trump's consideration of an exit from the Middle East without reopening the Strait of Hormuz. The derivatives market shows early signs of optimism, with Bitcoin futures' Open Interest and long-to-short ratio rising amid positive funding rates. The altcoins River (RIVER), Sky (SKY), and Chiliz (CHZ) are leading the gains over the last 24 hours as the broader market recovers.
Early signs of recovery in Bitcoin derivatives
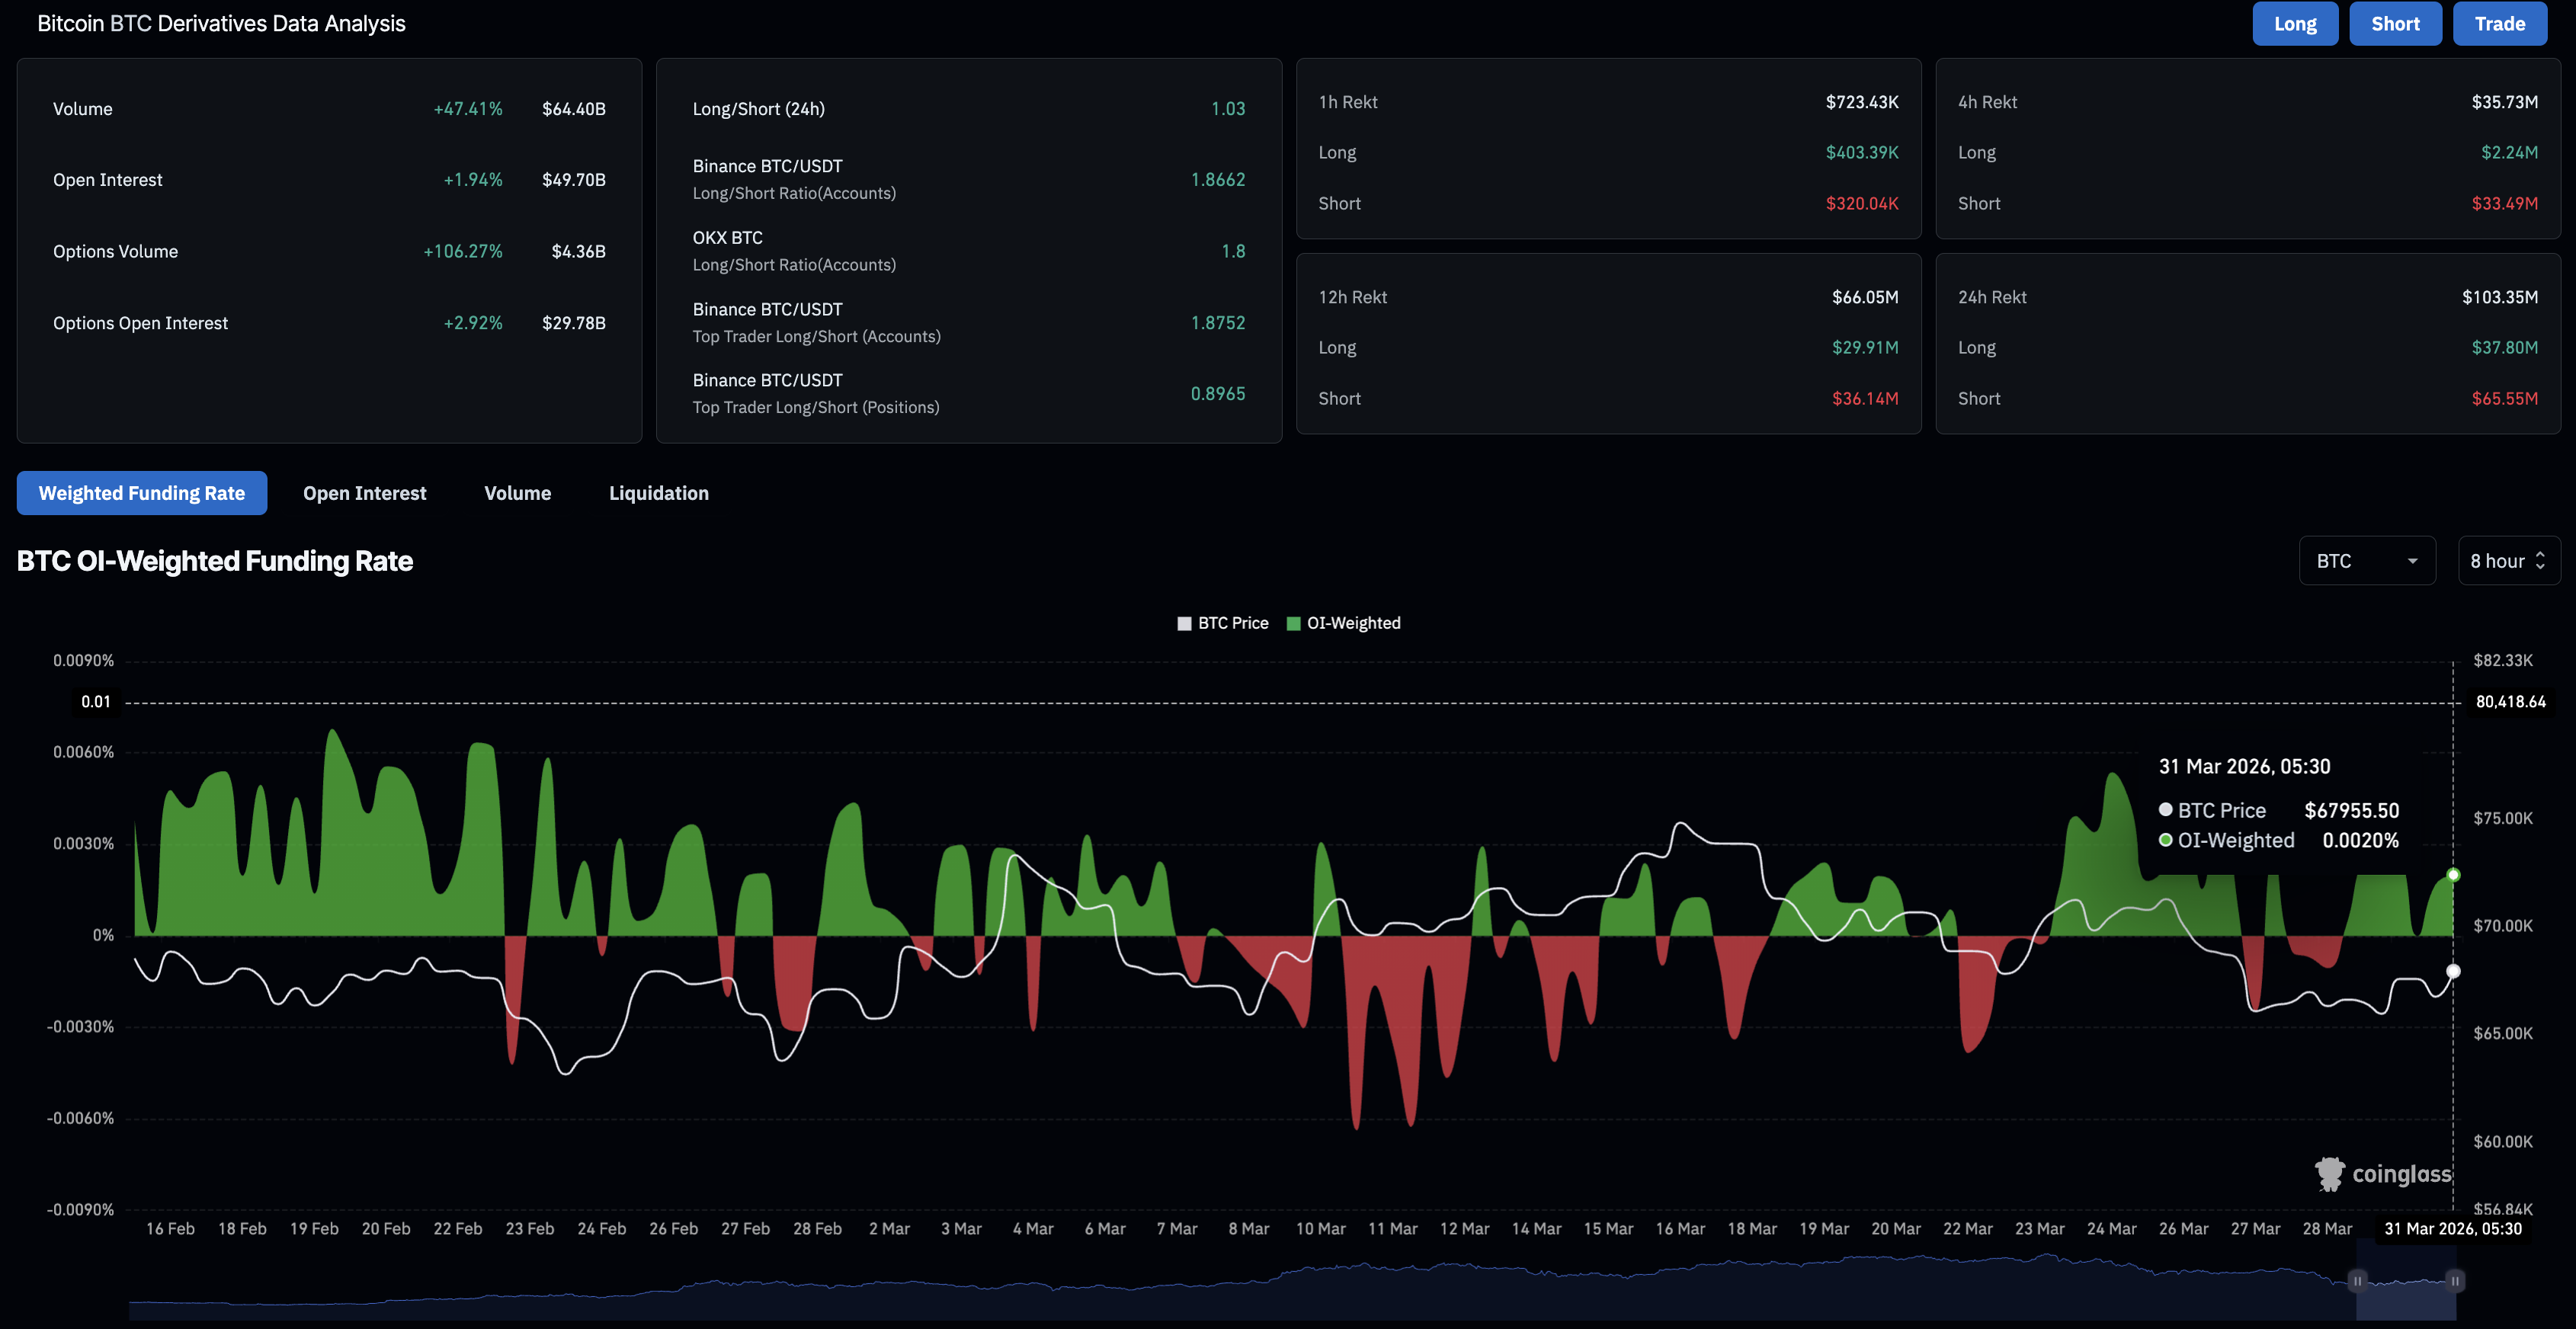
Bitcoin is regaining retail interest as traders flock to its derivatives for leveraged exposure amid the possibility of a de-escalation in the Middle East. CoinGlass data shows that Bitcoin futures Open Interest (OI) is up nearly 2% over the last 24 hours, reaching $49.70 billion, suggesting capital inflows linked to positional buildups.
The bullish incline in this positional buildup is evidenced by the long-to-short ratio of 1.03, suggesting a greater number of active long positions and the positive funding rate of 0.0020%, indicating traders are willing to hold long positions at a premium.
Additionally, liquidations in Bitcoin derivatives reached $103.35 million over the last 24 hours, led by $65.55 million in short liquidations, reaffirming bullish sentiment.
Top Crypto Gainers: River, Sky, and Chiliz extend recovery
River is up 3% at press time on Tuesday, extending the 16% surge from the previous day. Still, the near-term bias is mildly bearish, as RIVER holds below the 50-day Exponential Moving Average (EMA) at $18.32, suggesting a softening medium-term uptrend. A decisive close above this average could open the door to the 50% retracement level of the slide from $87.59 to $7.26, at $25.22.
The Moving Average Convergence Divergence (MACD) line remains below its signal line, with negative histogram bars persisting, suggesting ongoing downside momentum. The Relative Strength Index (RSI) near 47 stays below the 50 midline, reinforcing a moderate bearish tone rather than signaling capitulation.
The initial support for RIVER aligns with the 23.6% Fibonacci retracement at $13.07.
Sky is up by more than 7% at the time of writing on Tuesday, marking its fourth consecutive day of recovery within a rising channel pattern on the daily chart. The immediate resistance for SKY is at the R2 Pivot Point at $0.08262; a daily close above it would target the overhead trendline at $0.08500.
The MACD line has just turned back above the signal line near the zero mark, hinting at improving upside momentum after a shallow corrective phase. The RSI at 61 exits its mid-range consolidation, supporting the view that buyers are regaining control rather than entering overbought territory.
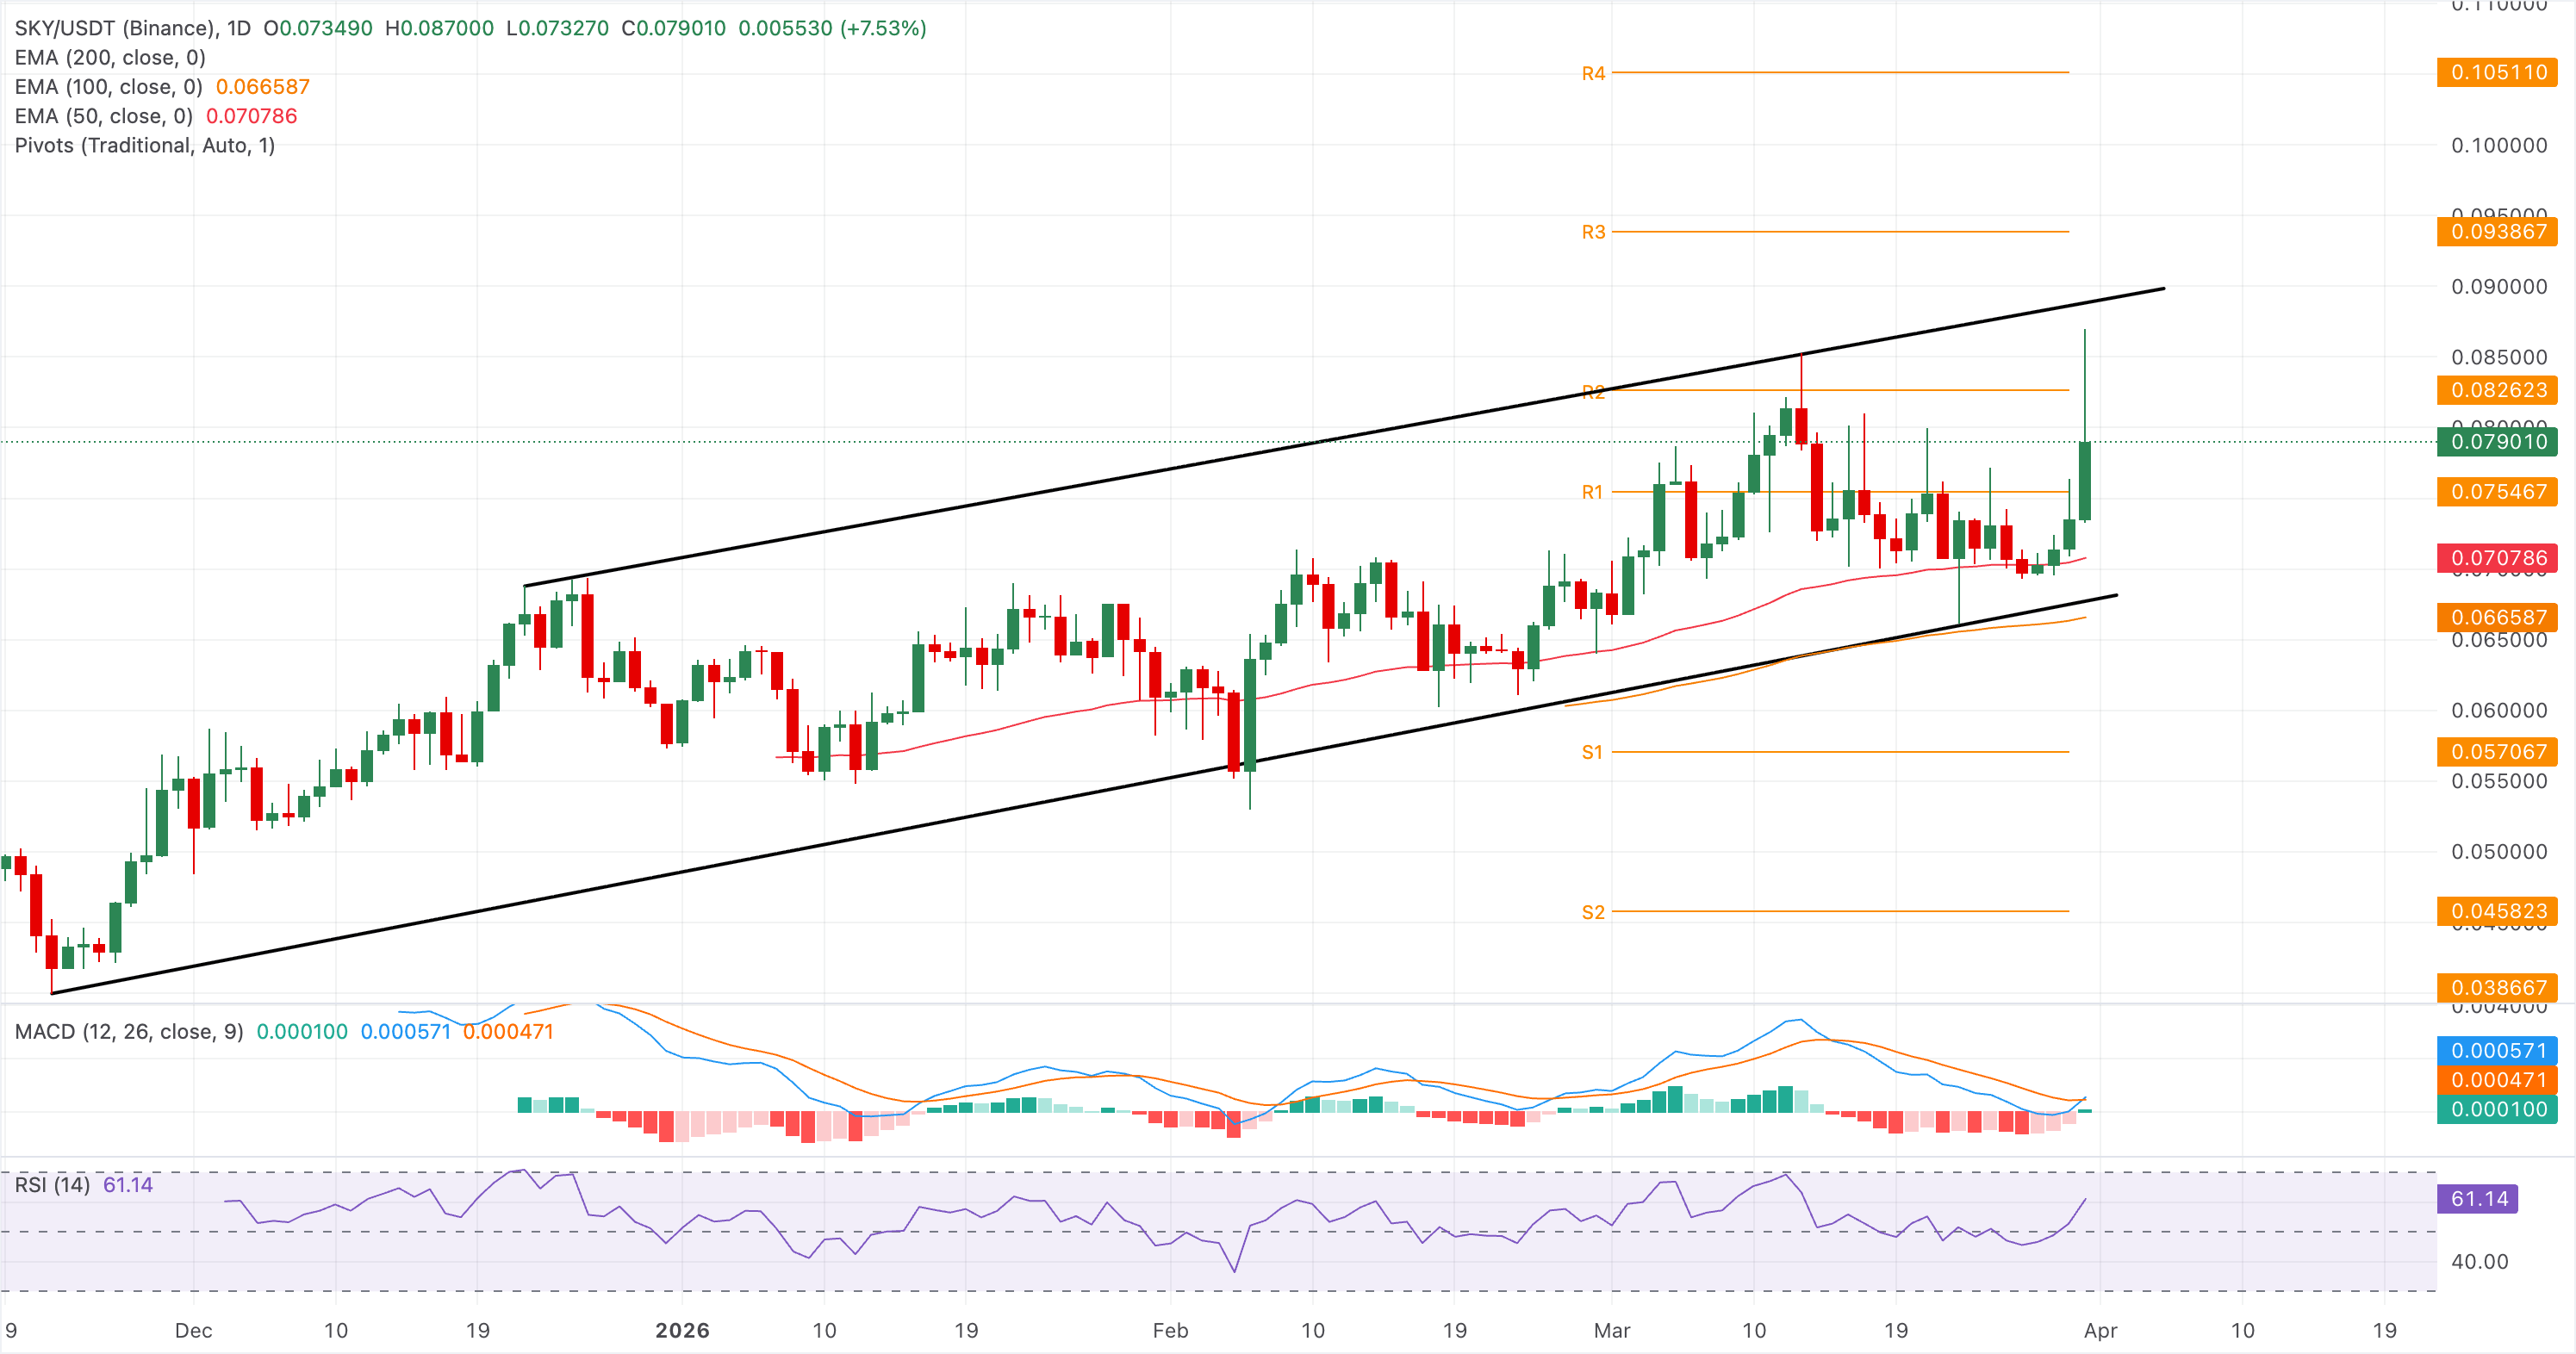
Initial support emerges at the 50-day EMA at $0.07078, which is the latest swing base. A daily close below it would weaken the bullish tone and expose the next downside area around $0.06700.
On the other hand, Chiliz shows a steady recovery on Tuesday, extending the 6% gains from Monday. The recovery run faces headwinds near the 50% retracement level of the slide from $0.0643 to $0.0310, at $0.0446. A daily close above this could extend the rally to the 78.6% Fibonacci retracement level at $0.0550.
The MACD line has moved back above its signal and hovers marginally in positive territory, with the histogram expanding, suggesting strengthening upside momentum. The RSI at 68 stays below overbought territory but confirms persistent buying pressure.
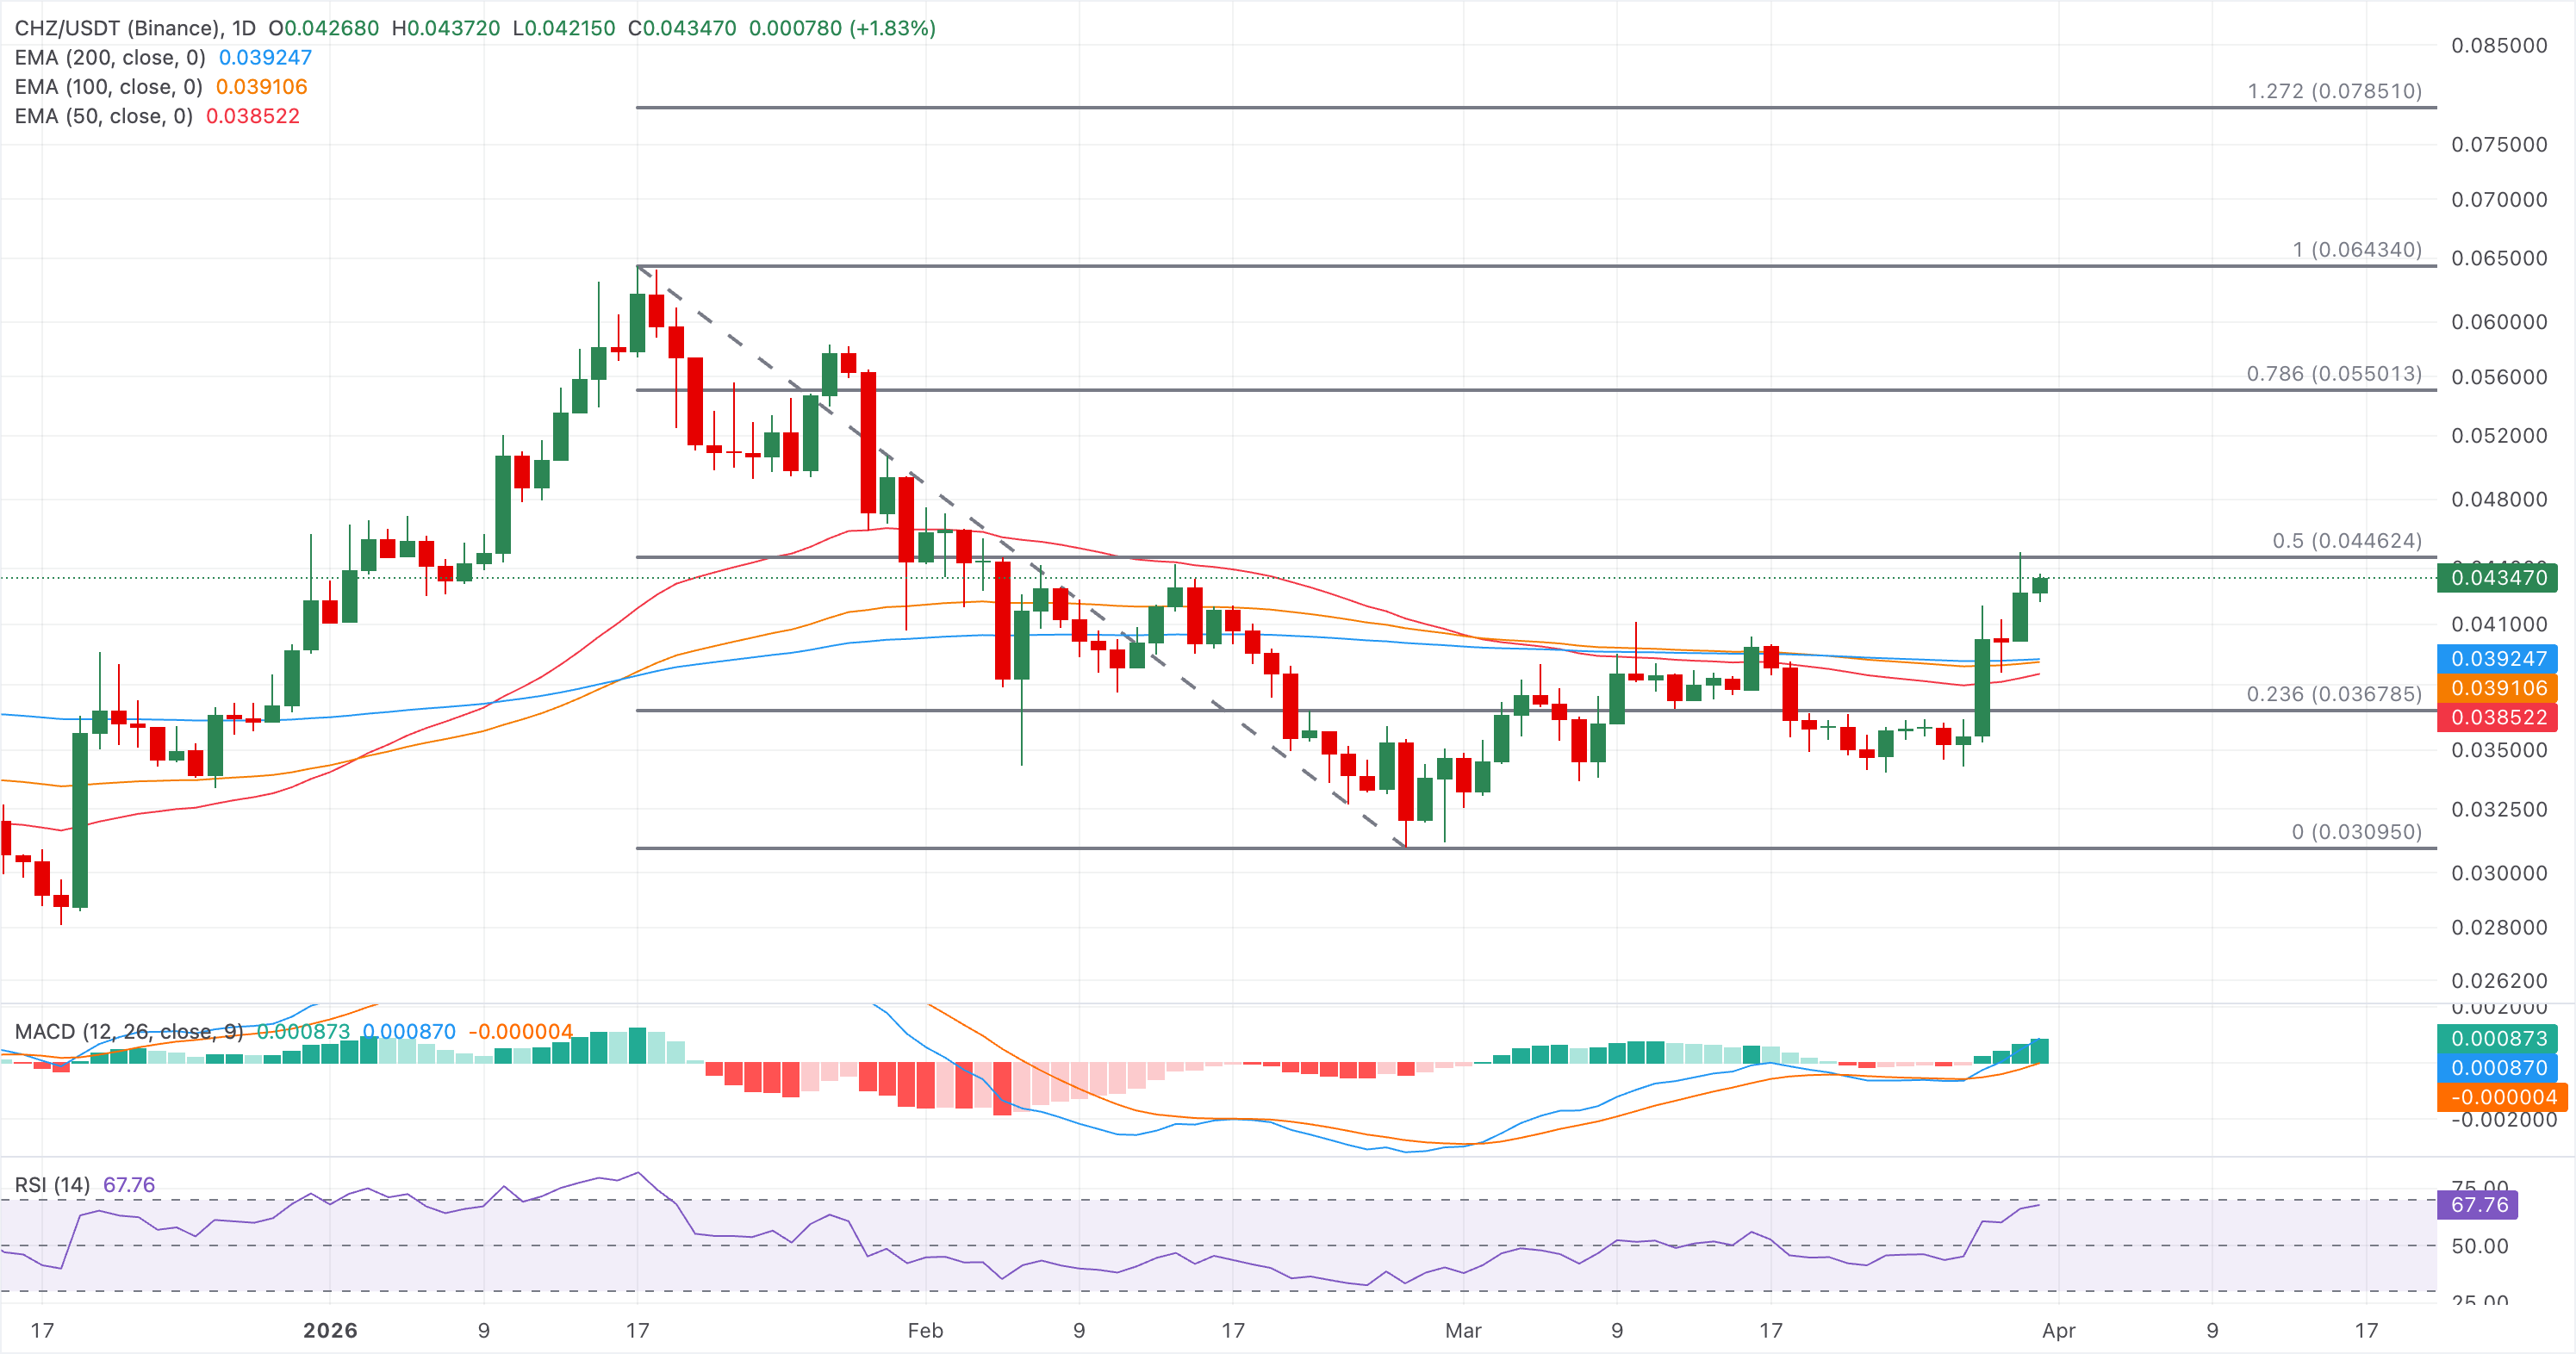
Looking down, the 50-, 100-, and 200-day EMAs near $0.0390 serve as the support cluster, followed by the 23.6% Fibonacci retracement level at $0.0367.
(The technical analysis of this story was written with the help of an AI tool.)
추천 기사


