


Meme Coins Price Prediction: Dogecoin, Shiba Inu, Pepe extend decline under pressure
- Dogecoin extends losses for the sixth consecutive week, with nearly a 5% decline since Monday.
- Shiba Inu keeps ticking lower for the fourth consecutive day, losing around 1% so far on Wednesday.
- Pepe remains under pressure after a 5% drop the previous day.
Meme coins, including Dogecoin (DOGE), Shiba Inu (SHIB) and Pepe (PEPE), are trading in the red on Wednesday, extending losses under pressure. Meme coins face significant downside risk amid the ongoing bear market, given their heightened speculative nature. Technically, DOGE, SHIB, and PEPE could further extend their prevailing bearish trend this week as the market lacks a bullish catalyst.
Dogecoin risks further losses as selling pressure grows
Dogecoin is down nearly 1% at press time on Wednesday, extending its 3% loss from the previous day. On the 4-hour chart, Dogecoin is trading well below the 50-day and 200-day exponential moving averages, reinforcing the downside bias.
The technical indicators on the same chart maintain a sell-side bias. The Relative Strength Index (RSI) is at 36, trending lower, with further downside potential before reaching the oversold zone, and the Moving Average Convergence Divergence (MACD) line remains below the signal line, with negative histogram bars extending. This suggests an increase in bearish momentum.
Immediate support for Dogecoin lies at $0.08675, and a close below this could extend the decline to the February 6 low at $0.080.
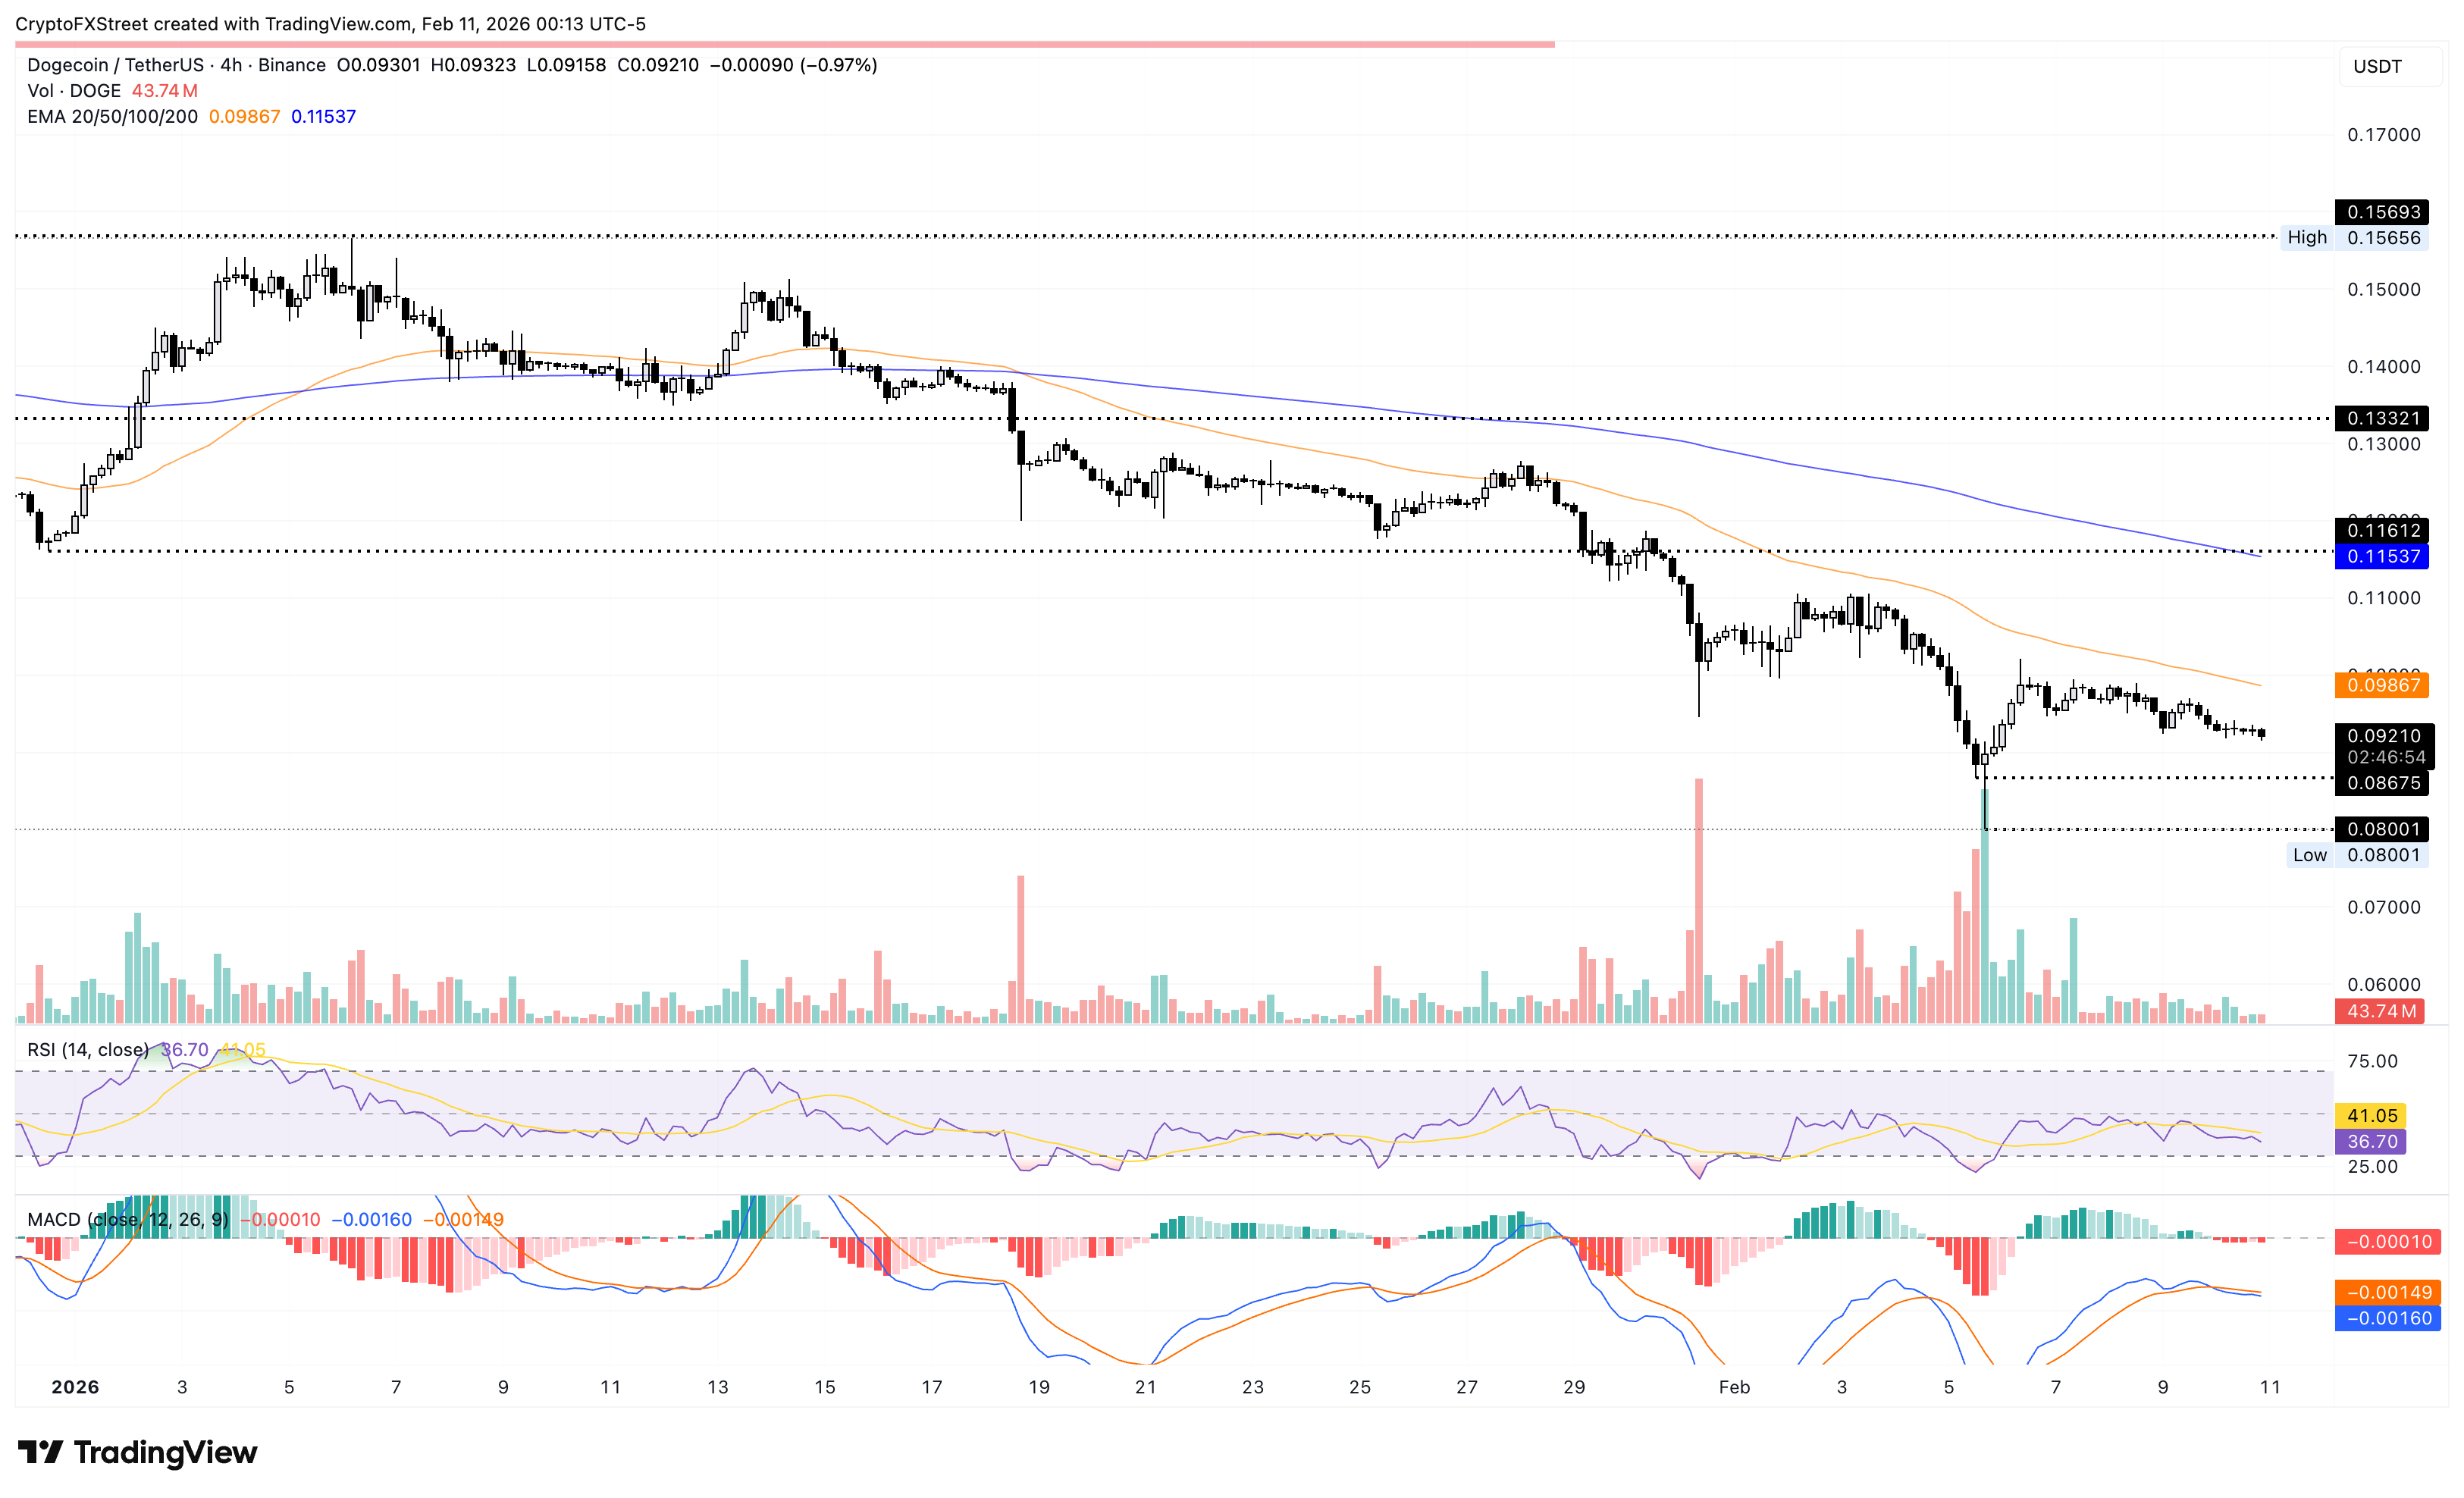
On the upside, Dogecoin could encounter resistance at the 50-day and 200-day EMAs at $0.098 and $0.1153, respectively.
Shiba Inu bears target recent low
Shiba Inu closely mimics Dogecoin, recording a nearly 1% loss at press time on Wednesday, extending its downward trend for the fourth consecutive day. The meme coin is extending lower within a descending channel pattern on the 4-hour chart, with immediate support at $0.0000059.
Beyond this, crucial support for SHIB lies at $0.0000056 and the February 6 low, and at $0.0000051, which coincides with the lower boundary line of the falling channel pattern.
The RSI at 40 is moving toward the oversold zone as selling pressure increases, while the MACD and signal lines remain convergent, suggesting a potential bearish crossover.
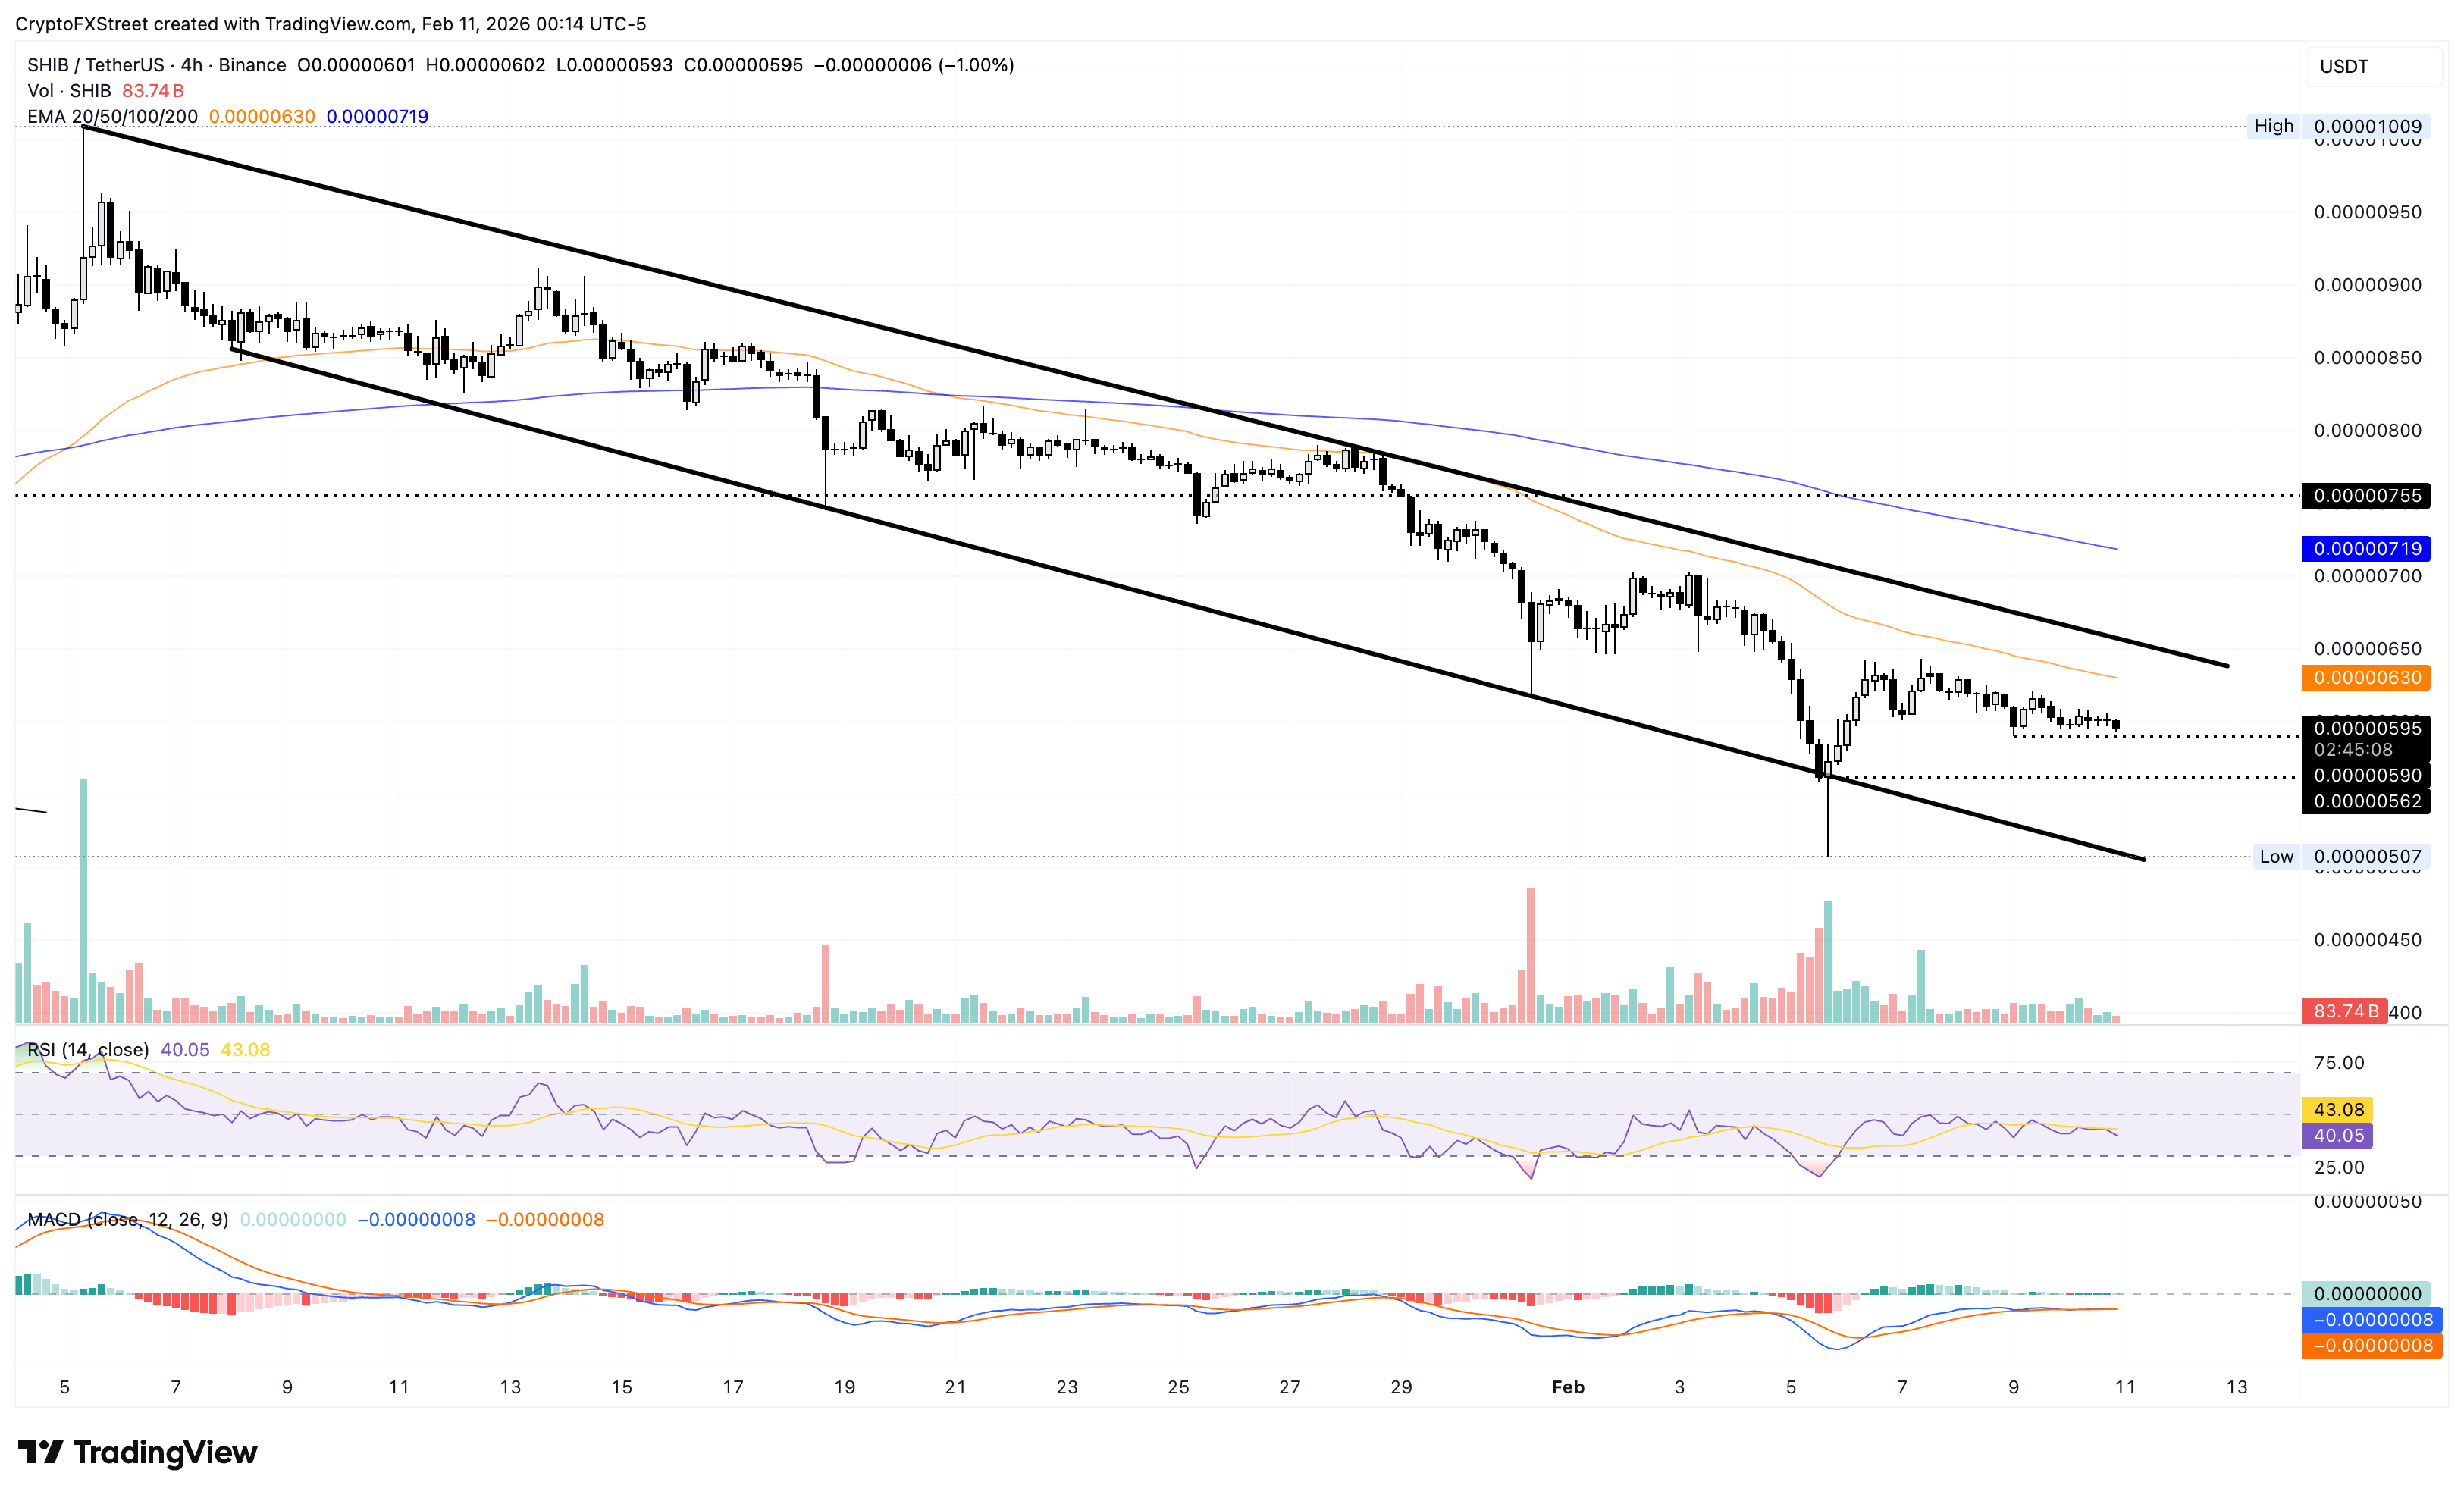
On the upside, a rebound could target the 50-period EMA at $0.0000063, followed by the upper resistance line at $0.0000065.
Pepe faces downside pressure near the key resistance trendline
PEPE is down over 1% at the time of writing on Wednesday, extending its over 4% loss from the previous day. This takes the weekly decline to nearly 5% so far, marking the sixth consecutive bearish week.
On the 4-hour chart, the frog-themed meme coin is reversing from a resistance trendline toward the February 6 low at $0.00000310.
The RSI at 39 on the 4-hour chart is reversing from the halfway line toward the oversold zone as selling pressure grows, while the MACD and signal lines extend the downward trend as negative histogram bars widen.
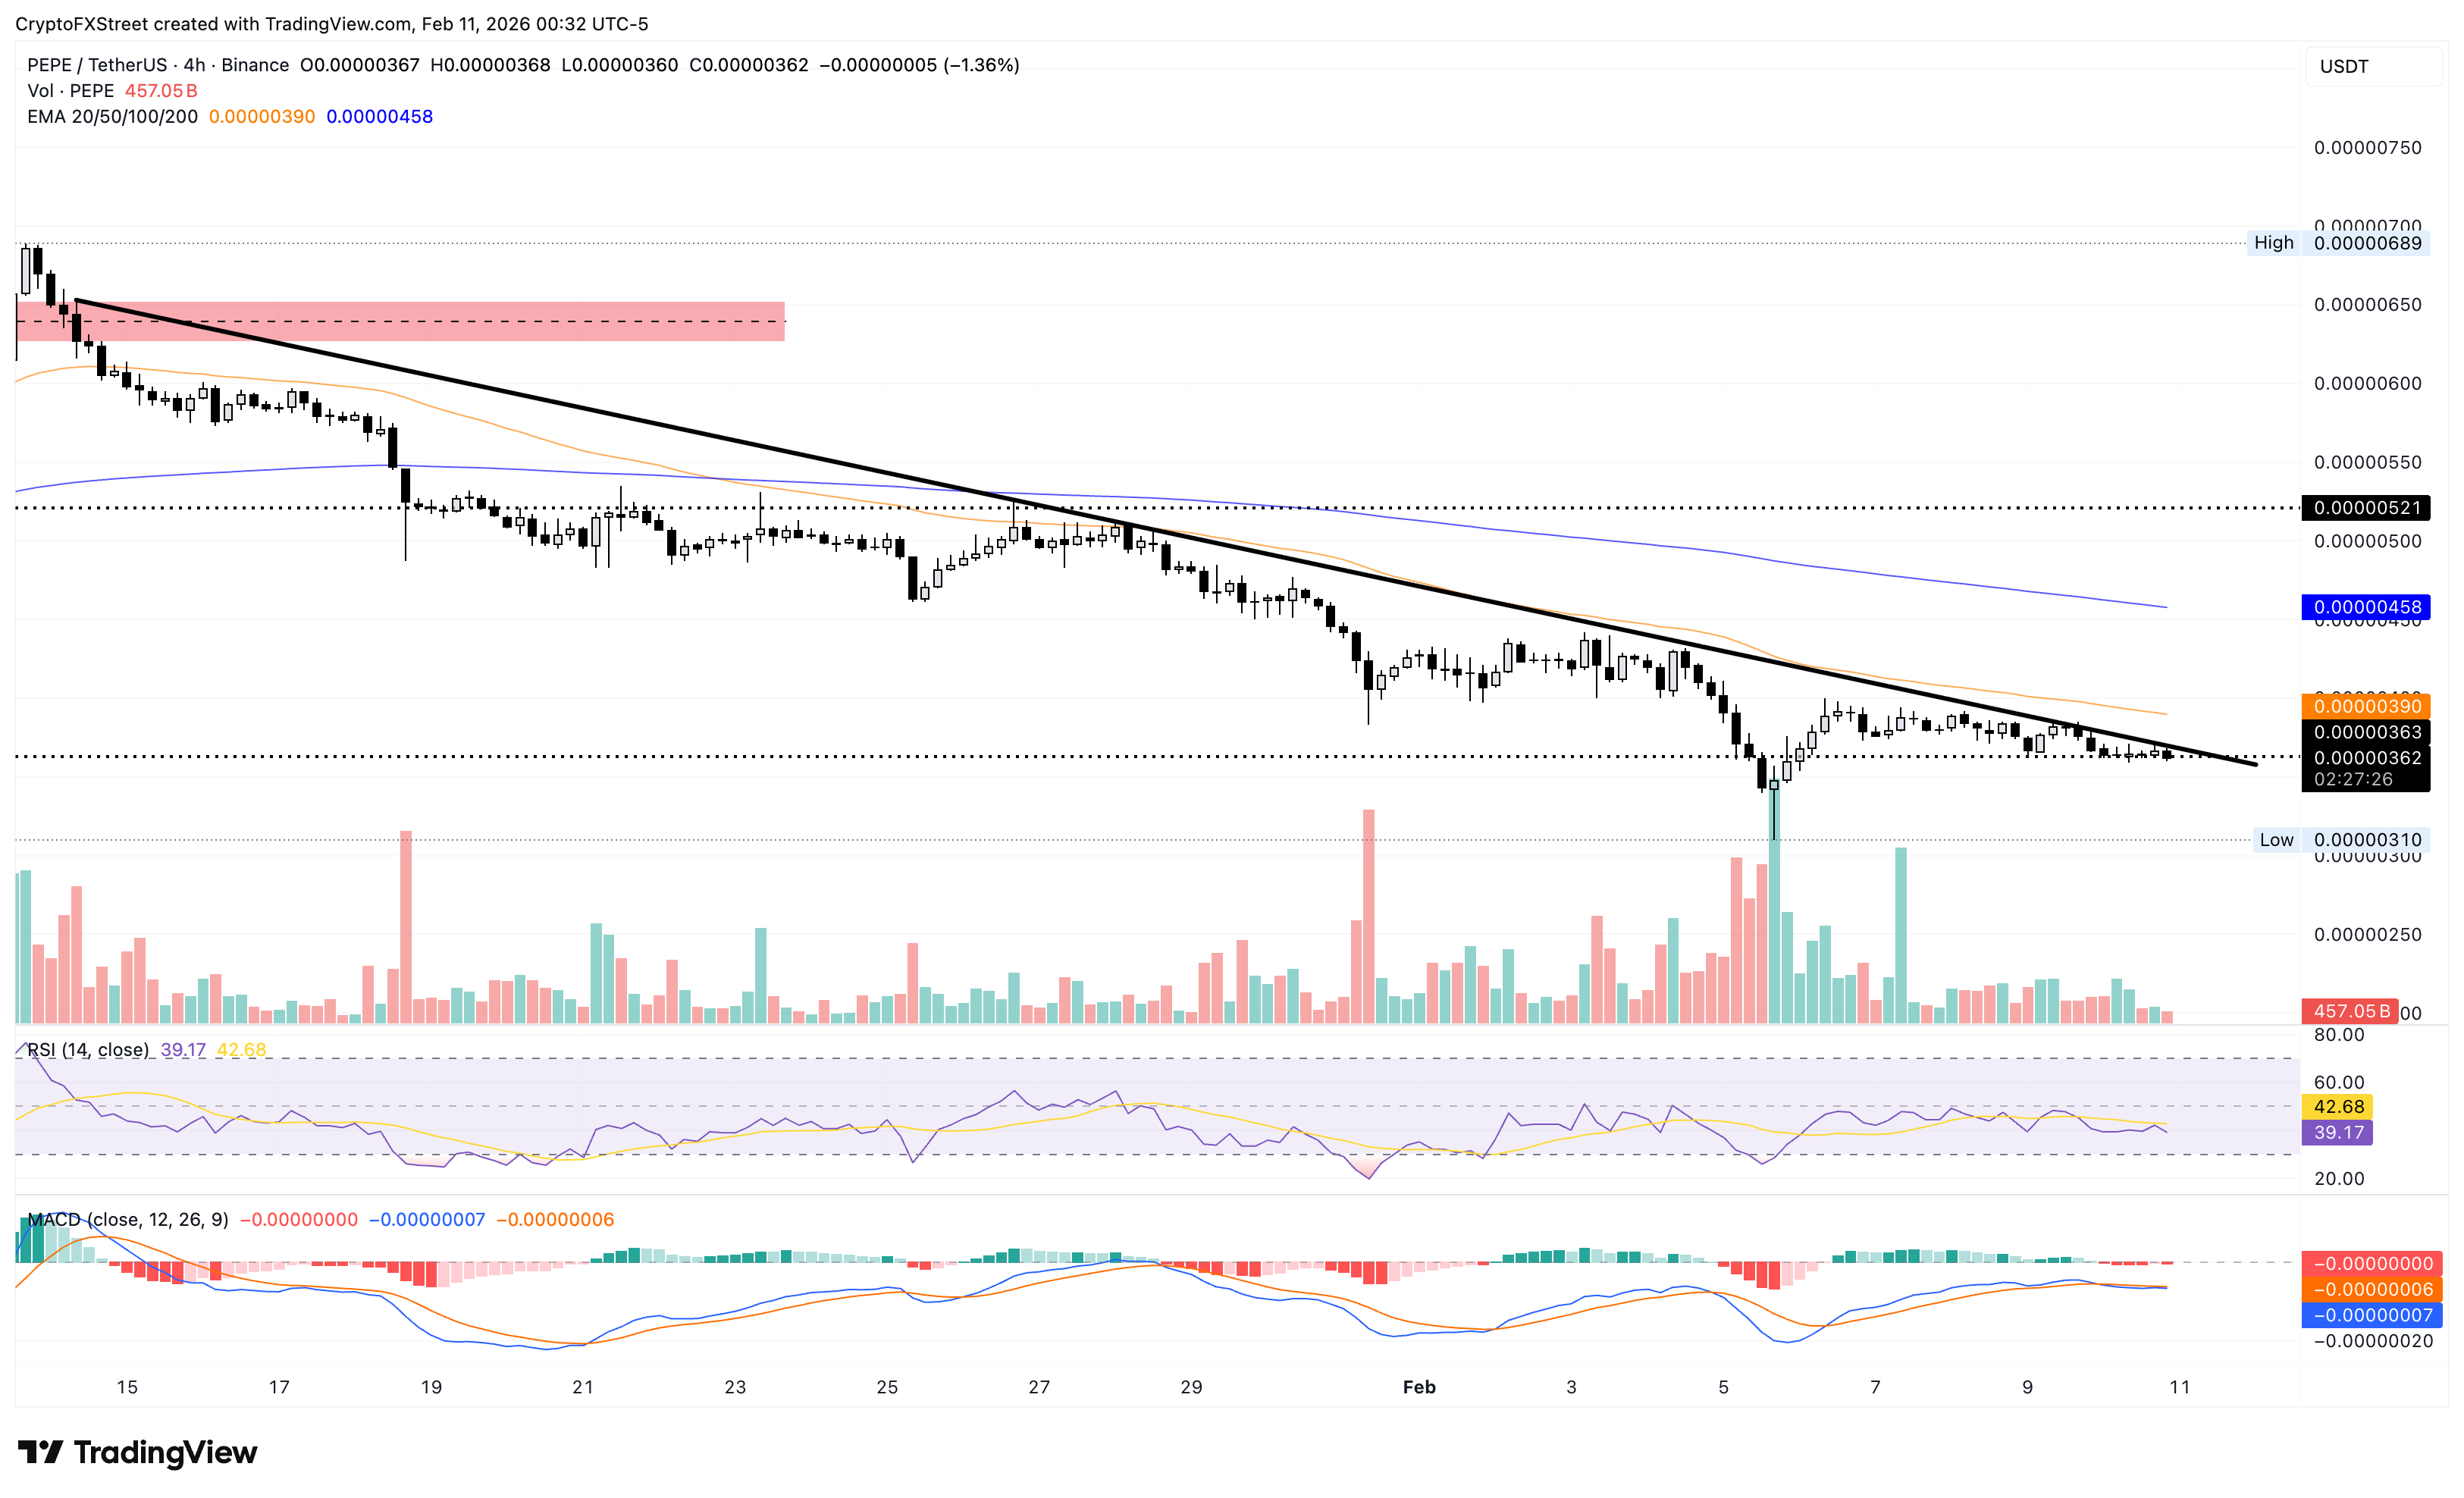
On the upside, a potential rebound above the $0.00000370 could confirm the resistance trend line breakout, targeting the 50-period EMA at $0.00000390, followed by the 200-period EMA at $0.00000458.
(The technical analysis of this story was written with the help of an AI tool.)
추천 기사


