
Crypto Today: Bitcoin steadies, Ethereum eyes record highs, XRP validating bullish pattern
- Bitcoin steadies around $124,000 after hitting a new all-time high of $126,199 the previous day.
- Ethereum bulls look to push prices toward record highs, supported by strong institutional inflows.
- XRP finds footing around a previously broken bullish pattern, with the next upside target at $3.40.
Bitcoin (BTC) price is consolidating near $124,000 after reaching a new record high on the previous day. Ethereum (ETH) is gaining traction as institutional demand builds, fueling hopes of a rally toward record highs, while Ripple (XRP) finds support at a key technical level with bulls eyeing a climb toward $3.40.
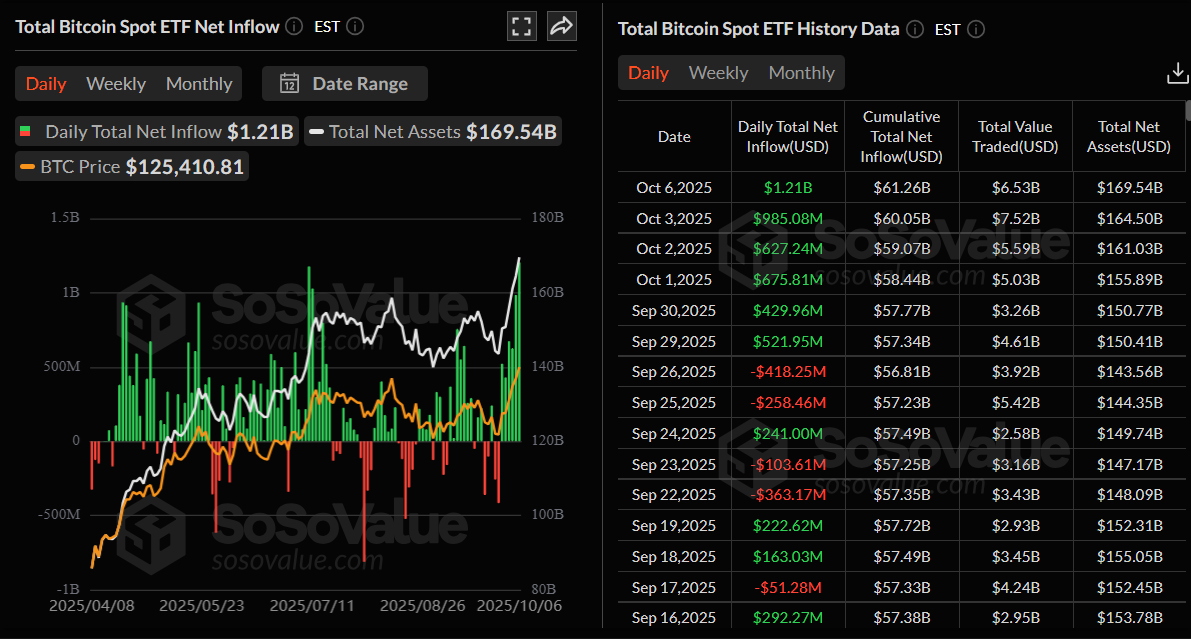
Data spotlight: Bitcoin hits record highs as ETF demand strengthens
Bitcoin institutional demand continues to strengthen as the week begins. SoSoValue data shows that Bitcoin spot ETFs recorded a total of $1.21 billion on Monday, continuing their six-day streak since September 29. Moreover, in the previous week, ETF flows recorded net inflows of $3.24 billion, their largest in 2025 and the second-largest on record, which pushed the BTC price to new highs.
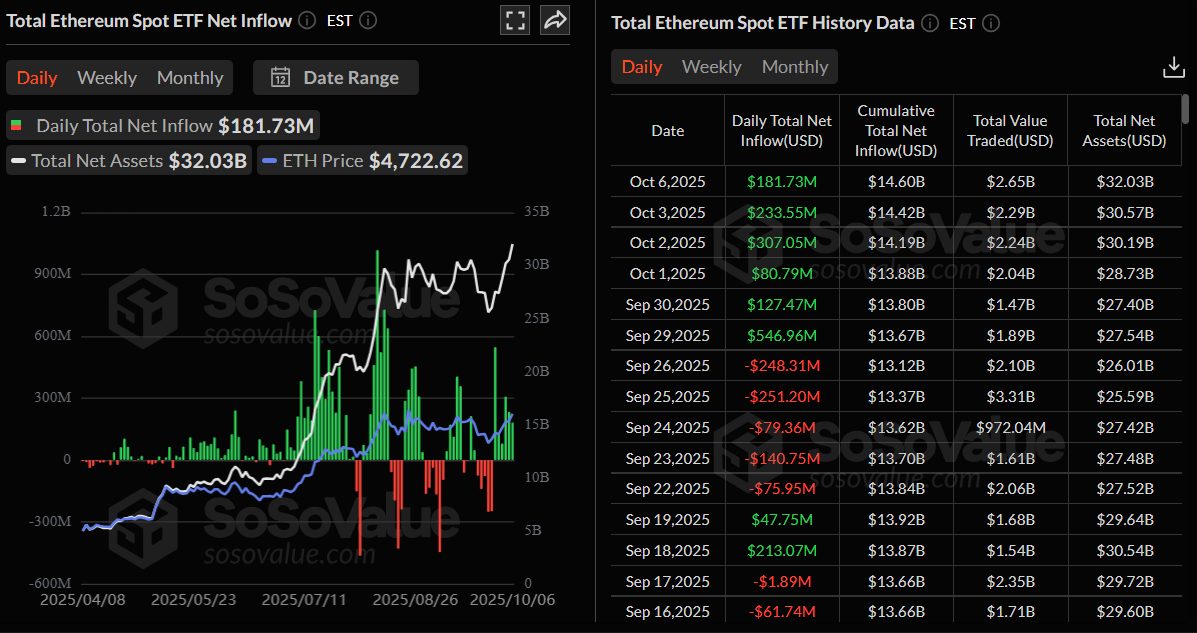
Demand for Ethereum spot ETFs has also increased steadily. As of Monday, the start of this week, an inflow of $181 million was recorded, marking six consecutive days of inflows.
Meanwhile, retail interest in XRP derivatives is growing, with futures Open Interest (OI) reaching $1.37 billion on Tuesday, nearing the levels seen during mid-September, according to CoinGlass data. A steady OI also implies increased engagement and conviction in XRP’s ability to sustain the uptrend in the short term.
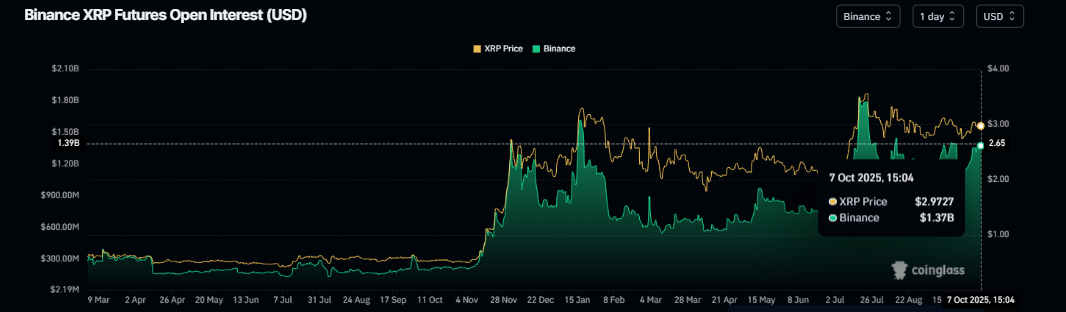
XRP Futures Open Interest | Source: CoinGlass
Chart of the day: How high can BTC go?
Bitcoin price started the week on a positive note, hitting a new all-time high of $126,199 on Monday after surging more than 10% in the previous week. At the time of writing on Tuesday, it steadies at around $124,000.
If BTC continues its upward trend, it could extend the rally toward the key psychological level at $130,000.
However, the Relative Strength Index (RSI) on the daily reads 70 after declining from overbought conditions on Monday. It points downward, indicating a potential slowdown in bullish momentum and the likelihood of short-term consolidation. If investors focus on taking profits near record highs, BTC could extend the decline toward the key support at $120,000.
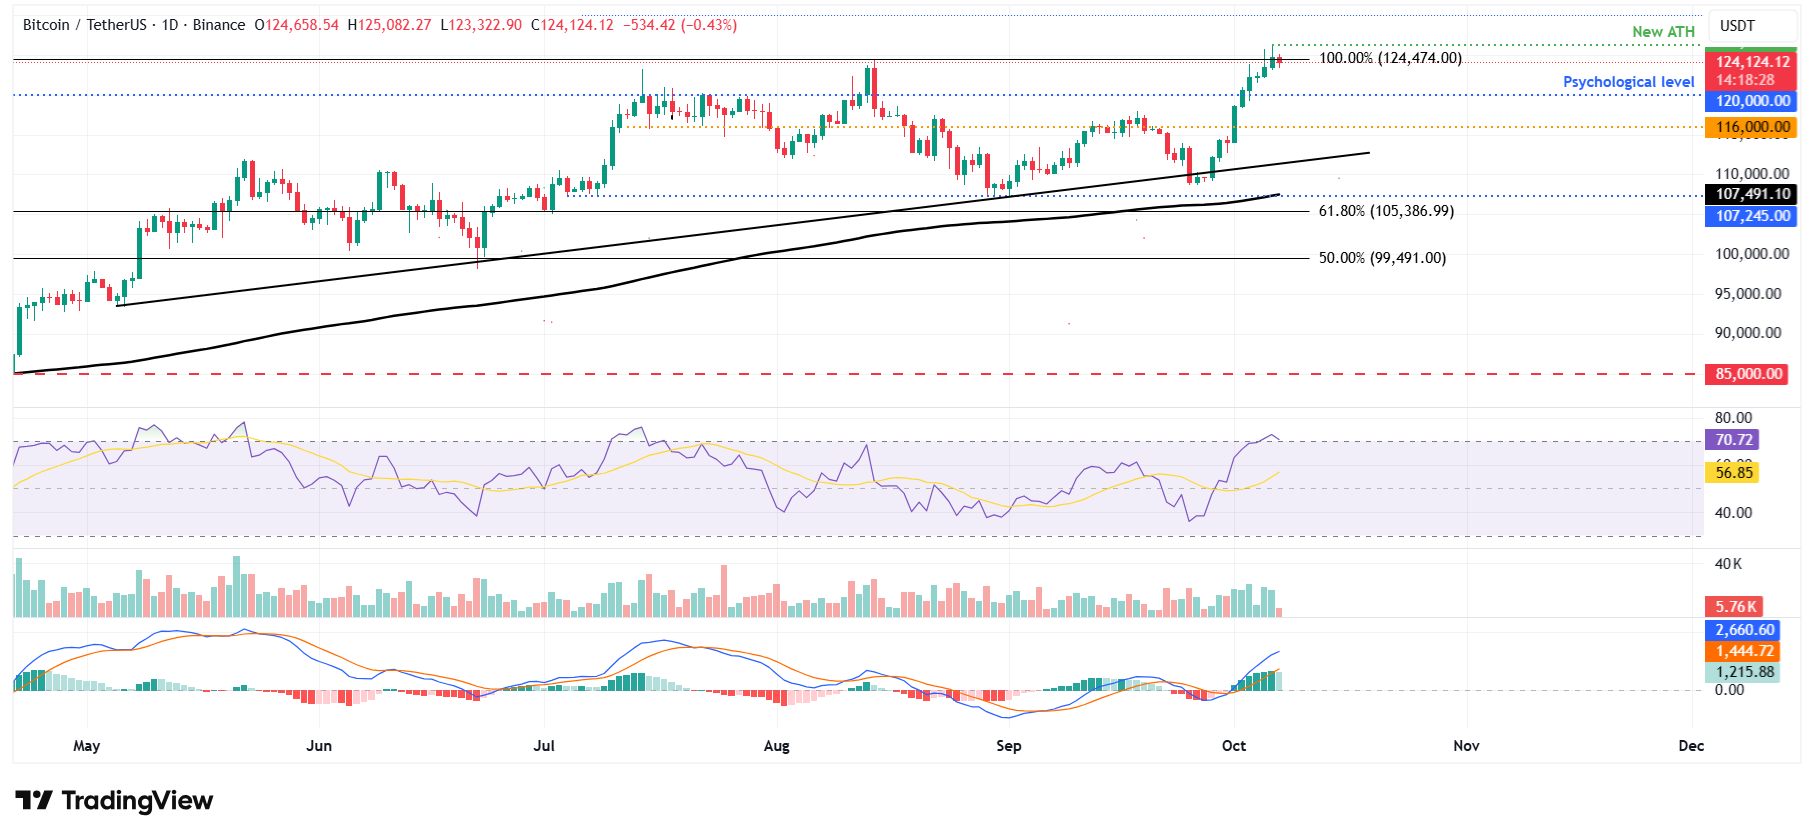
BTC/USDT daily chart
Altcoins update: Ethereum bulls aim for record highs, XRP validates the falling wedge pattern
Ethereum price broke above the daily resistance at $4,232, rallied by nearly 9% last week and closed above the next key resistance at $4,488. ETH found support around the $4,488 on Monday and rose 3.76% that day. At the time of writing on Tuesday, it hovers around $4,677.
If the $4,488 continues to hold as support, ETH could extend the rally toward the all-time high at $4,956.
The RSI on the daily chart reads 63, which is above the neutral level of 50, indicating that bullish momentum is gaining traction. Moreover, the Moving Average Convergence Divergence (MACD) also showed a bullish crossover last week. Additionally, the rising green histogram bars above the neutral level further indicate a bullish momentum and continuation of an upward trend.
On the other hand, if ETH faces a correction and closes below the $4,488 support, it could extend the decline toward the next support level at $4,232.
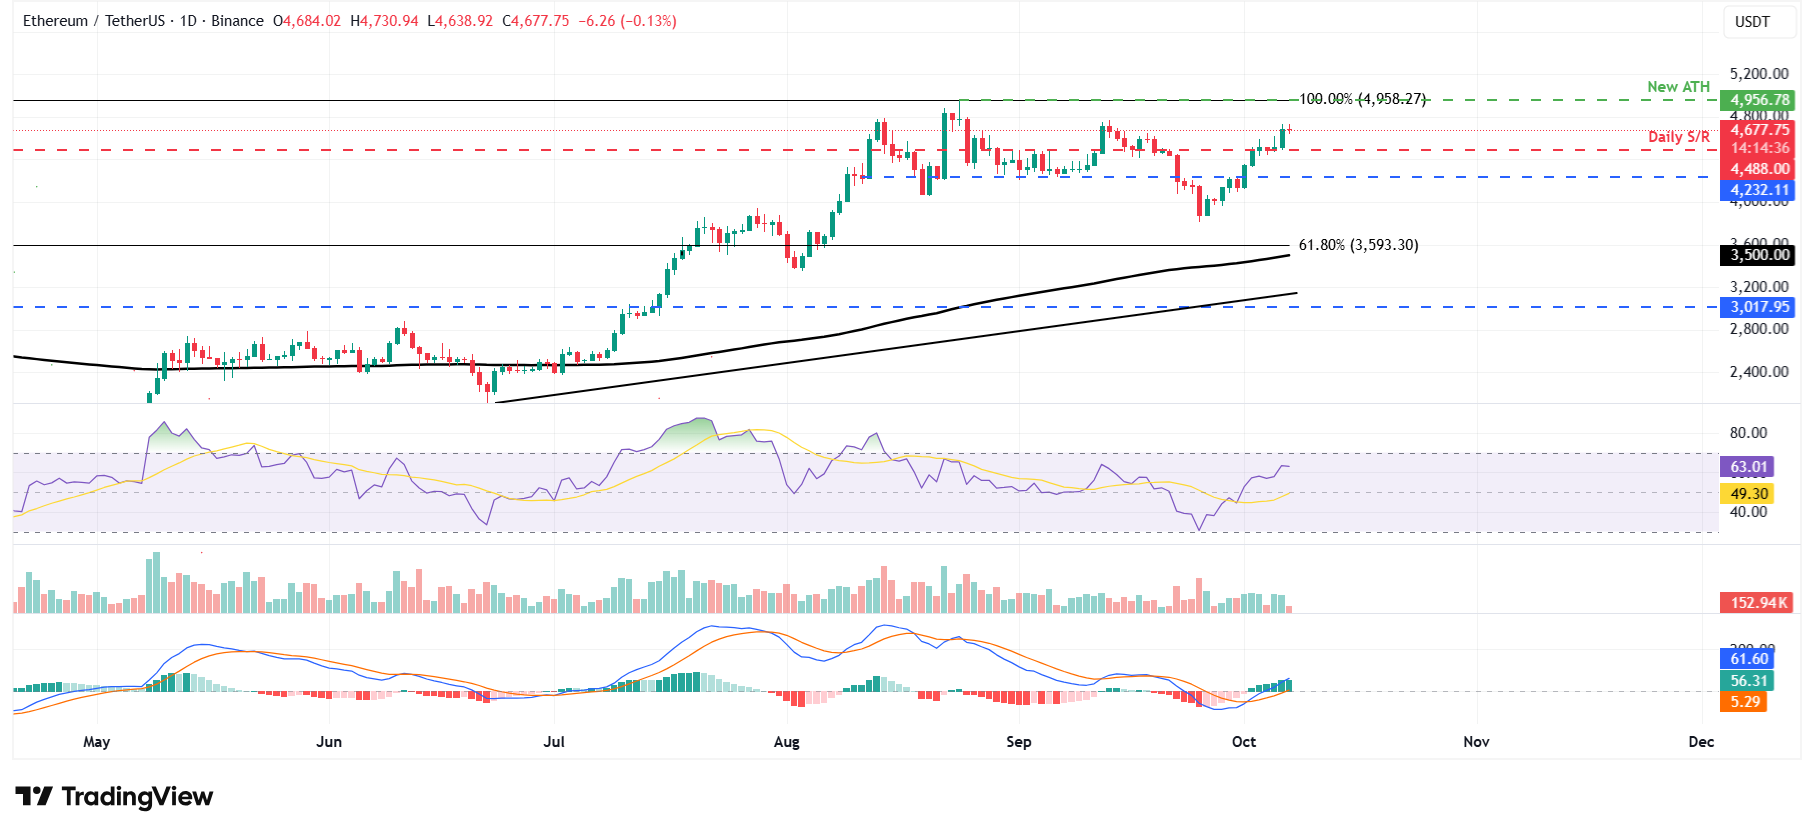
ETH/USDT daily chart
As for XRP, it broke above the falling wedge pattern (drawn by joining multiple lows and highs with two trendlines since mid-July) on Thursday. A breakout of this pattern generally favours the bulls. However, XRP retested and found support around the upper trendline boundary in the next four days. At the time of writing on Tuesday, it hovers around $2.97.
If XRP continues its upward trend, it could extend the rally toward the next daily resistance at $3.40.
Like Ethereum, XRP’s RSI and MACD indicators on the daily chart support a bullish outlook.
However, if XRP faces a correction, it could extend the decline toward the daily support at $2.72.
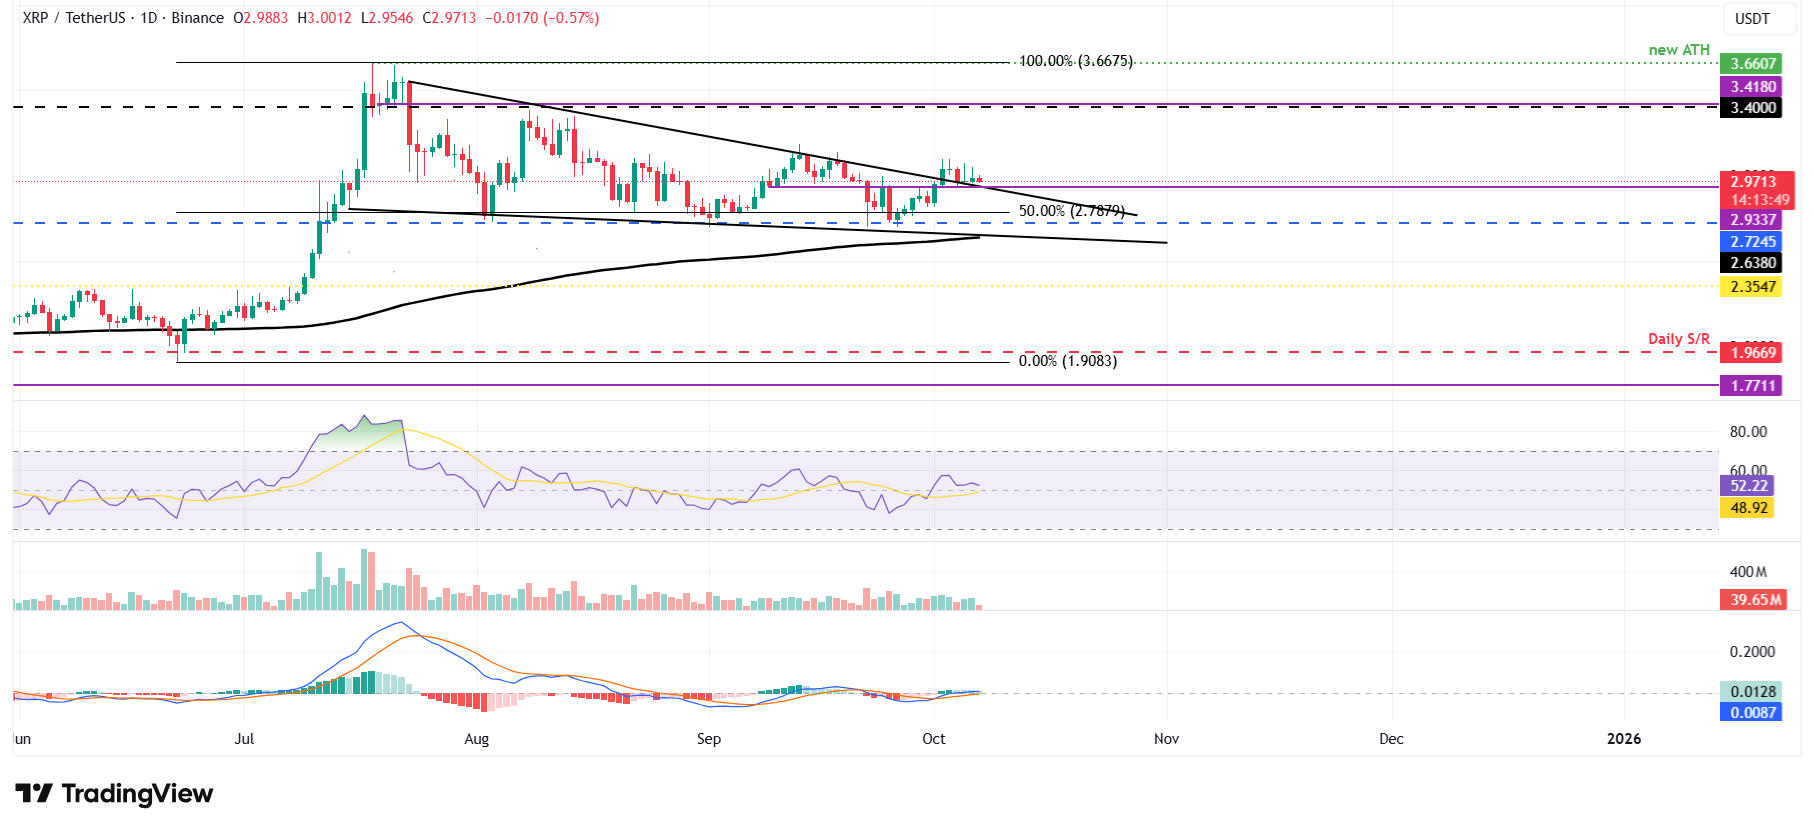
XRP/USDT daily chart
Bitcoin, altcoins, stablecoins FAQs
Bitcoin is the largest cryptocurrency by market capitalization, a virtual currency designed to serve as money. This form of payment cannot be controlled by any one person, group, or entity, which eliminates the need for third-party participation during financial transactions.
Altcoins are any cryptocurrency apart from Bitcoin, but some also regard Ethereum as a non-altcoin because it is from these two cryptocurrencies that forking happens. If this is true, then Litecoin is the first altcoin, forked from the Bitcoin protocol and, therefore, an “improved” version of it.
Stablecoins are cryptocurrencies designed to have a stable price, with their value backed by a reserve of the asset it represents. To achieve this, the value of any one stablecoin is pegged to a commodity or financial instrument, such as the US Dollar (USD), with its supply regulated by an algorithm or demand. The main goal of stablecoins is to provide an on/off-ramp for investors willing to trade and invest in cryptocurrencies. Stablecoins also allow investors to store value since cryptocurrencies, in general, are subject to volatility.
Bitcoin dominance is the ratio of Bitcoin's market capitalization to the total market capitalization of all cryptocurrencies combined. It provides a clear picture of Bitcoin’s interest among investors. A high BTC dominance typically happens before and during a bull run, in which investors resort to investing in relatively stable and high market capitalization cryptocurrency like Bitcoin. A drop in BTC dominance usually means that investors are moving their capital and/or profits to altcoins in a quest for higher returns, which usually triggers an explosion of altcoin rallies.
추천 기사


