
Aster Price Forecast: ASTER on edge amid token unlock risk, declining Open Interest
- Aster records a double-digit loss over the last 24 hours, putting stress on a local support trendline.
- The fear of token unlock increasing the circulating supply is a potential reason behind the fall.
- Derivatives data suggest a decline in traders’ interest, signaling a risk-off sentiment.
Aster (ASTER) remains steady at press time on Wednesday, following a 14.6% drop the previous day, driven by rumors of token unlocks. Meanwhile, the declining interest among derivatives traders flashes downside risk.
The risk of token unlock is real
Quinten Francois, host of Coin Compass, shared on his X account on Tuesday that the unlock of 704 million ASTER tokens on Wednesday, accounting for 8.8% of the total supply, would increase the circulating supply from 5% to 13.8% in one day.
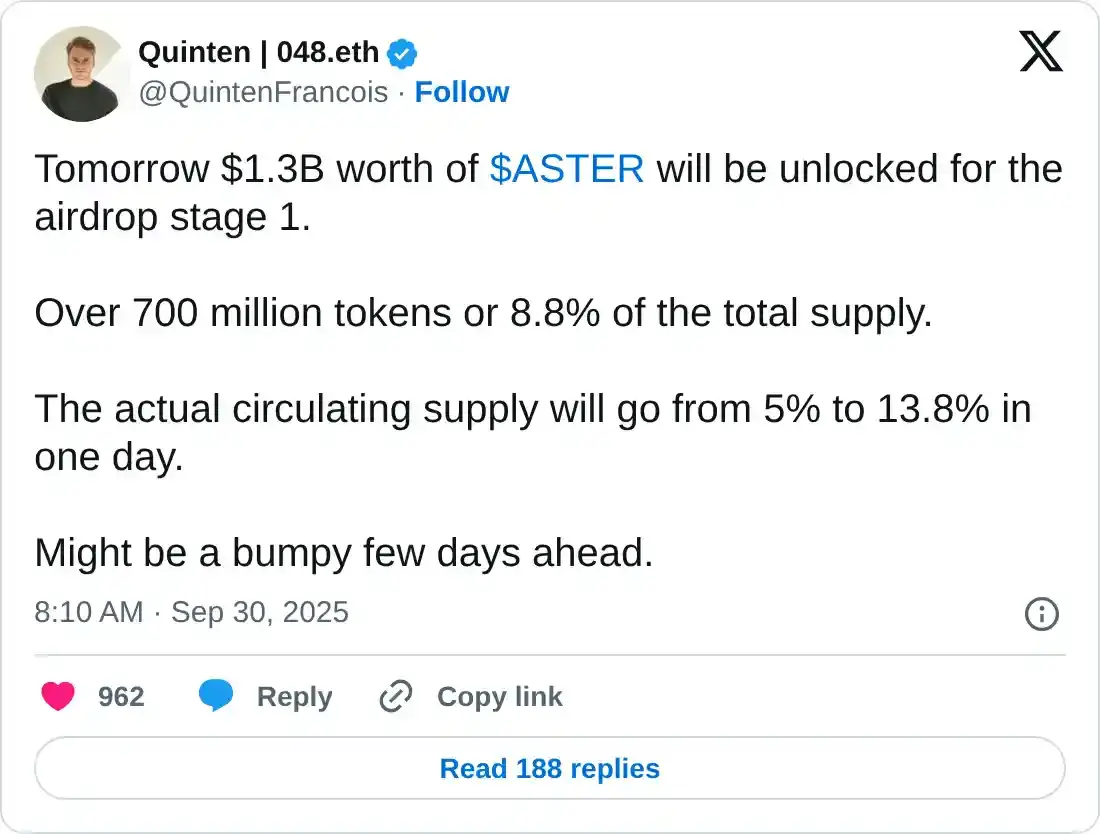
However, Wednesday's unlock only enables the withdrawal of airdropped tokens from the Token Generation Event (TGE), which were previously tradeable (part of the circulating supply), and do not add to the supply pressure. The 320 million ASTER tokens scheduled to be unlocked on Sunday will increase the circulating supply by 4%.
Finally, an unlock on October 17 will initiate a monthly release of tokens, starting with a batch of 183.13 million ASTER and followed by varying amounts between 123.09 million and 183.11 million tokens, released on the same date on a monthly basis.
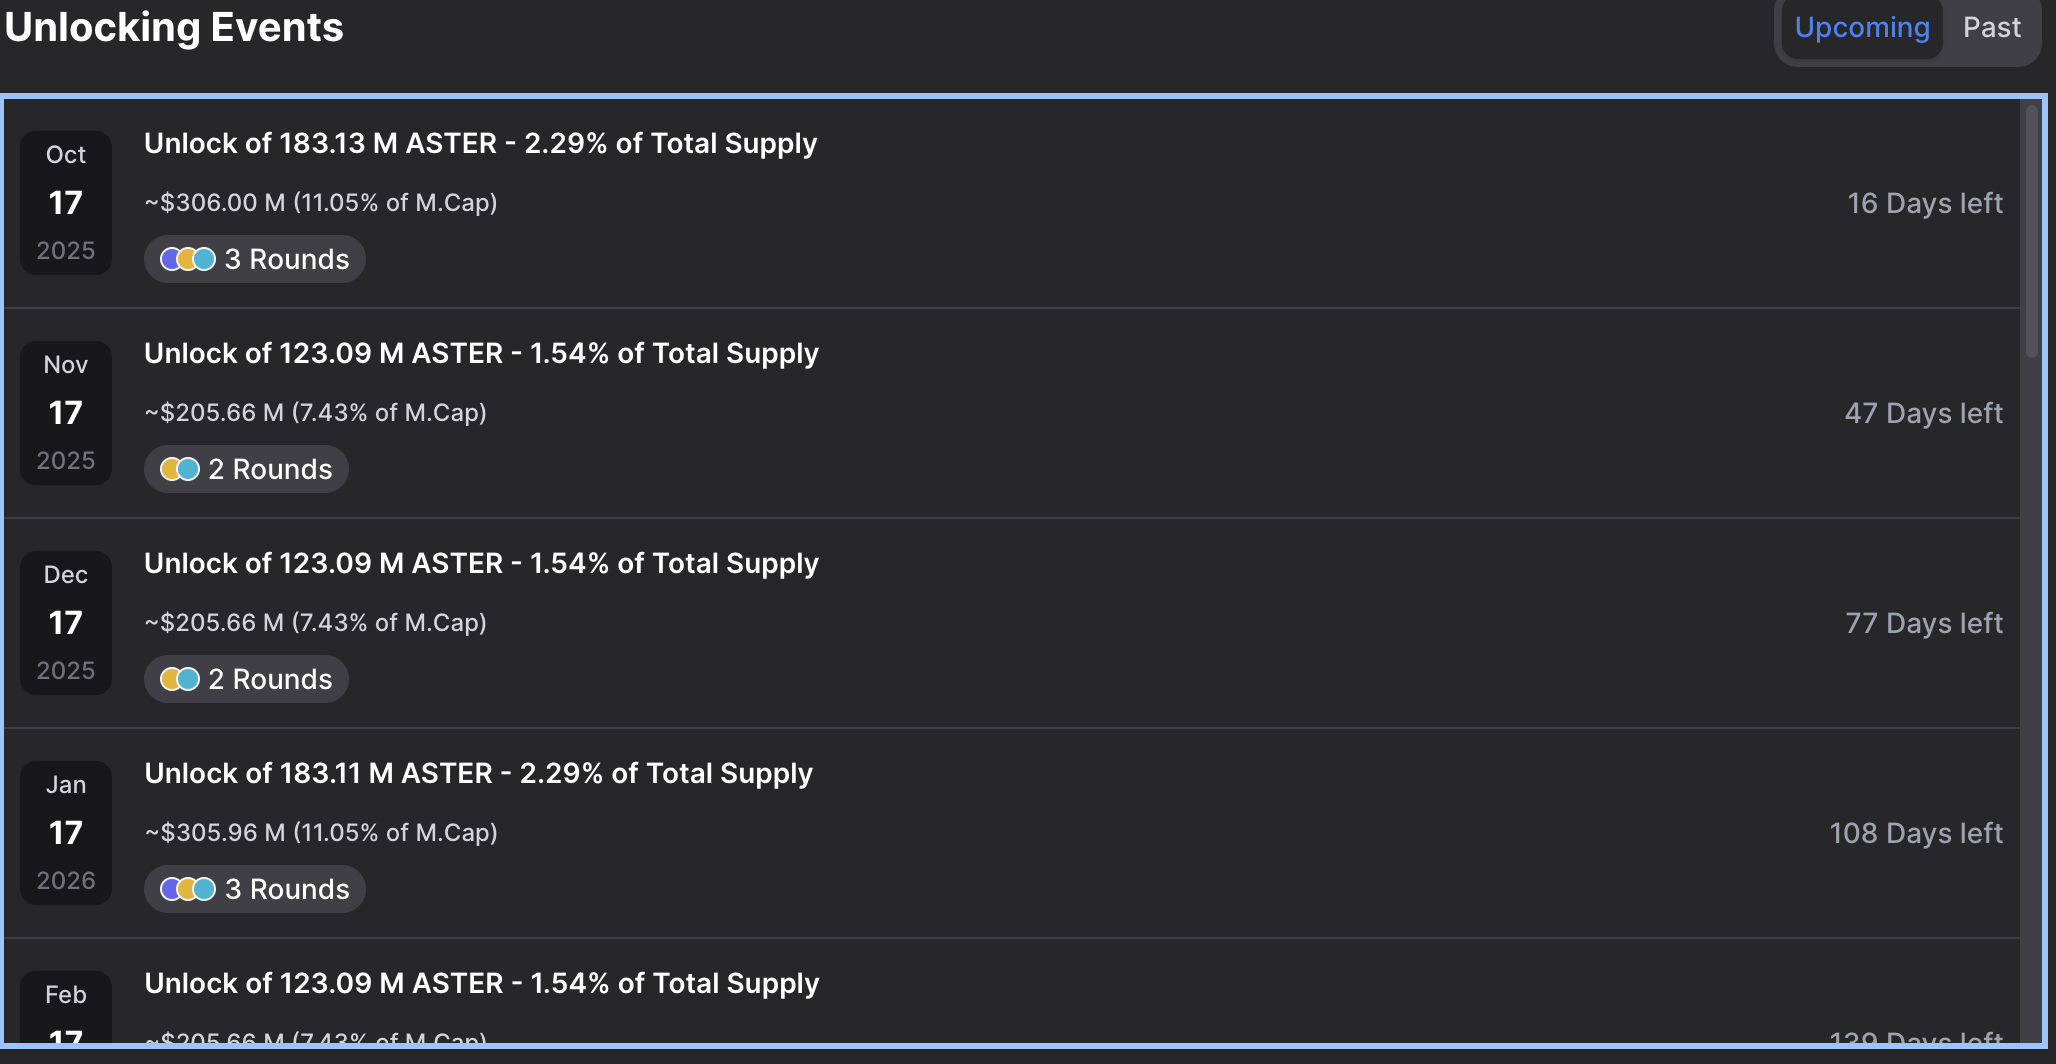
ASTER unlocking events. Source: DropsTab
Derivatives market data signals diminishing optimism
CoinGlass data shows that the ASTER Open Interest (OI) has dropped by 7.74% in the last 24 hours to $1.12 billion, indicating a capital outflow from the derivatives market. Such a large capital outflow signals a decline in traders’ interest.
Clarifying a decline in bullish interest, the OI-weighted funding rate drops to 0.0108% from 0.195% on Tuesday. Bulls pay the funding fees (positive) to keep the swap and spot prices aligned and offset the effect of leverage available in the derivatives market.
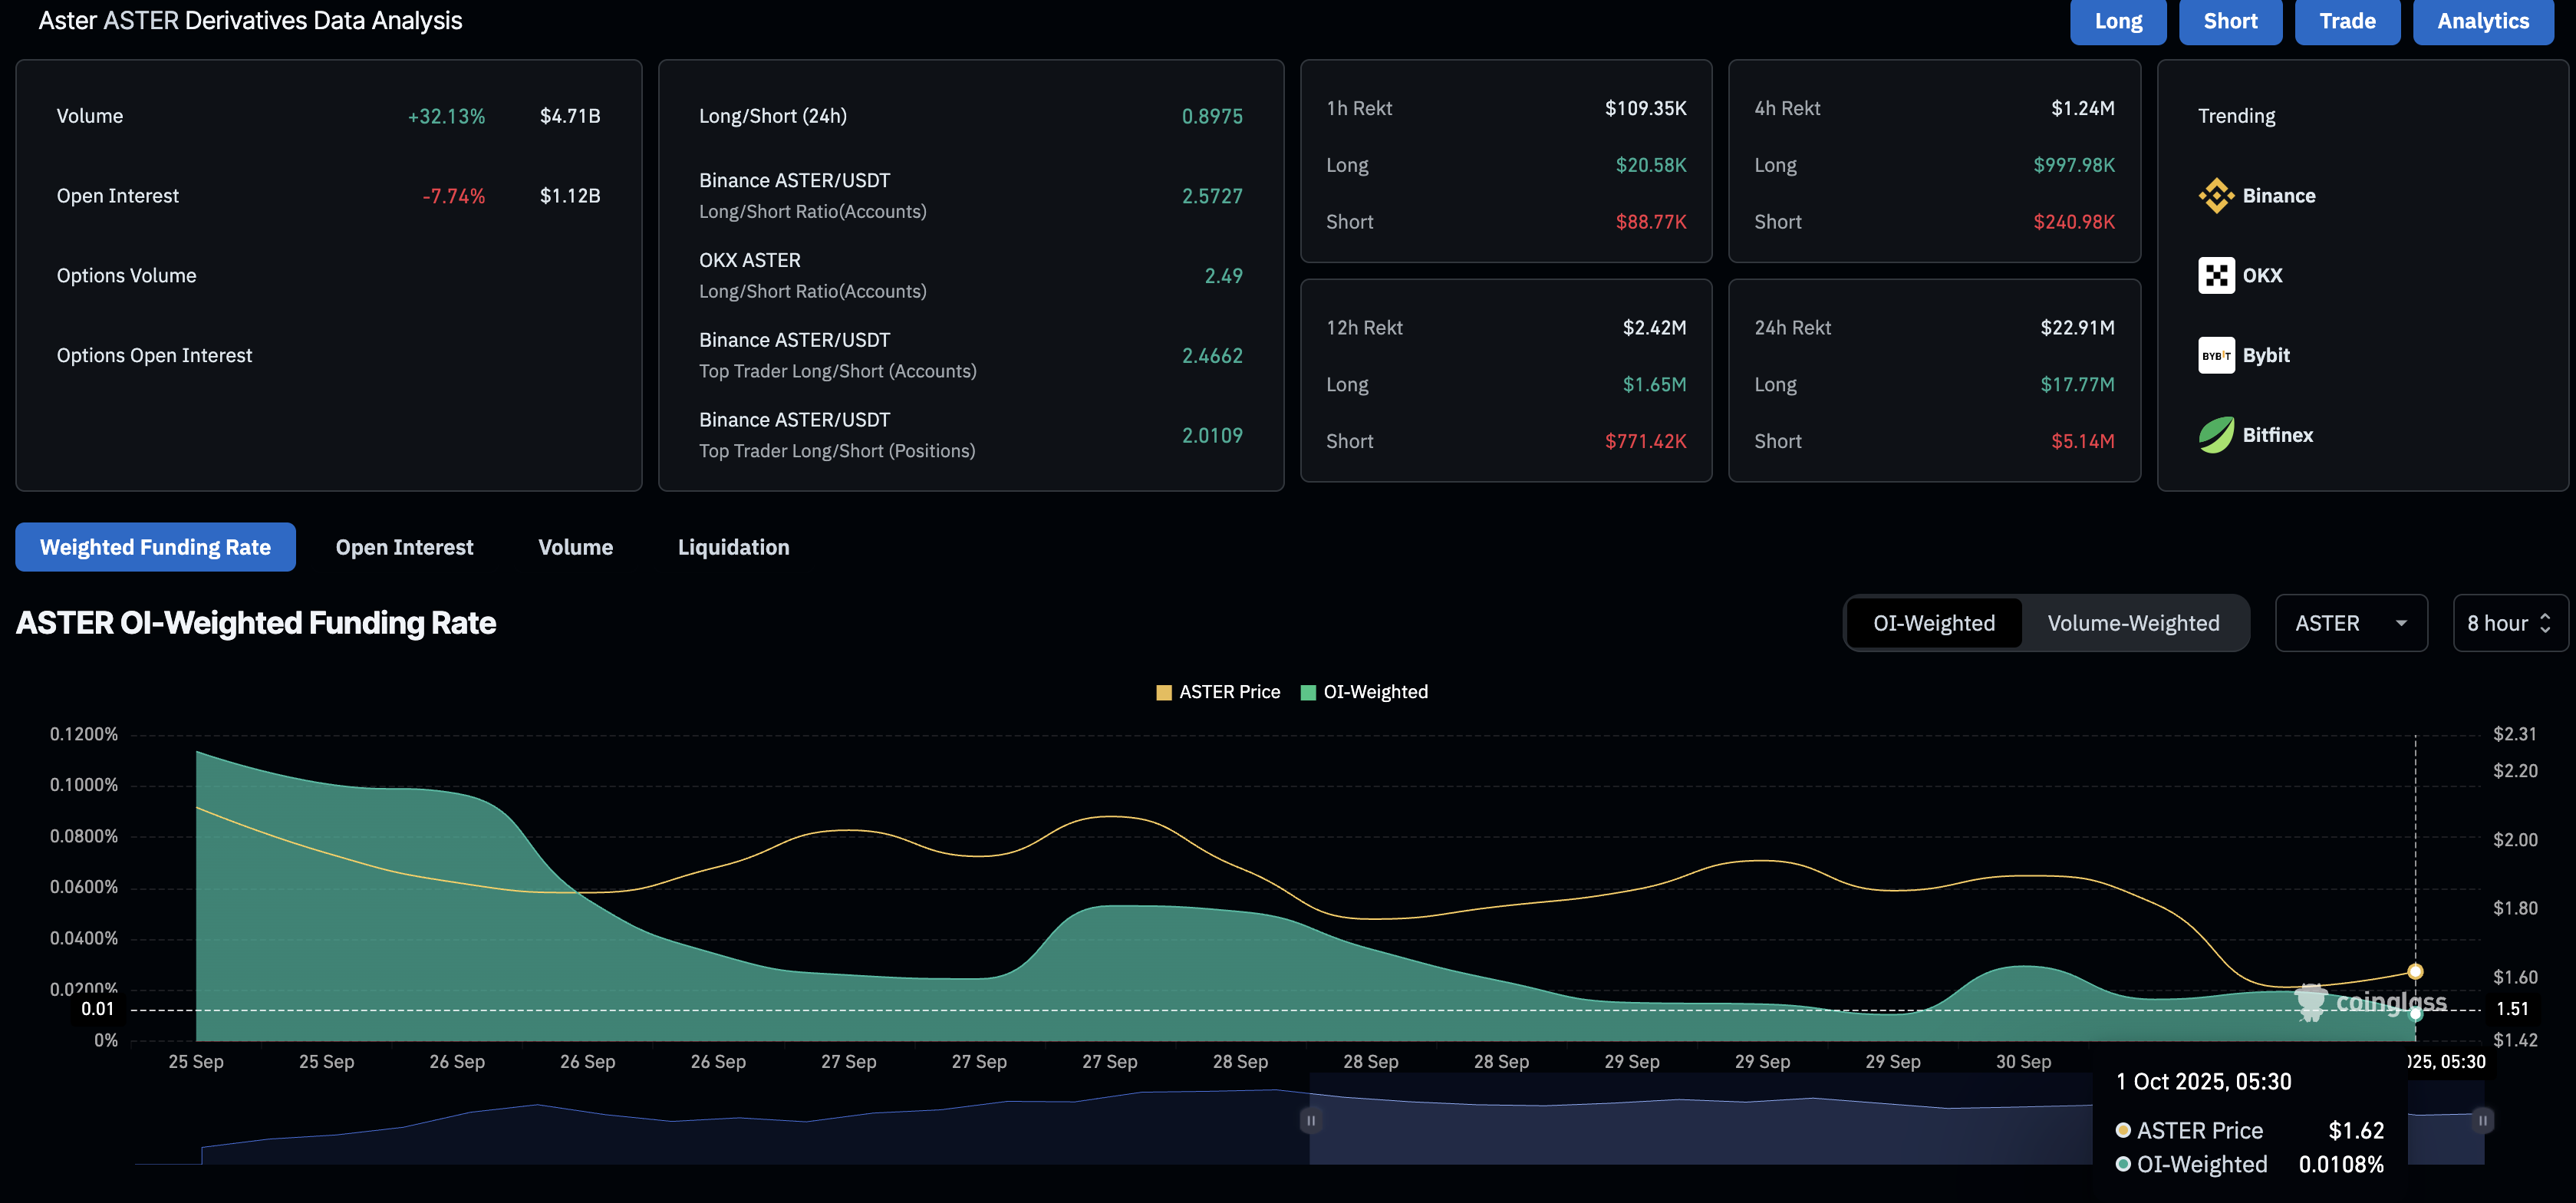
ASTER derivatives. Source: CoinGlass
Overall, the derivatives data suggest that the risk-on sentiment is weakening.
Aster rebounds within a falling channel ahead of Sunday’s token unlock
Aster bounces off the support trendline on the 1-hour chart, which forms a falling channel. The rebound signals the end of the recent downward move, which resulted in a Death Cross pattern on the same chart between the 50-period and 200-period Exponential Moving Averages.
The technical indicators on the 1-hour chart corroborate the revival of bullish momentum as the Relative Strength Index (RSI) at 45 displays a comeback from the oversold zone to a relatively neutral level. Additionally, the Moving Average Convergence Divergence (MACD) crosses above its signal line, indicating that the buyers are regaining trend control.
A potential extension on the upside could test the 50-period EMA at $1.7261, followed by the falling channel’s resistance trendline aligning with the Pivot Point indicator level at $1.8554.
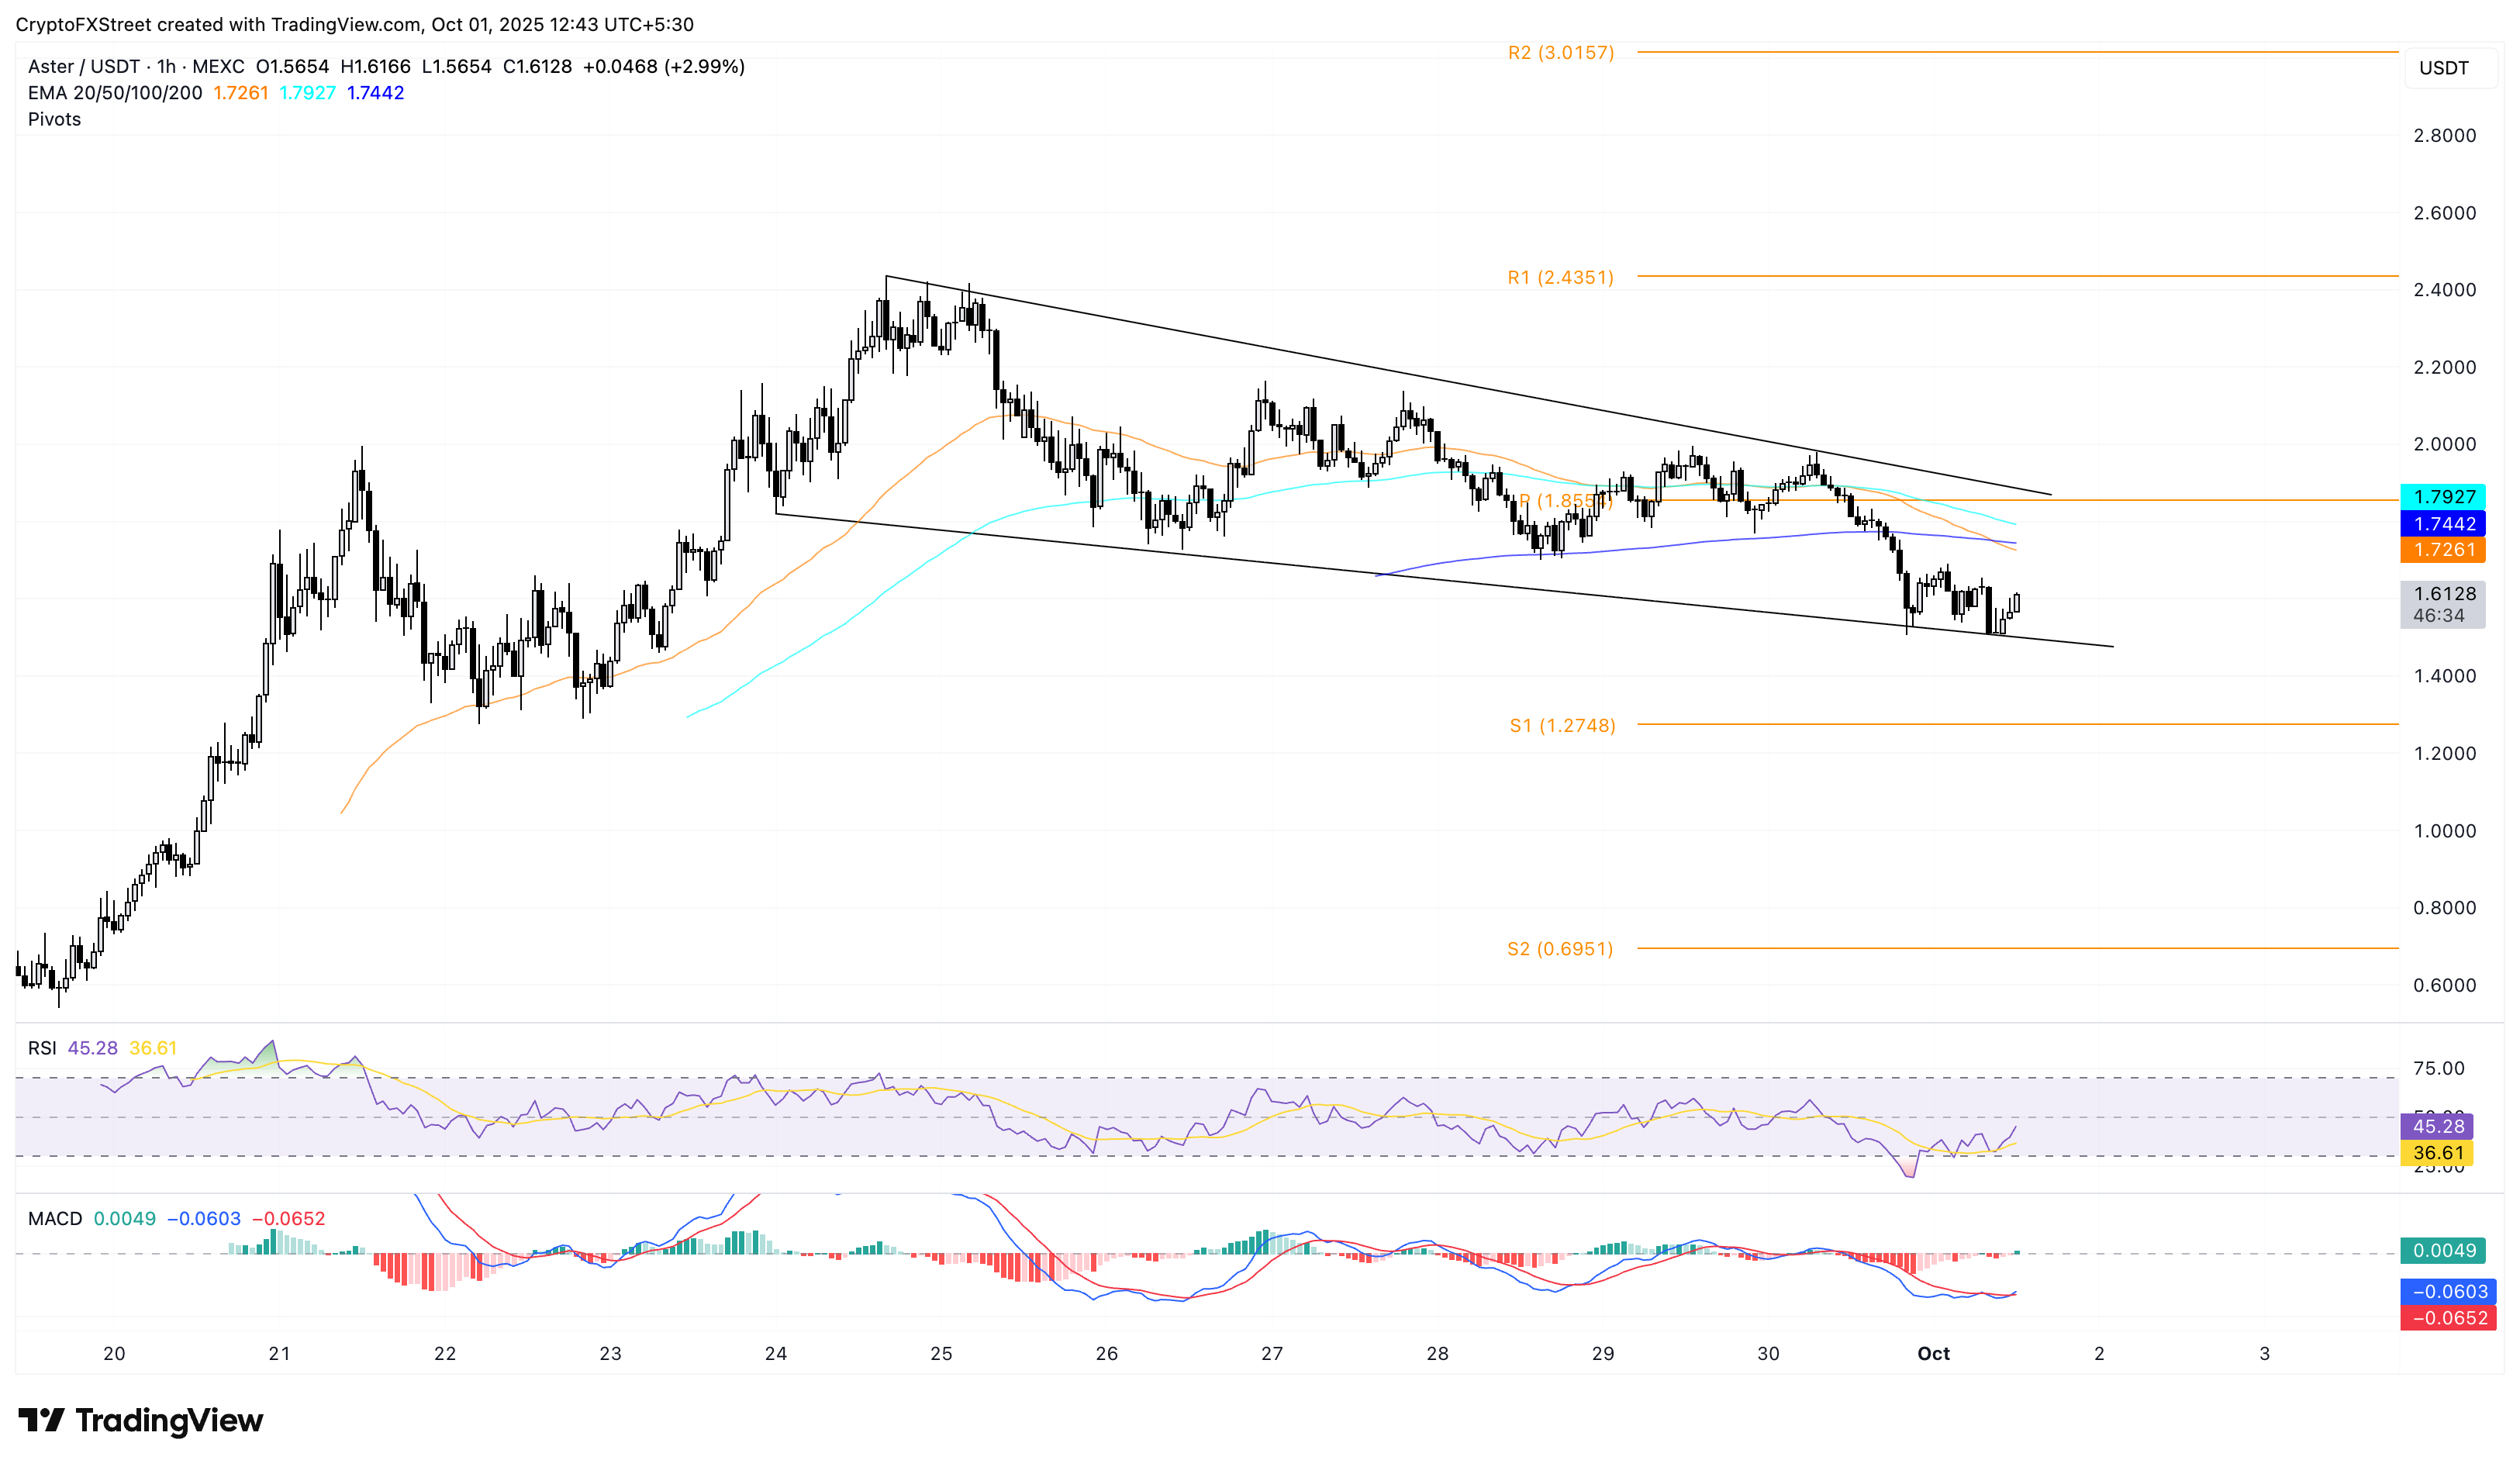
ASTER/USDT 1-hour price chart.
However, if the upcoming tokens unlock adds to supply pressure, then ASTER could test the support trendline near the $1.5000 psychological mark, followed by the S1 support level at $1.2748.
추천 기사


