
Crypto Today: Bitcoin eyes key support amid weak on-chain demand, as Ethereum, XRP trade choppy
- Bitcoin faces weakening speculative demand, increasing the risk of a further decline toward support around $103,000.
- Ethereum remains choppy between support at $4,000 and its record high of $4,950 despite steady ETF inflows.
- XRP trades above $3.00 pivot level, but downside risks persist, reflecting weak sentiment.
Bitcoin (BTC) extends price fluctuation trading above $110,000 on Wednesday, mirroring widespread uncertainty in the broader cryptocurrency market. Altcoins led by Ethereum (ETH) and Ripple (XRP) remain choppy at the time of writing.
Extended recovery remains uncertain due to prevailing market conditions, prompting caution among traders who have shifted their attention to the Federal Reserve (Fed) and its likely interest rate cuts in September, which would provide direction for risk assets like Bitcoin and cryptocurrencies.
Data spotlight: Bitcoin’s on-chain demand shrinking as Ethereum ETF inflows steady
Bitcoin’s run to new record highs of around $124,474 on August 14 was met by rampant profit-taking, especially from whales. This, coupled with risk-off sentiment due to macroeconomic uncertainty surrounding inflation, the job market, and interest rate cuts in the United States (US), contributed to the heightened price volatility.
According to Glassnode, Bitcoin is facing a pullback in the monthly average of change-adjusted transfer volume from approximately $26.7 billion to $23.2 billion. If the correction extends beneath the yearly average of $21.6 billion, it will confirm speculative activity is shrinking and indicate a wider contraction in on-chain demand.
Bitcoin Transfer Volume Momentum | Source: CoinGlass
Interest in Bitcoin has plummeted over the past weeks, as evidenced by spot Exchange Traded Funds (ETFs) outflows and low inflows. According to SoSoValue data, US spot ETFs saw $1.17 billion in total outflows last week, affirming the risk-off sentiment. Although the trend turned around on Monday and Tuesday with inflows of $219 million and $88 million, respectively, the uptake rate is significantly lower compared to May, June and July.
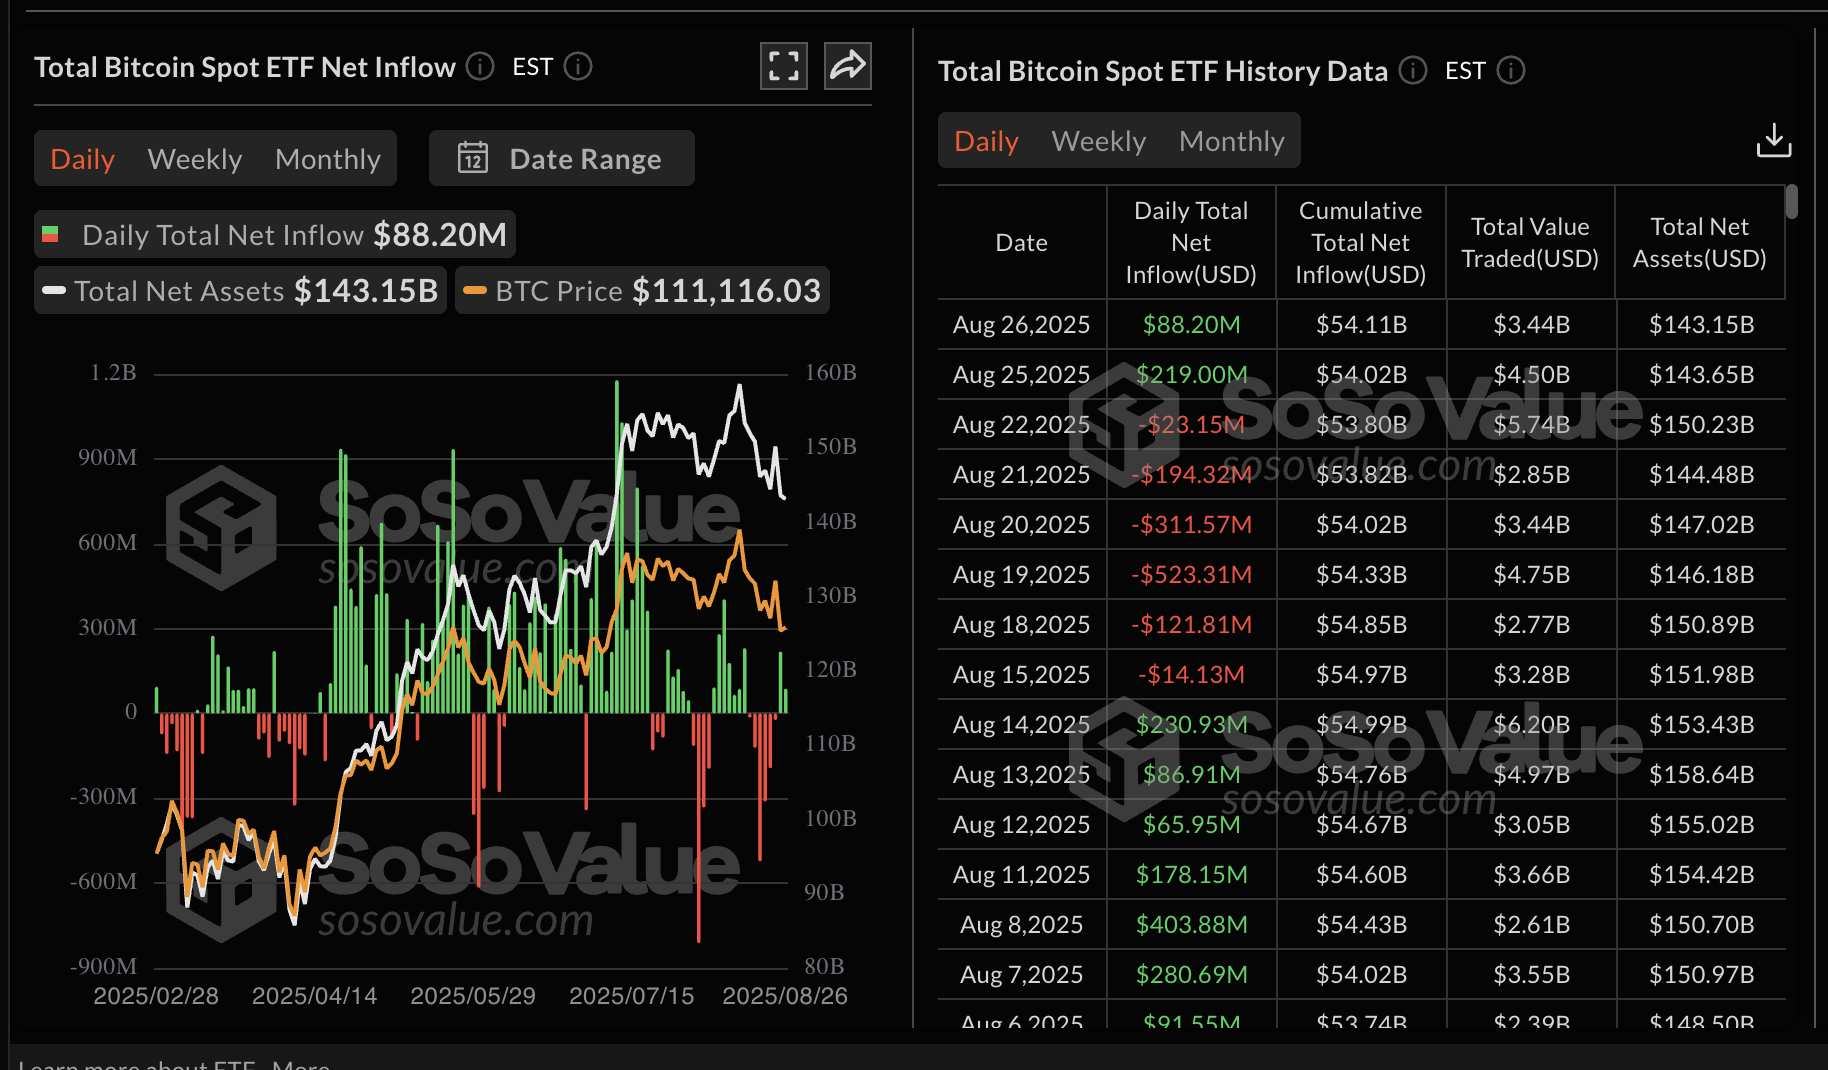
Bitcoin spot ETF data | Source: SoSoValue
Traders will be watching the recovery in ETF inflows in the coming days and weeks, heading toward the anticipated September interest rate cuts by the Federal Reserve (Fed), to gain insight into the direction of the trend.
Ethereum, on the other hand, boasts a stronger spot ETF inflow rate, with inflows stabilizing as of Thursday. Despite the ETH price reaching a new record of $4,955, institutional demand remains elevated, underpinned by the $455 million in inflows on Tuesday, bringing the total weekly net inflow to $899 million so far. Ethereum ETFs experienced net outflows of $238 million the previous week.
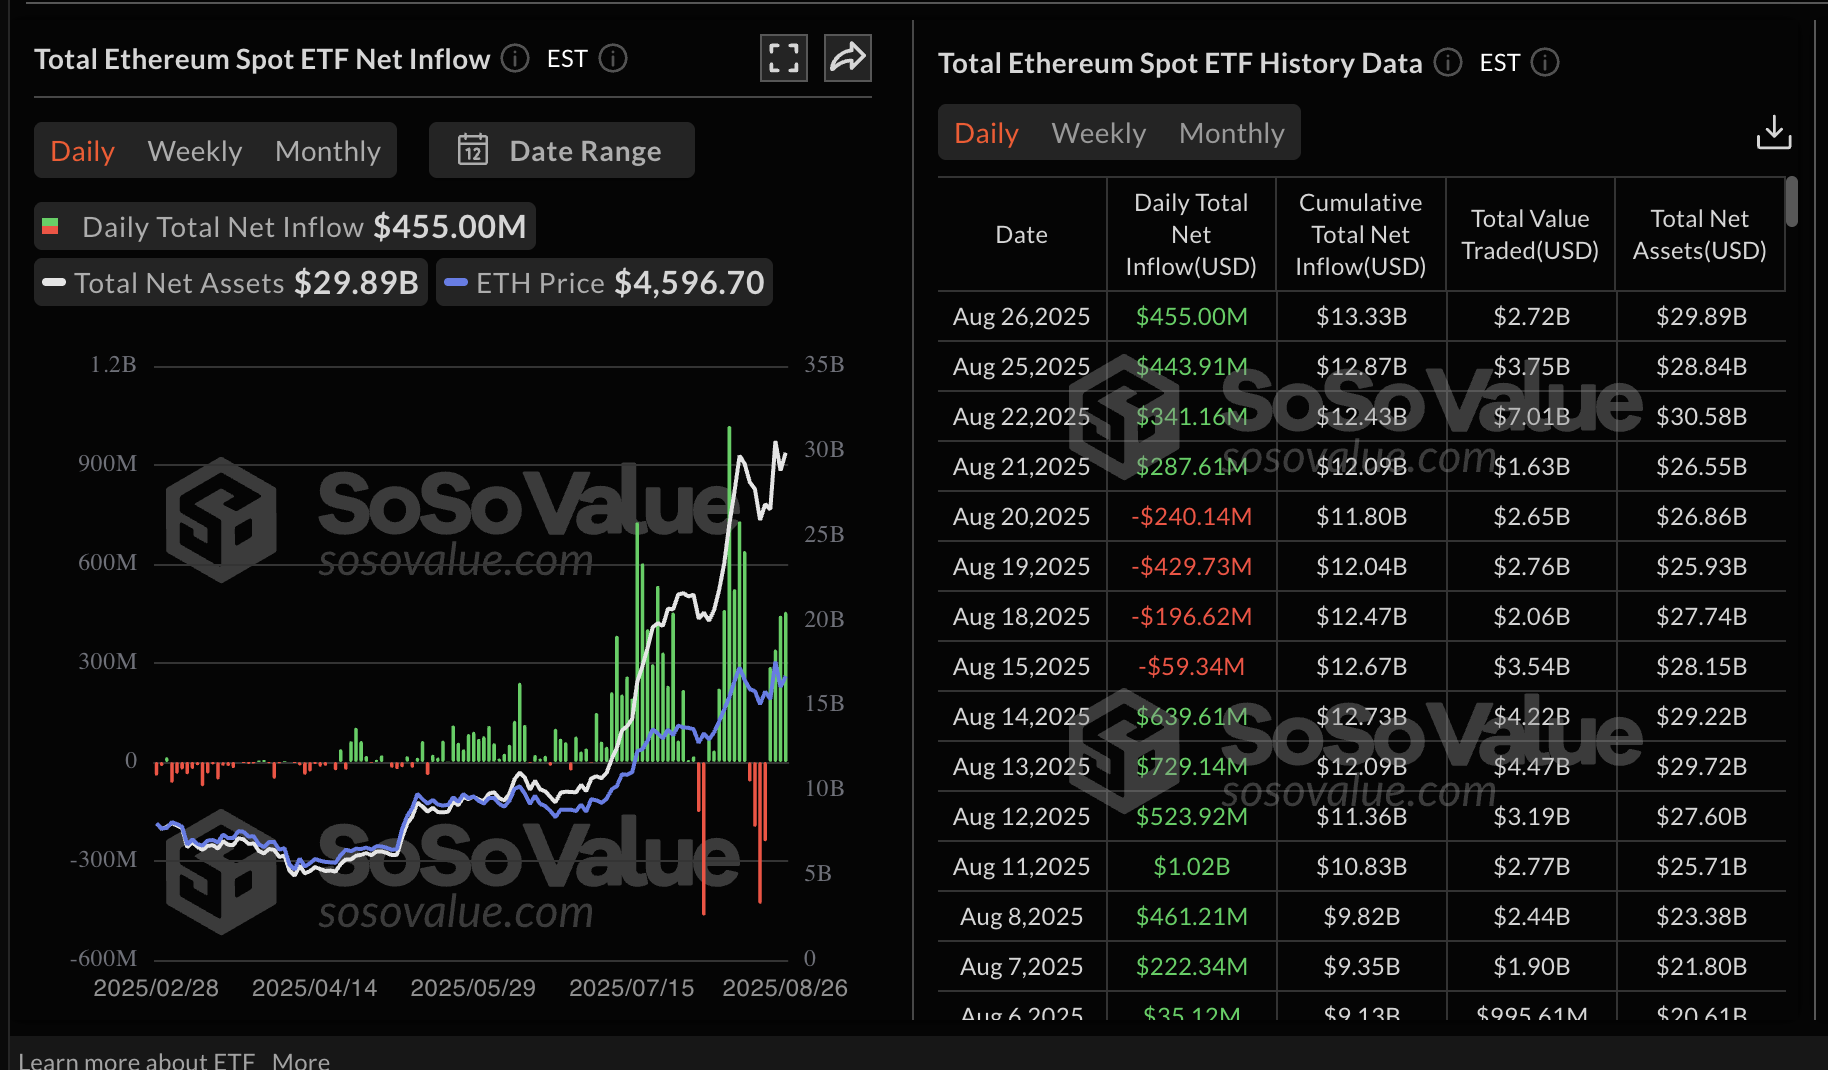
Ethereum spot ETF data | Source: SoSoValue
Chart of the day: Bitcoin risks extending decline
Bitcoin price holds above $110,000 amid heightened volatility and declining speculative demand. The daily chart below highlights a short-term support level at $108,666, tested on Tuesday, and resistance at $114,445, provided by the 50-day Exponential Moving Average (EMA).
The 100-day EMA provides short-term support at $110,834. Still, downside risks persist, particularly with the Moving Average Convergence Divergence (MACD) indicator maintaining a buy signal since August 17.
Investors will likely lean toward de-risking due to market uncertainty, as evidenced by the Relative Strength Index’s (RSI) extended decline into the bearish region. Further correction targeting oversold territory would indicate a significant reduction in speculative demand.
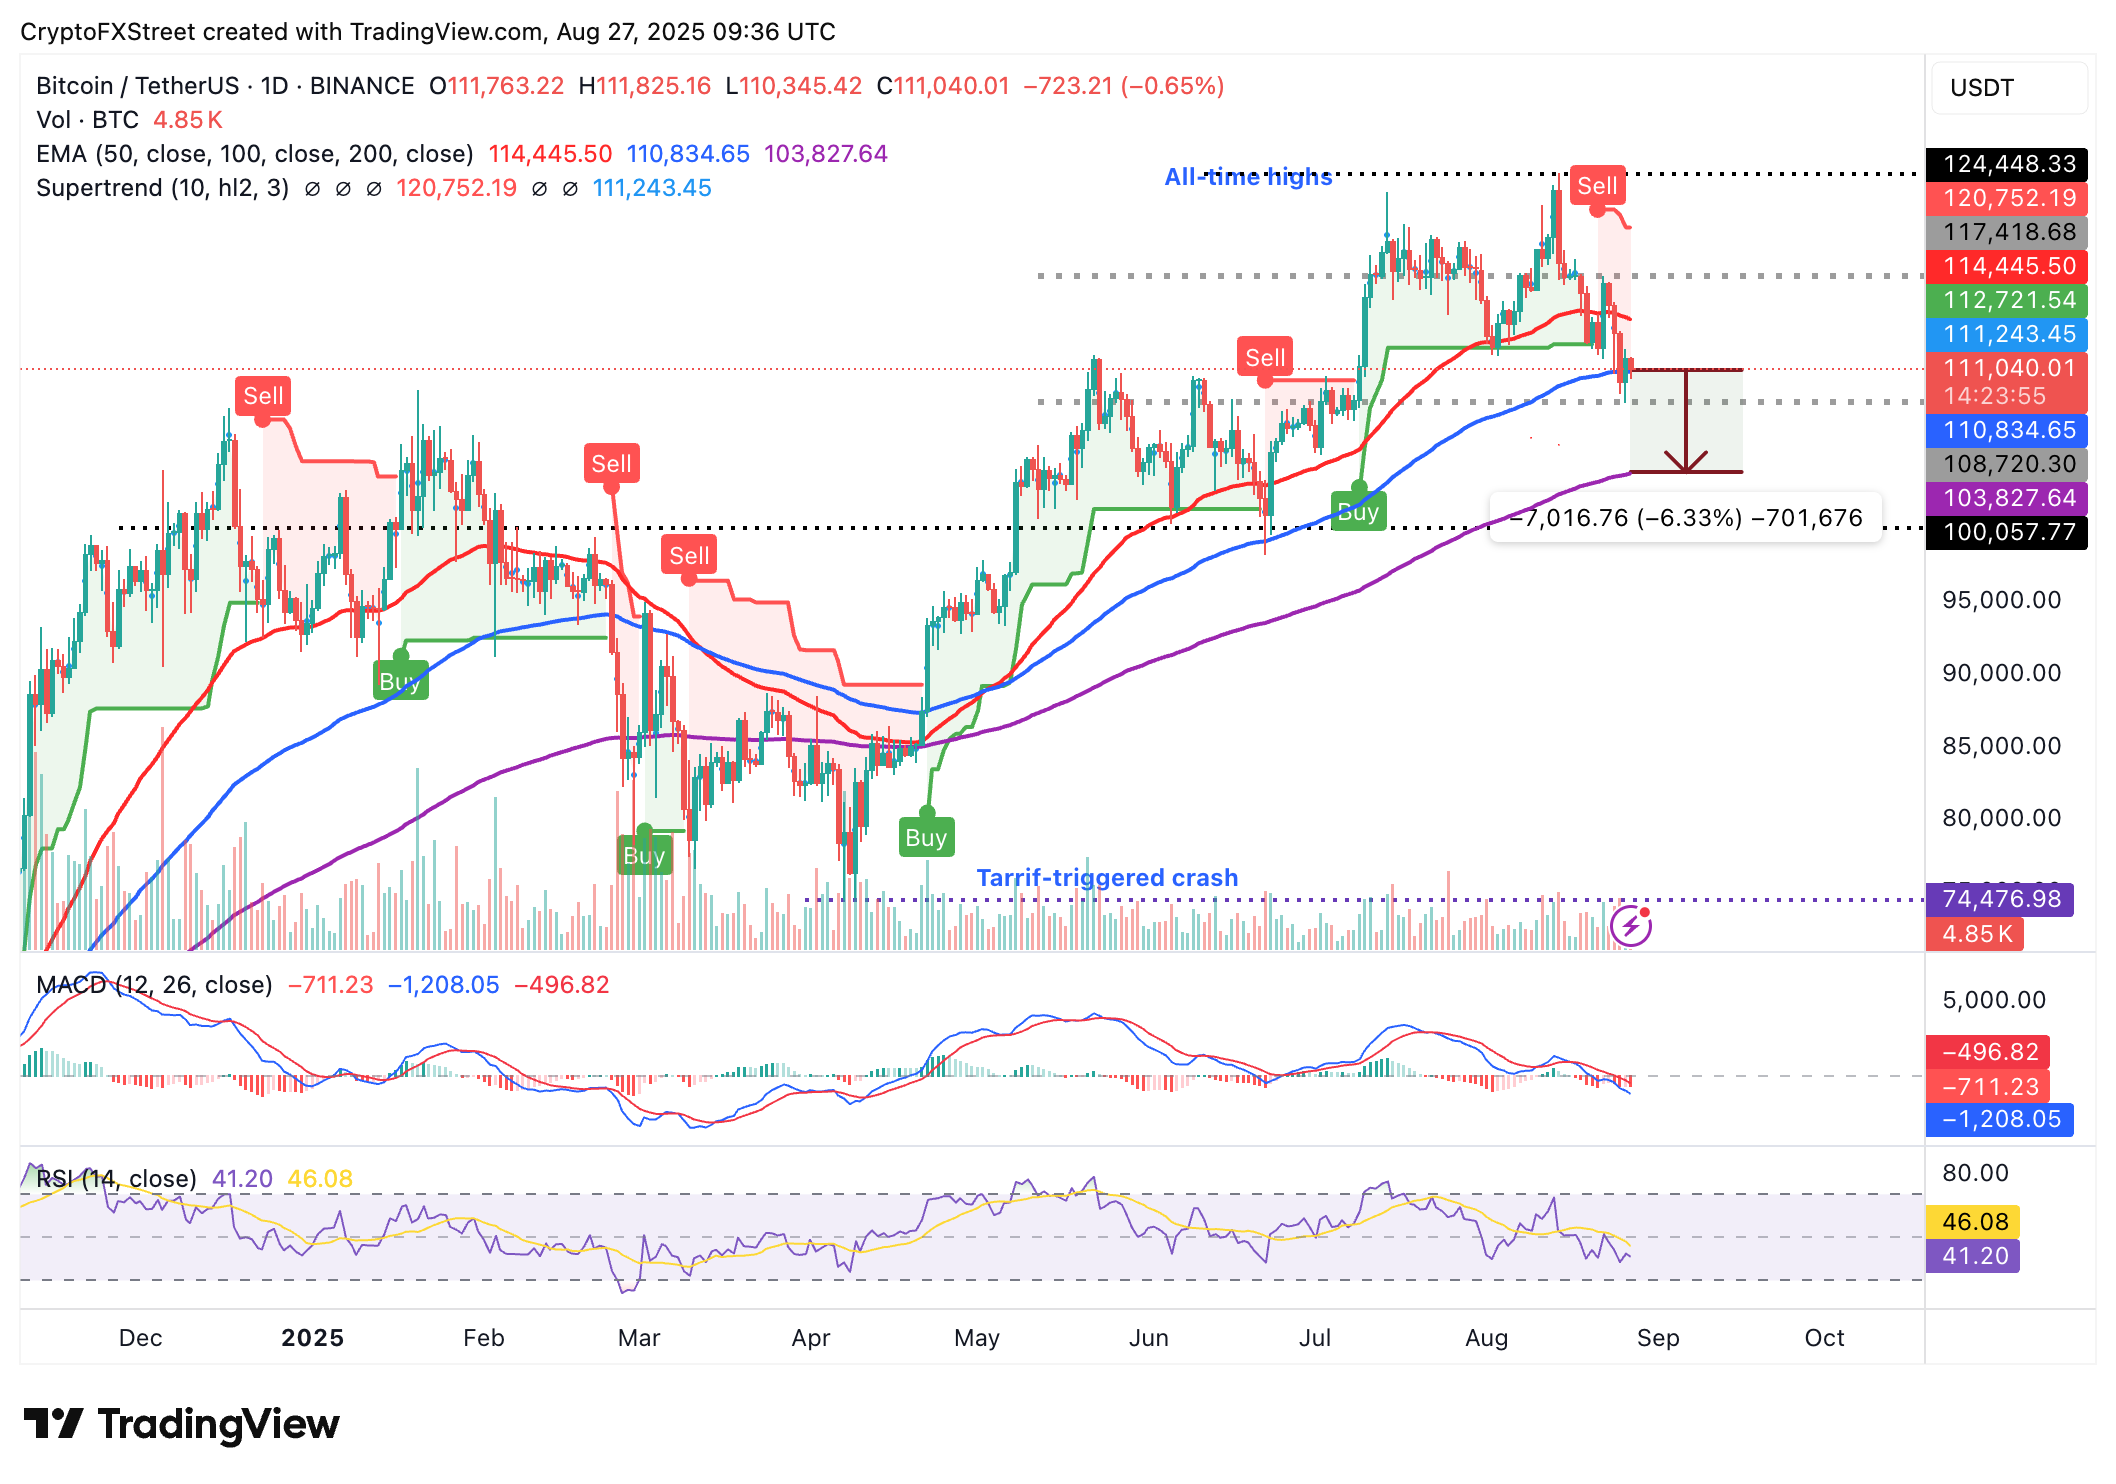
BTC/USDT daily chart
Should the support at $108,666 fail to hold, traders will shift their focus to the next key level at $103,834 as highlighted by the 200-day EMA. A 6% decline from the current level could present new entry opportunities and increase the likelihood of a strong recovery toward $120,000.
Altcoins update: Ethereum, XRP eye recovery to record highs
Ethereum price is trading above $4,600 at the time of writing, buoyed by positive sentiment and steady institutional demand. Despite bullish sentiment, micro indicators such as the MACD and the RSI suggest that the decline could continue in the short term.
For instance, the MACD indicator shows a sell signal confirmed on Monday while the RSI fluctuates between the midline and overbought territory. If traders closely monitor these technical indicators, risk-off sentiment could persist, leaving ETH susceptible to further decline toward range support at $4,000. The 50-day EMA at $3,916 is in line to absorb the selling pressure if the decline accelerates due to potential profit-taking.
On the bright side, Ethereum is positioned above key moving averages, including the 50-day, 100-day, and 200-day EMAs, all of which are upward-facing, indicating strong bullish sentiment. A break above the $5,000 level could launch Ethereum into the price discovery phase, making long positions significantly attractive to investors.
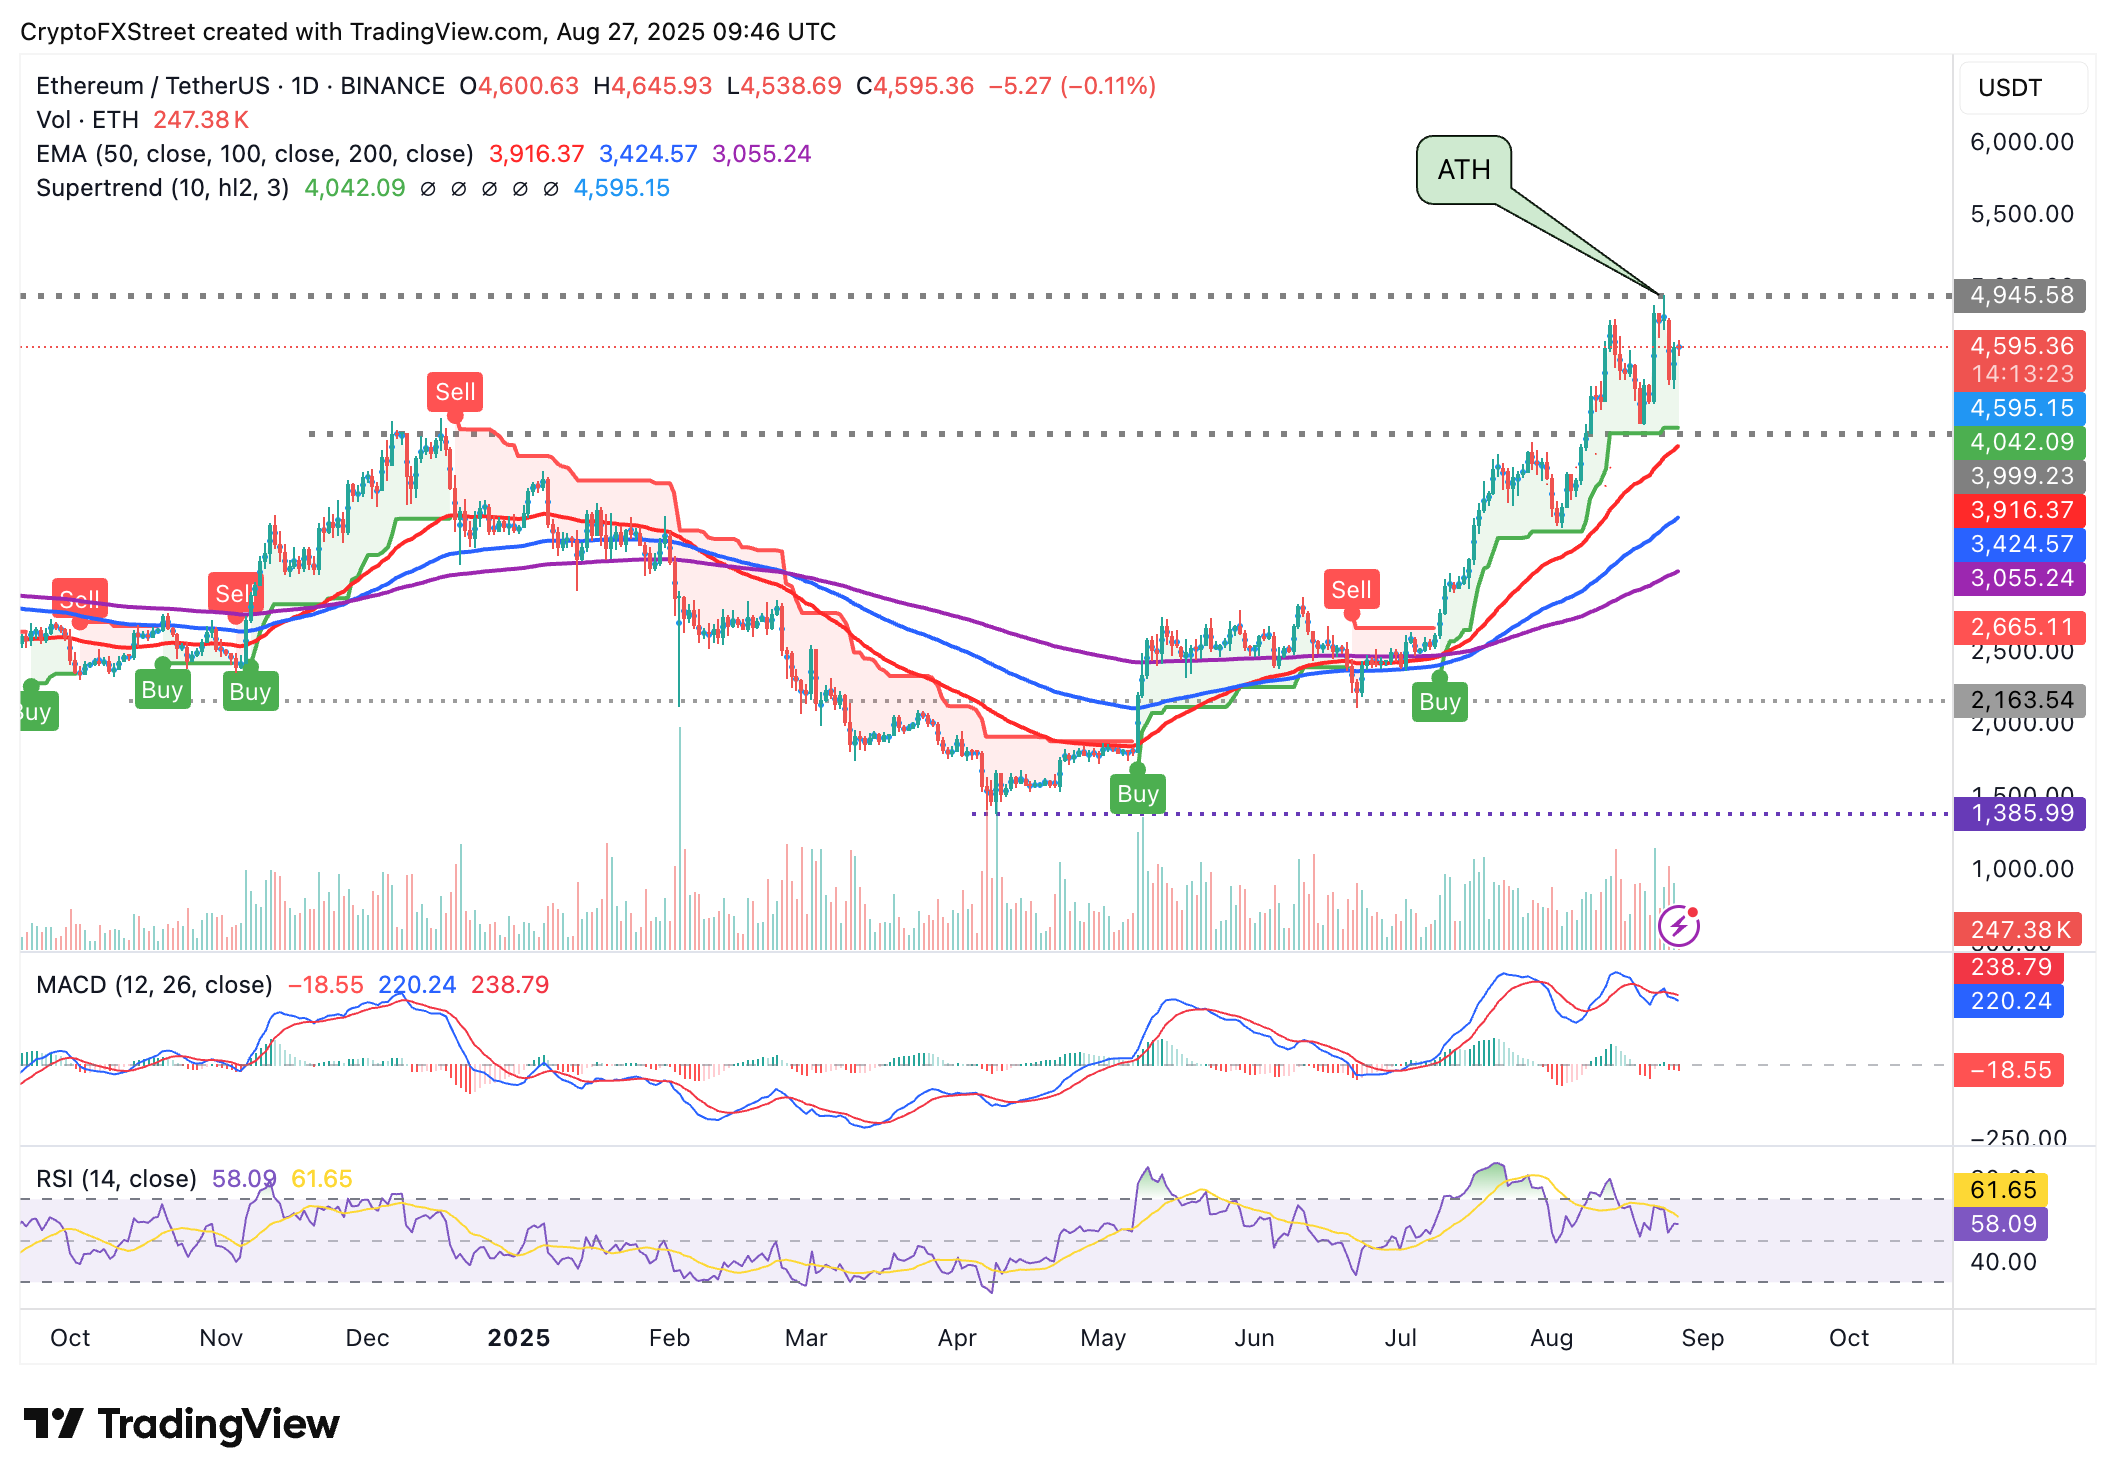
ETH/USDT daily chart
As for XRP, the price is consolidating slightly above $3.00, indicating a lack of conviction in the uptrend. The token also holds above support at $2.95 provided by the 50-day EMA, which could protect investors against downside risks.
The MACD indicator remains stable around the zero line, yet it still upholds a sell signal, likely encouraging risk-off sentiment among traders.
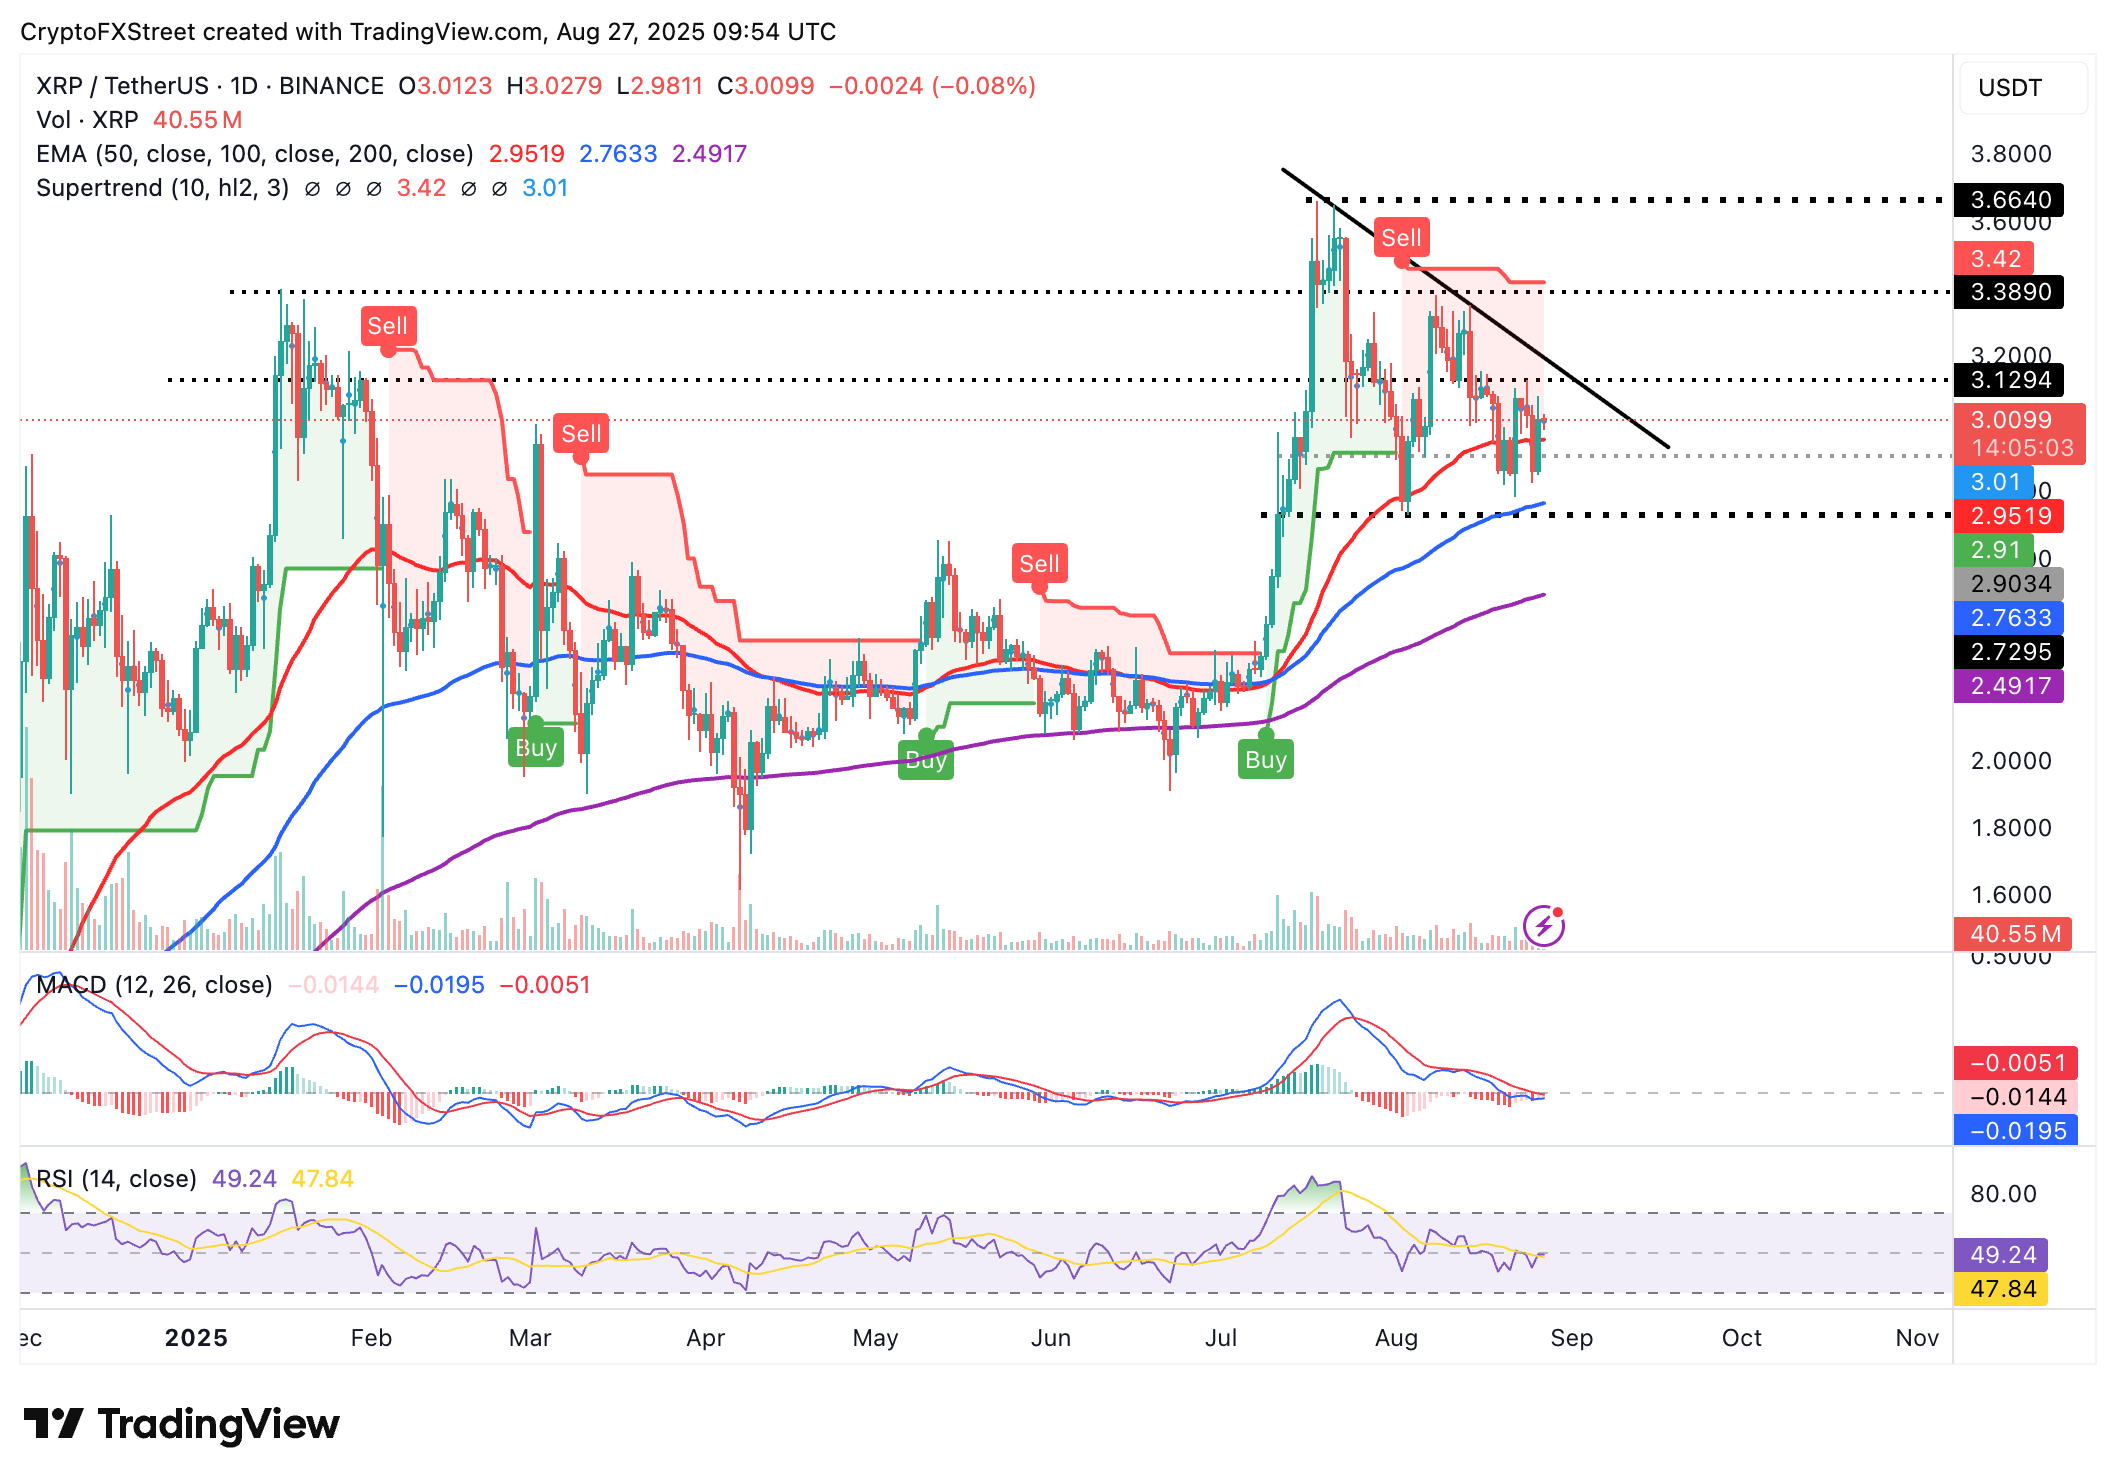
XRP/USDT daily chart
If the RSI gains momentum above the midline and the blue MACD line flips above the red signal line, the path of least resistance could remain upward, increasing the chances of XRP extending recovery above the short-term hurdle at $3.12, tested on Sunday and $3.38, tested on August 8.
Bitcoin, altcoins, stablecoins FAQs
Bitcoin is the largest cryptocurrency by market capitalization, a virtual currency designed to serve as money. This form of payment cannot be controlled by any one person, group, or entity, which eliminates the need for third-party participation during financial transactions.
Altcoins are any cryptocurrency apart from Bitcoin, but some also regard Ethereum as a non-altcoin because it is from these two cryptocurrencies that forking happens. If this is true, then Litecoin is the first altcoin, forked from the Bitcoin protocol and, therefore, an “improved” version of it.
Stablecoins are cryptocurrencies designed to have a stable price, with their value backed by a reserve of the asset it represents. To achieve this, the value of any one stablecoin is pegged to a commodity or financial instrument, such as the US Dollar (USD), with its supply regulated by an algorithm or demand. The main goal of stablecoins is to provide an on/off-ramp for investors willing to trade and invest in cryptocurrencies. Stablecoins also allow investors to store value since cryptocurrencies, in general, are subject to volatility.
Bitcoin dominance is the ratio of Bitcoin's market capitalization to the total market capitalization of all cryptocurrencies combined. It provides a clear picture of Bitcoin’s interest among investors. A high BTC dominance typically happens before and during a bull run, in which investors resort to investing in relatively stable and high market capitalization cryptocurrency like Bitcoin. A drop in BTC dominance usually means that investors are moving their capital and/or profits to altcoins in a quest for higher returns, which usually triggers an explosion of altcoin rallies.
추천 기사


