
Meme Coin Gainers: PUMP, REKT, BRETT break out in double-digit gains
- Pump.fun makes a strong rebound, surging by over 15% on Thursday.
- Rekt extends bullish phases, hitting new all-time highs as investor risk appetite returns.
- Ethereum-based meme coin Brett breaks out, backed by multiple buy signals and robust moving average support.
Meme coins, led by Pump.fun (PUMP), Rekt (REKT) and Brett (BRETT), are leading recovery in the cryptocurrency market on Thursday following a short-lived sell-off the previous day.
The macro tension surrounding Wednesday's United States (US) Federal Reserve (Fed) decision on interest rates left many investors on edge despite a consensus that the central bank would maintain rates steady within the 4.25% to 4.50% range.
Fed Chair Jerome Powell took a hawkish stance, casting doubt on the possibility of a rate cut in September, amid concerns about inflation. The central bank continues to shrug off President Donald Trump’s call for rate cuts, emphasizing its role of keeping inflation anchored in the long term.
Meme coins PUMP, REKT and BRETT edge higher
PUMP is the most bullish meme coin on Thursday, rising over 15% to trade at $0.0031. The uptick follows a major correction from its all-time high of $0.0068, reached on July 15 after the token launch event.
The token native to the meme coin launchpad Pump.fun currently holds above a short-term support provided by the 50-period Exponential Moving Average (EMA) at $0.0030 on the 4-hour chart.
The Moving Average Convergence Divergence (MACD) indicator maintains a buy signal in the 4-hour time frame, with the blue line holding above the red signal line. If investors heed the call to increase exposure, bullish momentum will steady and accelerate the recovery toward the 100-period EMA resistance at $0.0038.
Traders should be wary of the possibility of a reversal below the initial 50-period EMA. In case investors sell at the earliest sign of profit, a trend reversal could ensue, aiming for a retest of support at $0.0022.
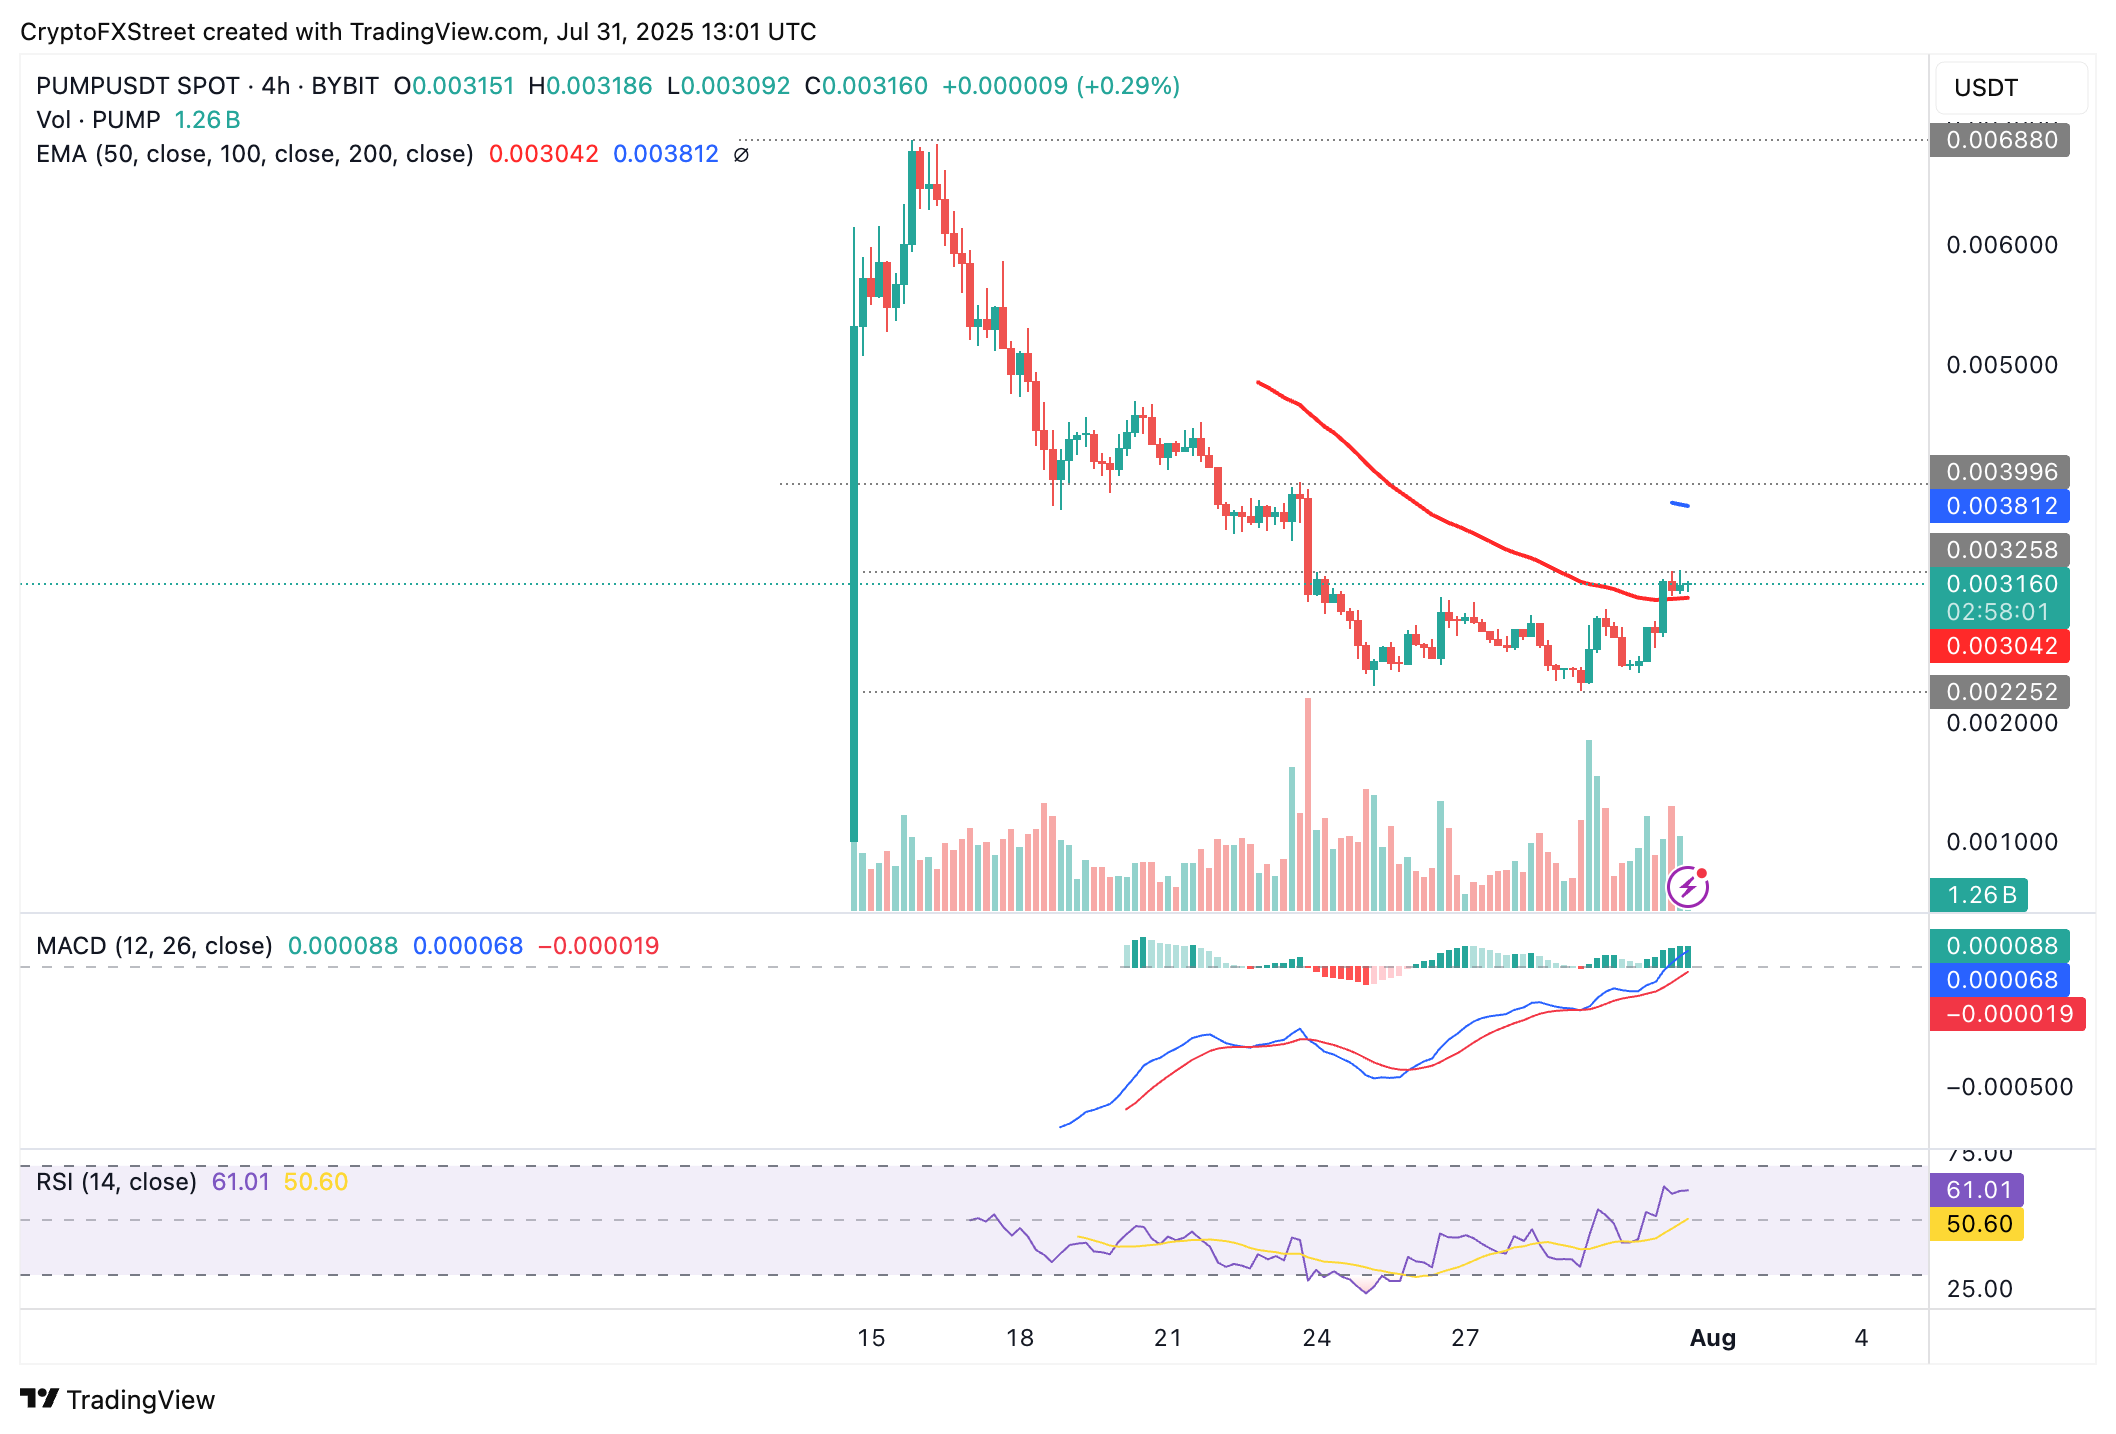
PUMP/USDT 4-hour chart
As for REKT, the uptrend shows signs of faltering after reaching a new record high of $0.000001233. The meme coin hovers at $0.000001096, underpinned by the Relative Strength Index (RSI) showing weakness after tagging overbought territory and declining shortly after.
If investors hold steady, with conviction that REKT could push higher into price discovery, the minor drawdown could give way for a trend reversal. The MACD still upholds a buy signal, triggered on Thursday when the blue line crossed and settled above the red signal.
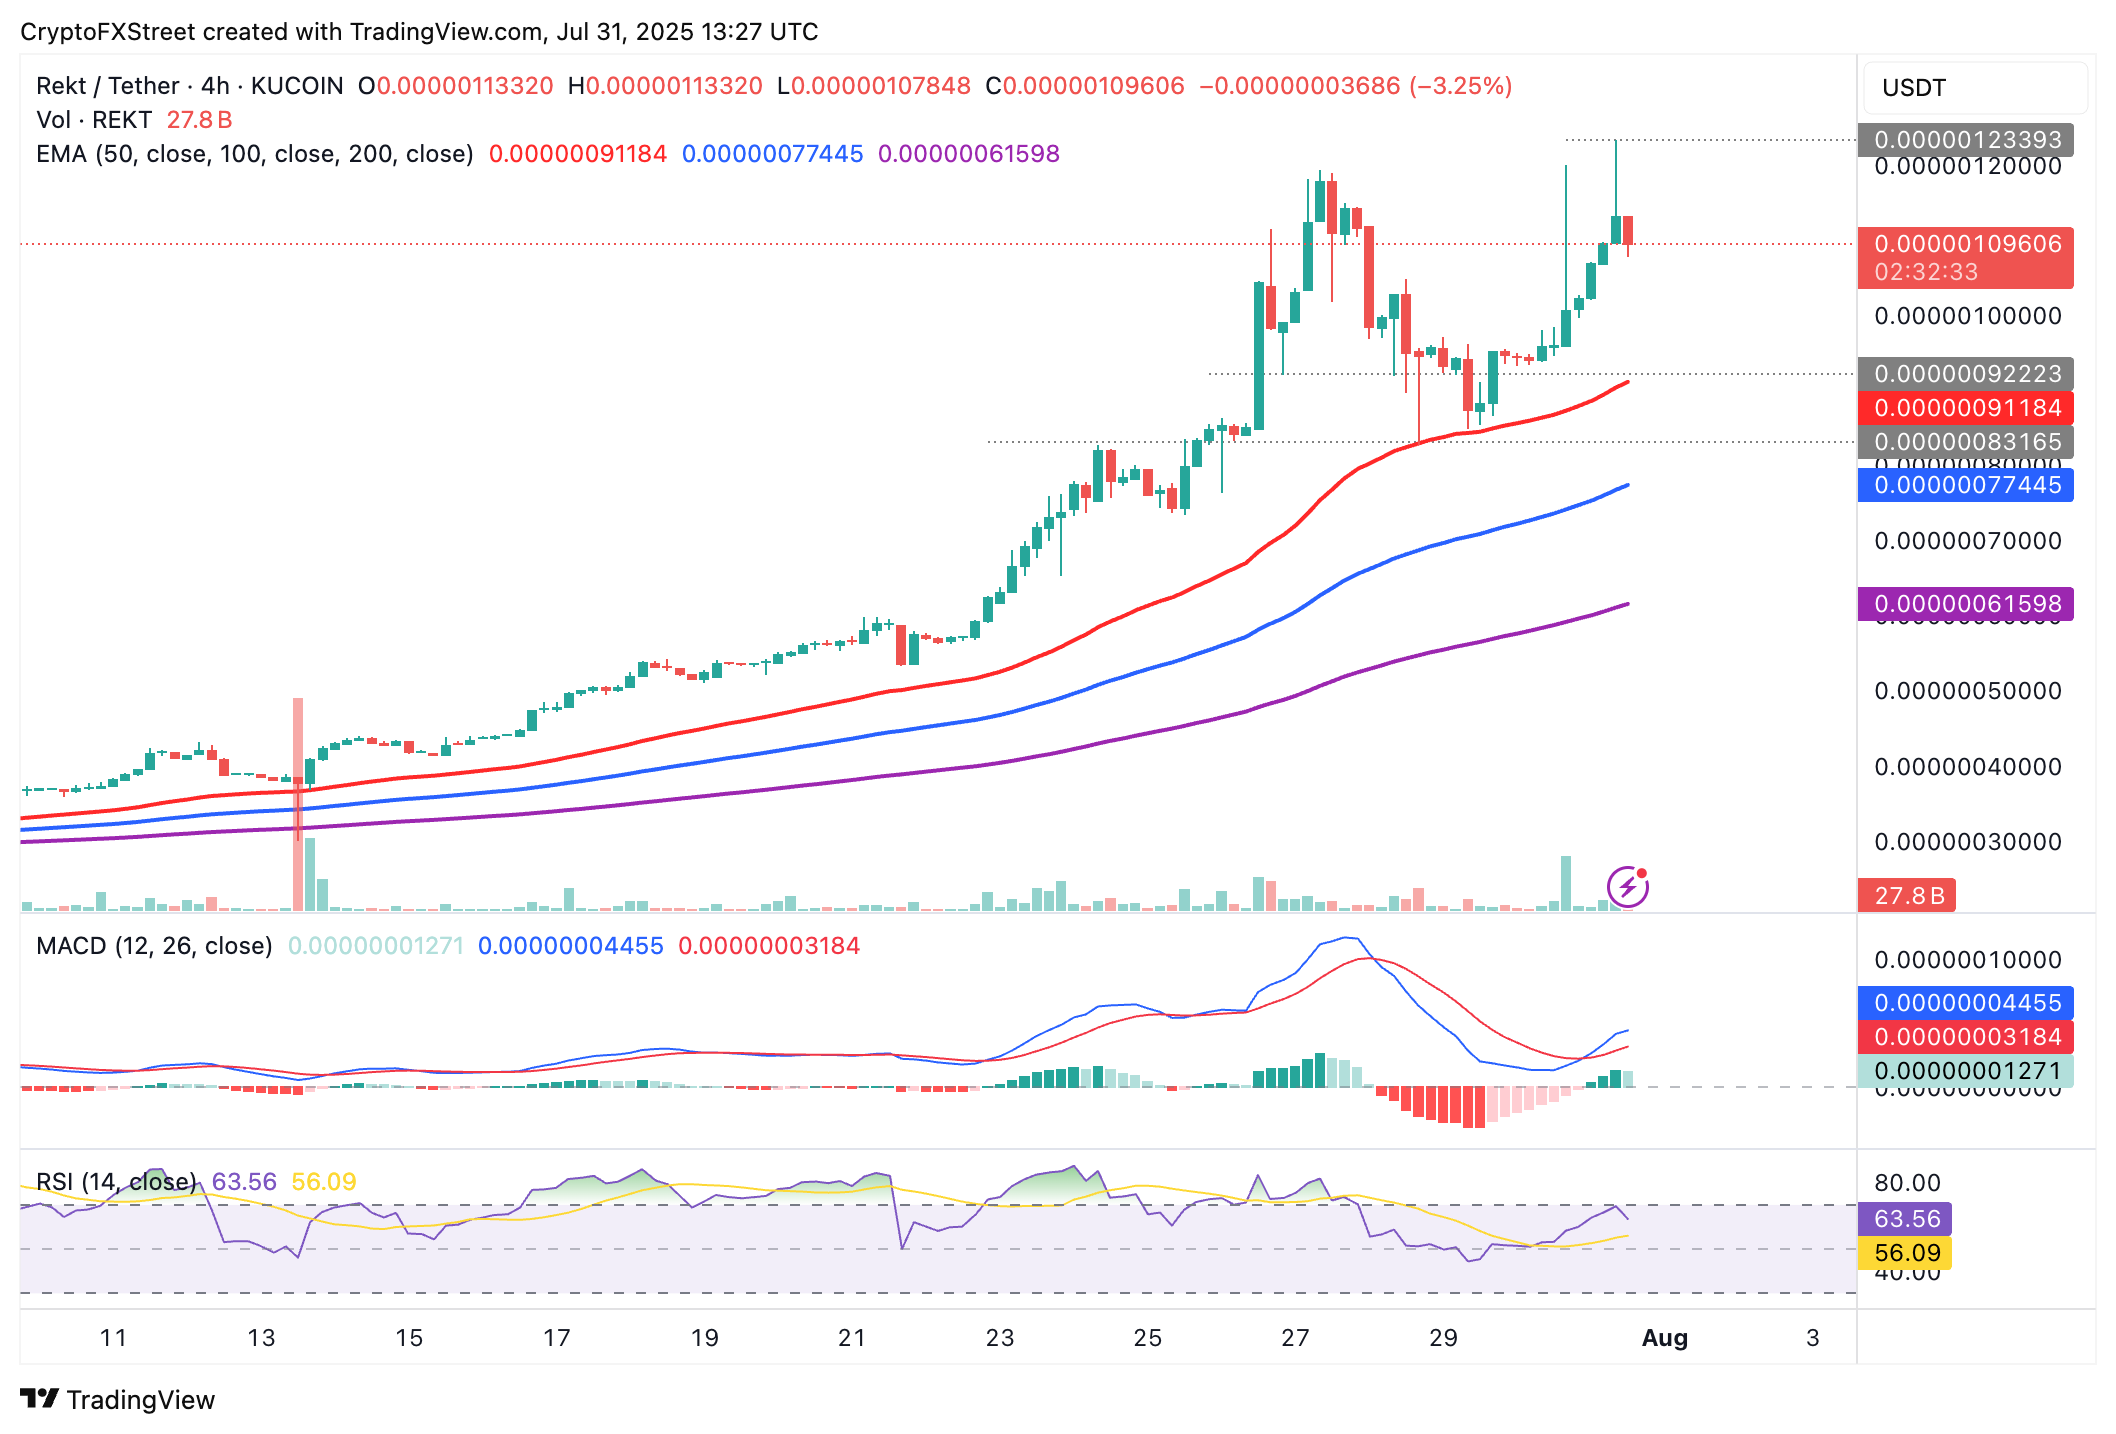
REKT/USDT 4-hour chart
Brett, on the other hand, is trimming its intraday gains quickly, indicating a volatility spike in the meme coin sector at the time of writing. The token is currently trading at $0.0565 and holding above an initial support provided by the 100-period EMA at $0.0561.
The MACD indicator backs the uptrend as it ascends near the zero line after validating a buy signal in earlier sessions. If the short-term support at $0.561 remains intact and bulls scoop the token at a lower price level, a recovery could follow, aiming for highs around $0.0667, which was tested on July 23.
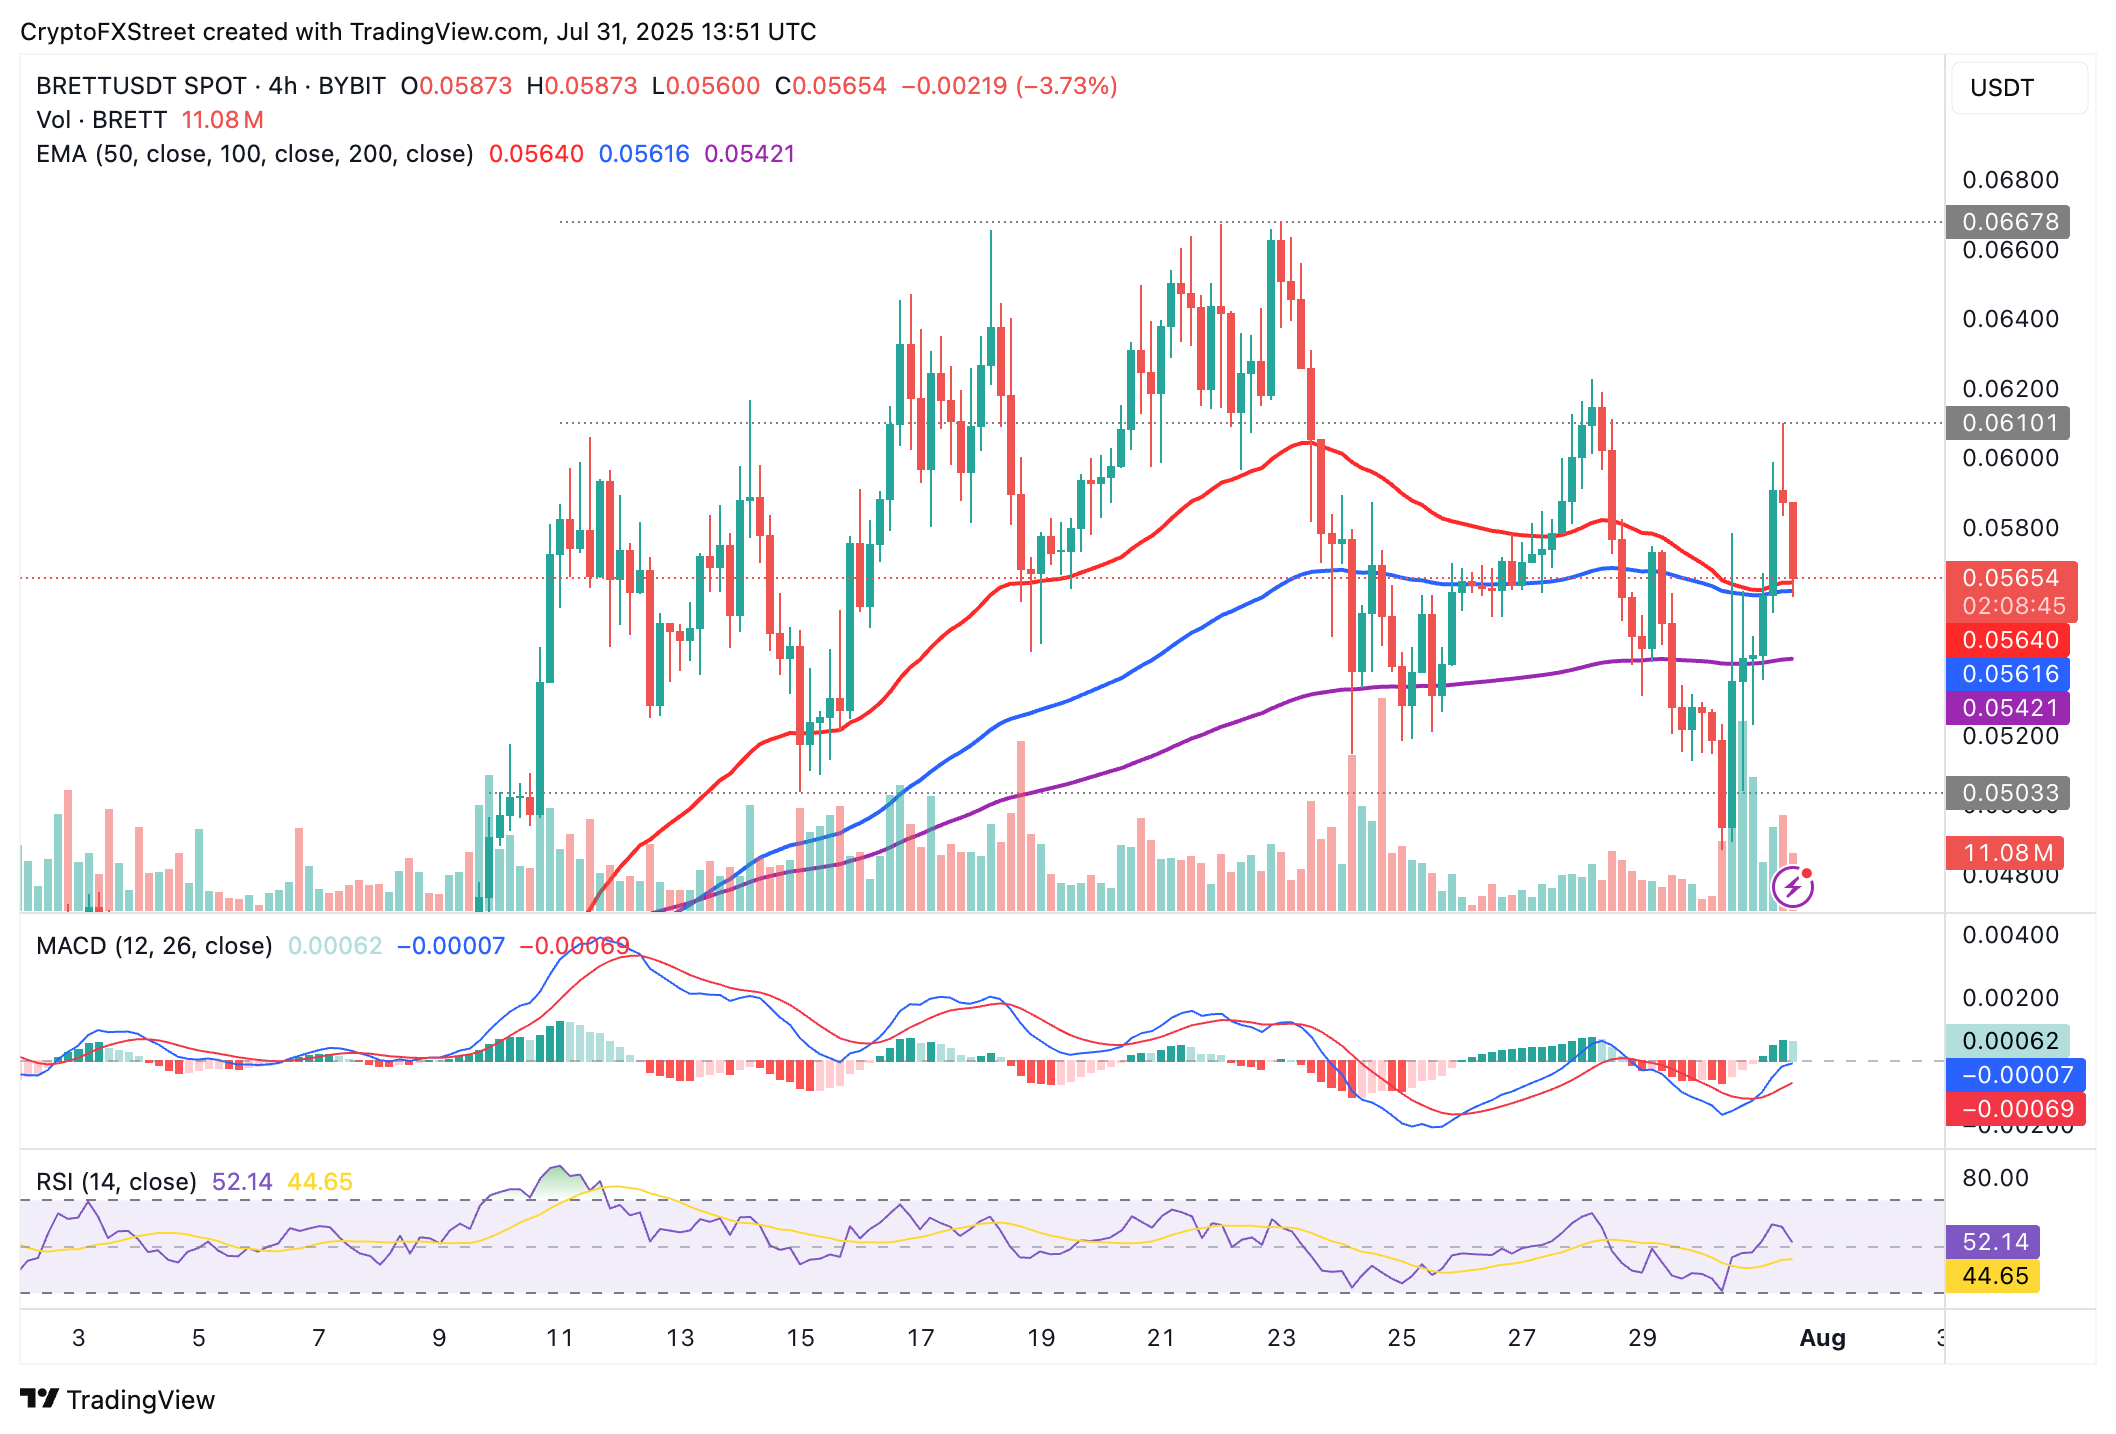
BRETT/USD 4-hour chart
Still, with the RSI approaching the midline after peaking at 60, traders should also be concerned about the reversal gaining momentum as buying pressure dwindles. Potential profit-taking is another factor to consider before seeking exposure.
Cryptocurrency metrics FAQs
The developer or creator of each cryptocurrency decides on the total number of tokens that can be minted or issued. Only a certain number of these assets can be minted by mining, staking or other mechanisms. This is defined by the algorithm of the underlying blockchain technology. On the other hand, circulating supply can also be decreased via actions such as burning tokens, or mistakenly sending assets to addresses of other incompatible blockchains.
Market capitalization is the result of multiplying the circulating supply of a certain asset by the asset’s current market value.
Trading volume refers to the total number of tokens for a specific asset that has been transacted or exchanged between buyers and sellers within set trading hours, for example, 24 hours. It is used to gauge market sentiment, this metric combines all volumes on centralized exchanges and decentralized exchanges. Increasing trading volume often denotes the demand for a certain asset as more people are buying and selling the cryptocurrency.
Funding rates are a concept designed to encourage traders to take positions and ensure perpetual contract prices match spot markets. It defines a mechanism by exchanges to ensure that future prices and index prices periodic payments regularly converge. When the funding rate is positive, the price of the perpetual contract is higher than the mark price. This means traders who are bullish and have opened long positions pay traders who are in short positions. On the other hand, a negative funding rate means perpetual prices are below the mark price, and hence traders with short positions pay traders who have opened long positions.
추천 기사


