


Crude Oil sells off and takes it all back on Saudi cargoes through Oman
- WTI round-trips from $94.50 back to $97.50 as Saudi Arabia reroutes cargoes.
- The East-West pipeline that moves up to 5 million barrels a day is shut.
- Gulf of Oman ship transfers are running at 2.7 million barrels a day.
Crude Oil trades near $97.50, which is where it opened, after a drop to $94.50 and a full recovery. Saudi Arabia is offering Asian refiners extra cargoes handed over outside the Strait of Hormuz, and the price treated that as more oil. The five daily closes before this one all landed between $96.50 and $101.00, which is a market that keeps buying and selling the same story.
The cargoes still cross the strait
A ship-to-ship transfer is a hand-off, not a route. Shuttle tankers load Saudi crude at the Gulf terminals, carry it through the Strait of Hormuz, and pass it to the buyer's vessel waiting off Sohar in Oman. What moves is the risk. The Asian refiner's supertanker stays out of the Gulf and a smaller ship makes the transit in its place, and the oil takes the trip it always took.
The volumes say the same thing. Transfers in the Gulf of Oman are running near 2.7 million barrels a day against 1.5 million in August, which is more cargo through the same chokepoint rather than cargo going around it. That chokepoint carried nearly 20 million barrels a day of crude and products in 2025, about a quarter of the world's seaborne oil trade, and no workaround built since February has replaced more than a slice of it. War-risk cover for one Hormuz transit was quoted at 7.5% to 12.5% of a ship's insured value before this month's escalation, against 0.25% before the war. Saudi Arabia has also doubled daily loadings at its Ras Tanura and Juaymah terminals to about two supertankers, roughly 4 million barrels, all of it inside the Gulf. That bill did not fall because Saudi Aramco found somewhere to park a tanker.
Aramco says days and the repair estimates say weeks
The route that genuinely avoids the strait is the East-West pipeline, 1,200 kilometres from the eastern oil fields to Yanbu on the Red Sea and rated at 5 million barrels a day. Houthi drones damaged it and the kingdom shut it on September 11, which is what carried Crude Oil to just above $102.00 on September 15. Regional officials put the repair at three to five weeks. Aramco has said it expects to bring about half the capacity back within days.
Until it runs again, every Saudi barrel sold into Asia has to cross Hormuz, and buyers waiting on the Red Sea route have been told their loadings are late. Some European cargoes due this month were cancelled outright. The arithmetic is not close. The pipeline is rated at 5 million barrels a day, and the extra transfers in the Gulf of Oman since August come to about 1.2 million. The transfers off Oman move the queue rather than the pipeline.
The price has already run this experiment
News of a meeting on a shipping arrangement for the strait took about four dollars off the price on September 11. Two sessions later Crude Oil made the high of the move just above $102.00. A meeting is not a barrel, a hand-off between two tankers is not a barrel either, and the market needed one session to work that out both times. The same thing happened inside a single session this time, and the low at $94.50 did not last.
Inventories are not the constraint. Commercial crude stocks in the United States fell 600K barrels in the week to September 11, to 423.4 million, and distillate stocks rose. The tightness is in tanker capacity and war-risk insurance in the Gulf, and neither of those is measured in an American tank farm.
What moves the price from here is the pipeline. A restart sends Saudi crude back to the Red Sea and off the strait, which is worth more than every hand-off off Sohar put together. A repair that runs past three weeks leaves those barrels on the water with the insurance bill attached. The Houthis who damaged the pipeline have said Saudi-linked vessels are still targets, so the repaired route delivers to a coast that is also being shot at.
Levels and bias
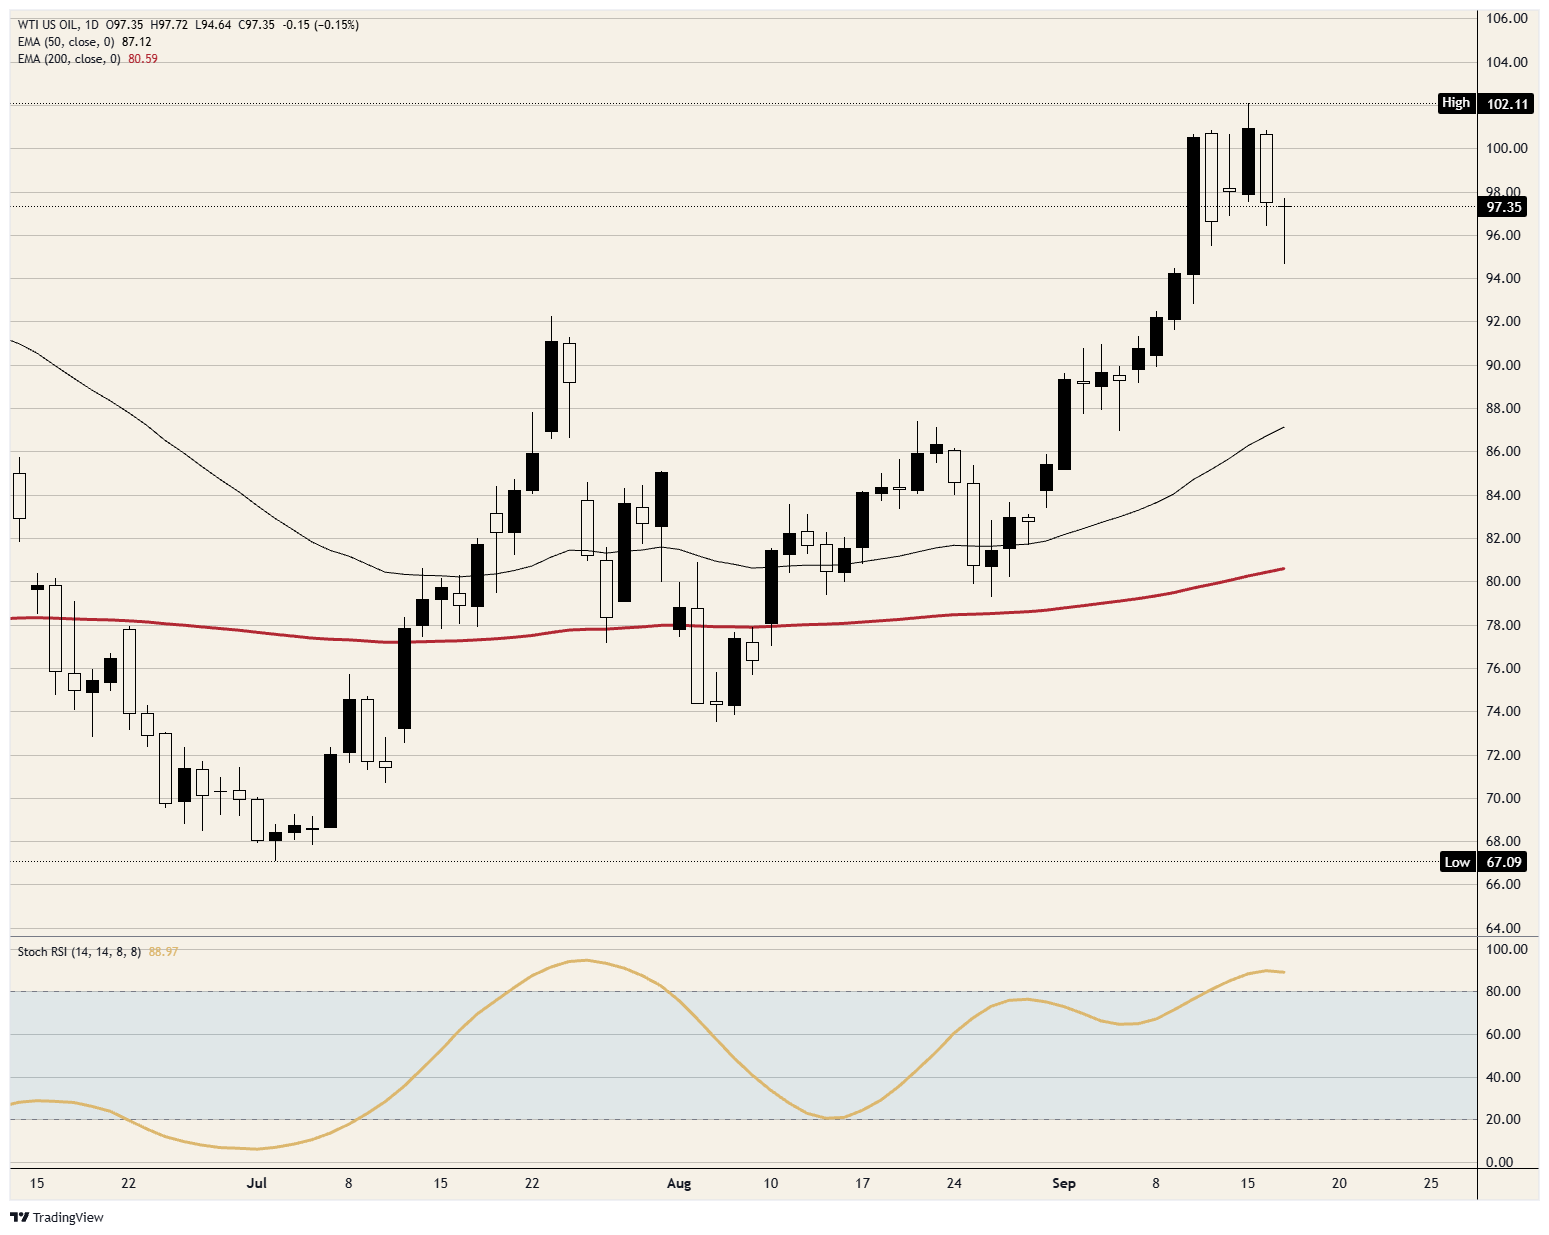
Resistance: $100.00 capped four sessions running into Wednesday. Each of them traded above it and only one had a close above it. Above that, $102.00 is the high of the move, made on September 15.
Support: $94.50 is the session low and the weakest level since September 10. Beneath it, $93.00 is where that September 10 flush stopped.
Bias: Higher while $94.50 holds, with $100.00 the first objective and $102.00 the second. The daily Stochastic Relative Strength Index (Stoch RSI), a momentum gauge, is near 89 and flat at the top of its range, so the next attempt at $100.00 needs a headline rather than momentum. A daily close below $93.00 ends the bullish case.
WTI daily chart
WTI Oil FAQs
WTI Oil is a type of Crude Oil sold on international markets. The WTI stands for West Texas Intermediate, one of three major types including Brent and Dubai Crude. WTI is also referred to as “light” and “sweet” because of its relatively low gravity and sulfur content respectively. It is considered a high quality Oil that is easily refined. It is sourced in the United States and distributed via the Cushing hub, which is considered “The Pipeline Crossroads of the World”. It is a benchmark for the Oil market and WTI price is frequently quoted in the media.
Like all assets, supply and demand are the key drivers of WTI Oil price. As such, global growth can be a driver of increased demand and vice versa for weak global growth. Political instability, wars, and sanctions can disrupt supply and impact prices. The decisions of OPEC, a group of major Oil-producing countries, is another key driver of price. The value of the US Dollar influences the price of WTI Crude Oil, since Oil is predominantly traded in US Dollars, thus a weaker US Dollar can make Oil more affordable and vice versa.
The weekly Oil inventory reports published by the American Petroleum Institute (API) and the Energy Information Agency (EIA) impact the price of WTI Oil. Changes in inventories reflect fluctuating supply and demand. If the data shows a drop in inventories it can indicate increased demand, pushing up Oil price. Higher inventories can reflect increased supply, pushing down prices. API’s report is published every Tuesday and EIA’s the day after. Their results are usually similar, falling within 1% of each other 75% of the time. The EIA data is considered more reliable, since it is a government agency.
OPEC (Organization of the Petroleum Exporting Countries) is a group of 12 Oil-producing nations who collectively decide production quotas for member countries at twice-yearly meetings. Their decisions often impact WTI Oil prices. When OPEC decides to lower quotas, it can tighten supply, pushing up Oil prices. When OPEC increases production, it has the opposite effect. OPEC+ refers to an expanded group that includes ten extra non-OPEC members, the most notable of which is Russia.
추천 기사


