


Gold Price Forecast: XAU/USD corrects below $4,500 as Yields recover some losses
- Gold price retreats to near $4,490 as US Treasury Yields receive some relief.
- US Treasury Department announces plans to double down on its bond buyback operations.
- Fears of de-anchored inflation projections and ballooning US debt have offered some relief to US bond yields.
Gold price (XAU/USD) is down 0.7% to near $4,490 in the European trading session on Thursday. The precious metal retreats from its 11-week high of $4,527 posted earlier in the day. The yellow metal comes under pressure as United States (US) Treasury Yields claw back some of Wednesday’s losses.
As of writing, 30-year US Treasury Yields are up 0.5% to near 5.21%. 10-year US bond yields trade 0.67% higher at around 4.67%.
Higher yields on interest-bearing assets diminish the appeal of non-yielding assets, such as Gold.
Late Wednesday, US Treasury Yields were hit badly after the announcement from the US Treasury Department that it would at least double the maximum size of its liquidity-support buyback operations for longer-dated nominal securities, in an effort to curb a sharp increase in borrowing costs, the Wall Street Journal (WSJ) reported.
However, financial markets, believing that higher inflation projections due to elevated oil prices and widening government debt, have staged a decent recovery in US bond yields.
Analysts at Jefferies said that the Treasury's announcement does "little to address the underlying issues pushing bonds higher, which they said include unsustainable fiscal deficits and rising inflation expectations", Reuters reported.
Gold Technical Analysis
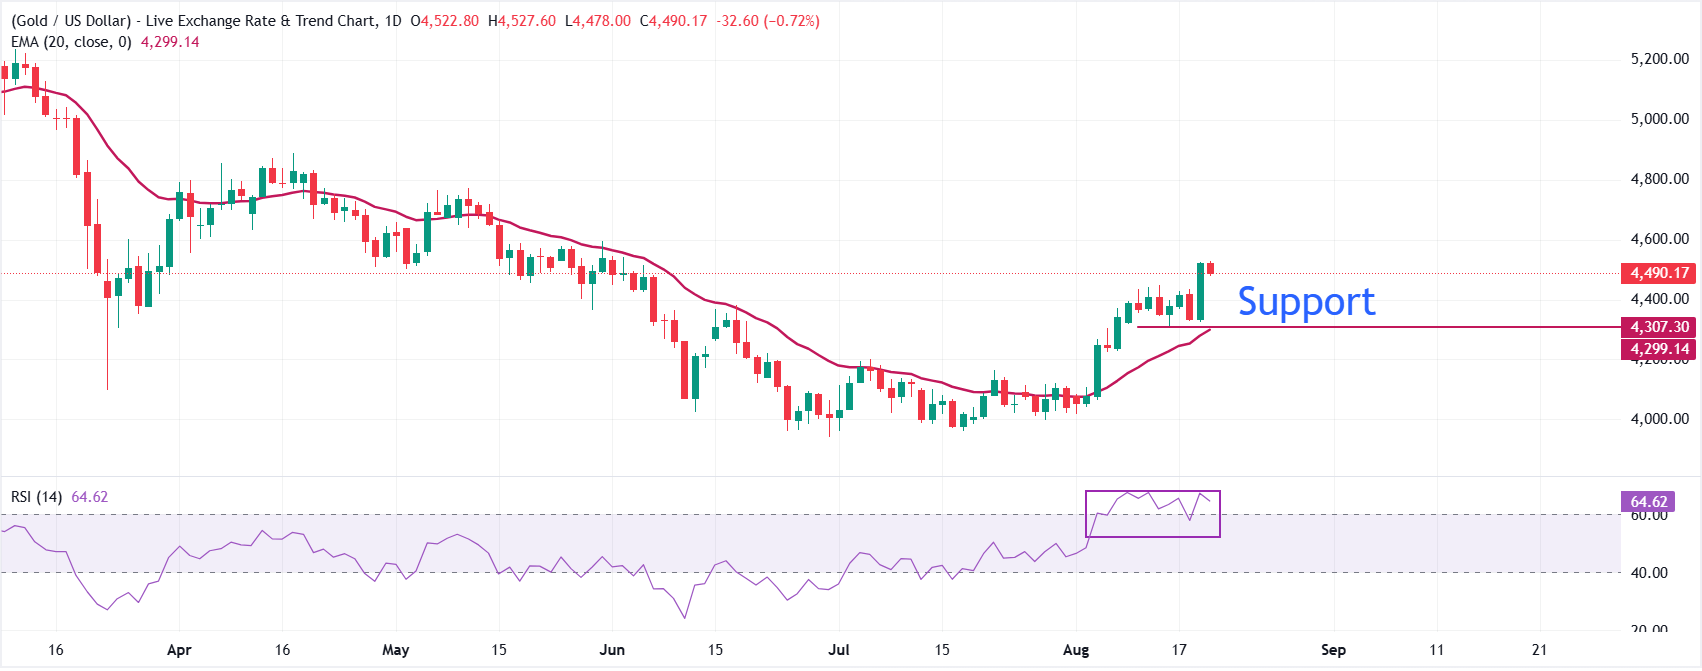
In the daily chart, XAU/USD trades at $4,490.45, extending its advance well above the 20-day Exponential Moving Average (EMA) at $4,299.17 and maintaining a clear bullish near-term bias. The short-term trend is supported by the distance between price and the EMA, while the Relative Strength Index (RSI) at 64.64 stays in positive territory but below the classic overbought threshold, hinting that upside momentum is strong yet not excessively stretched.
On the downside, immediate support is seen at the recent closing area around $4,490, with a deeper layer of demand emerging at the 20-day EMA near $4,299, where buyers would likely defend the broader uptrend on any corrective pullback. With no nearby technical resistance levels from the current dataset, the metal’s path of least resistance remains to the upside, and only a sustained drop back toward the $4,299 region would start to weaken the prevailing bullish tone.
(The technical analysis of this story was written with the help of an AI tool. Know more.)
Gold FAQs
Gold has played a key role in human’s history as it has been widely used as a store of value and medium of exchange. Currently, apart from its shine and usage for jewelry, the precious metal is widely seen as a safe-haven asset, meaning that it is considered a good investment during turbulent times. Gold is also widely seen as a hedge against inflation and against depreciating currencies as it doesn’t rely on any specific issuer or government.
Central banks are the biggest Gold holders. In their aim to support their currencies in turbulent times, central banks tend to diversify their reserves and buy Gold to improve the perceived strength of the economy and the currency. High Gold reserves can be a source of trust for a country’s solvency. Central banks added 1,136 tonnes of Gold worth around $70 billion to their reserves in 2022, according to data from the World Gold Council. This is the highest yearly purchase since records began. Central banks from emerging economies such as China, India and Turkey are quickly increasing their Gold reserves.
Gold has an inverse correlation with the US Dollar and US Treasuries, which are both major reserve and safe-haven assets. When the Dollar depreciates, Gold tends to rise, enabling investors and central banks to diversify their assets in turbulent times. Gold is also inversely correlated with risk assets. A rally in the stock market tends to weaken Gold price, while sell-offs in riskier markets tend to favor the precious metal.
The price can move due to a wide range of factors. Geopolitical instability or fears of a deep recession can quickly make Gold price escalate due to its safe-haven status. As a yield-less asset, Gold tends to rise with lower interest rates, while higher cost of money usually weighs down on the yellow metal. Still, most moves depend on how the US Dollar (USD) behaves as the asset is priced in dollars (XAU/USD). A strong Dollar tends to keep the price of Gold controlled, whereas a weaker Dollar is likely to push Gold prices up.
추천 기사


