


Gold retreats from June 17 highest amid USD uptick; holds above $4,300 pivotal support
- Gold kicks off the new week on a softer note as Mideast tensions benefit the safe-haven USD.
- Oil prices fuel inflation fears and keep Fed hike bets on the table, also undermining the bullion.
- Traders look forward to this week’s US inflation figures for more Fed cues and a fresh impetus.
Gold (XAU/USD) drifts lower at the start of a new week and moves away from its highest level since June 17, touched on Friday following the disappointing release of the US Nonfarm Payrolls (NFP) report. In fact, the crucial US monthly employment data showed that the economy unexpectedly lost 23K jobs in July, while the previous month's reading was also revised down to 20K from 57K. This pointed to signs of a cooling US labor market and undermined the case for the US Federal Reserve (Fed) to raise interest rates, which, in turn, weighed heavily on the US Dollar (USD) and provided a goodish lift to the non-yielding bullion.
The immediate market reaction, however, turned out to be short-lived as uncertainties surrounding the Middle East crisis and the reopening of the Strait of Hormuz offered some support to the safe-haven Greenback. In fact, Iran reiterated conditions for a full reopening of the critical waterway, including an end to the US naval blockade, the removal of sanctions and compensation for war damage. Moreover, Tehran has ruled out direct talks with the US, citing alleged violations of the interim peace agreement reached in June. This keeps the geopolitical risk premium in play and underpins the USD, exerting some pressure on gold.
Meanwhile, the US-Iran standoff acts as a tailwind for crude oil prices. Investors remain worried that rising energy prices will rekindle inflationary pressures and force major central banks to adopt a more hawkish stance. Furthermore, the CME Group's FedWatch Tool indicates that traders are still pricing in a greater chance that the US central bank will raise borrowing costs by the year-end. The outlook remains supportive of elevated US Treasury bond yields, which favors USD bulls and backs the case for a further depreciating move for gold. Traders, however, might opt to wait for the latest US inflation figures this week.
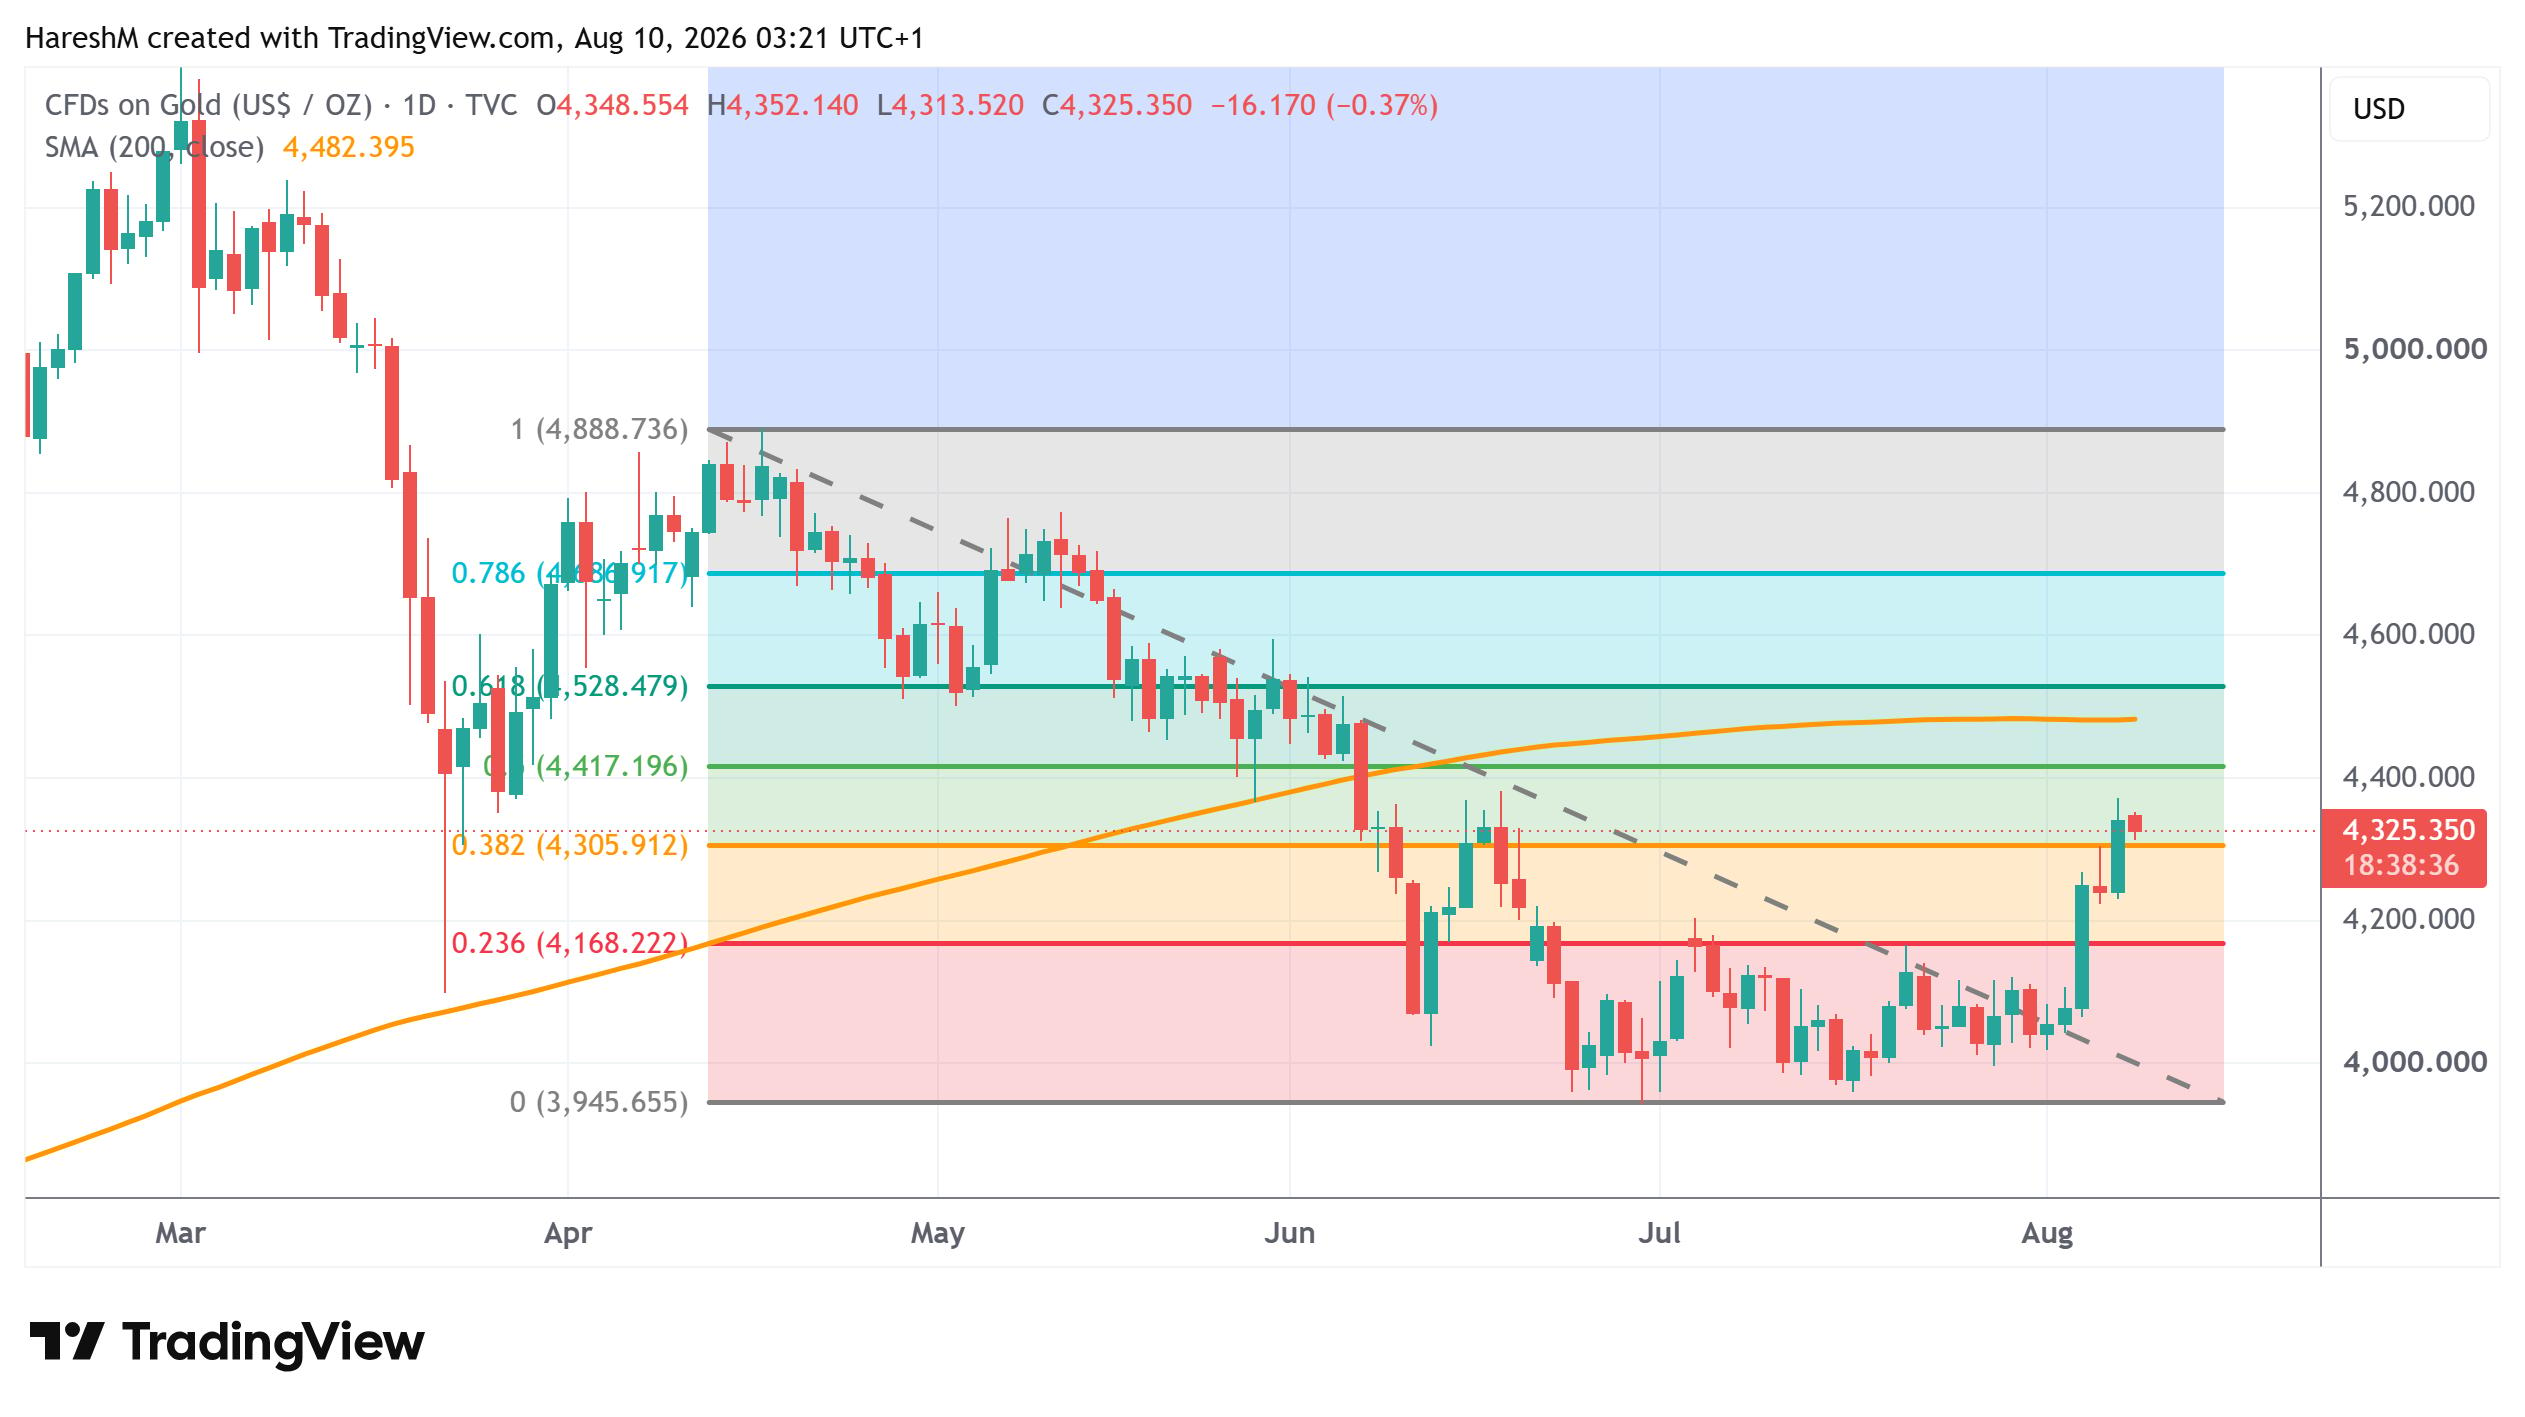
XAU/USD daily chart
Technical Analysis:
Friday's breakout through the 38.2% Fibonacci retracement level of the April-June downfall favors XAU/USD bulls. The said support is pegged just above the $4,300 mark, which, if broken, could prompt some technical selling and pave the way for a further depreciating move. Moreover, Gold remains below the 50% Fibo. level and the very important 200-day Simple Moving Average (SMA), warranting some caution before positioning for an extension of the recent move up witnessed over the past week or so.
US Dollar Price Today
The table below shows the percentage change of US Dollar (USD) against listed major currencies today. US Dollar was the strongest against the Japanese Yen.
| USD | EUR | GBP | JPY | CAD | AUD | NZD | CHF | |
|---|---|---|---|---|---|---|---|---|
| USD | 0.03% | 0.02% | 0.30% | 0.09% | 0.04% | 0.22% | 0.12% | |
| EUR | -0.03% | -0.00% | 0.26% | 0.03% | 0.00% | 0.17% | 0.08% | |
| GBP | -0.02% | 0.00% | 0.26% | 0.04% | 0.04% | 0.17% | 0.09% | |
| JPY | -0.30% | -0.26% | -0.26% | -0.25% | -0.29% | -0.18% | -0.20% | |
| CAD | -0.09% | -0.03% | -0.04% | 0.25% | -0.10% | 0.13% | 0.03% | |
| AUD | -0.04% | -0.01% | -0.04% | 0.29% | 0.10% | 0.14% | 0.07% | |
| NZD | -0.22% | -0.17% | -0.17% | 0.18% | -0.13% | -0.14% | -0.08% | |
| CHF | -0.12% | -0.08% | -0.09% | 0.20% | -0.03% | -0.07% | 0.08% |
The heat map shows percentage changes of major currencies against each other. The base currency is picked from the left column, while the quote currency is picked from the top row. For example, if you pick the US Dollar from the left column and move along the horizontal line to the Japanese Yen, the percentage change displayed in the box will represent USD (base)/JPY (quote).
추천 기사


