


Gold rebounds as hopes for US-Iran deal weigh on US Dollar, Oil prices
- Gold recovers from recent losses as traders react to fresh headlines surrounding US-Iran negotiations.
- WTI crude falls more than 5% while the US Dollar Index retreats toward the 99.00 mark.
- Technically, XAU/USD remains stuck in a broad range while holding above the 200-day SMA near $4,380.
Gold (XAU/USD) rebounds sharply on Monday as hopes for a US-Iran deal to end the war in the Middle East and reopen the Strait of Hormuz weigh on the US Dollar (USD) and Oil prices. At the time of writing, XAU/USD is trading around $4,556, up 1.0% on the day.
Optimism over a possible breakthrough in negotiations intensified after US President Donald Trump said talks with Iran were progressing in an “orderly and constructive manner.”
A potential deal reportedly includes a 60-day ceasefire extension, the reopening of the Strait of Hormuz and the removal of the US naval blockade to Iranian ports, while negotiations over Iran’s nuclear program would continue.
Reuters also reported that Iran’s Foreign Ministry spokesman Esmaeil Baghaei said progress had been made on a “large portion” of the discussions through Pakistan-mediated talks. However, he stressed that a final agreement was not yet imminent. Trump also said there was “no rush” to finalize a deal.
The latest headlines triggers a sharp decline in crude Oil prices on Monday, with West Texas Intermediate (WTI) down more than 5% at the time of writing. Meanwhile, the US Dollar Index (DXY), which tracks the Greenback's value against a basket of six major currencies, retreats toward the 99.00 mark.
For Gold, a successful agreement could significantly alter the recent macro narrative that has pressured bullion since the start of the war, as rising Oil prices fueled inflation concerns and reinforced expectations that major central banks, including the Federal Reserve (Fed), may need to raise borrowing costs.
A higher interest rate environment typically acts as a headwind for non-yielding assets like Gold. Markets are currently pricing in nearly a 40% chance of a 25 basis point hike at the Fed’s December meeting, according to CME FedWatch data.
However, if a deal is reached and the Strait of Hormuz fully reopens, further declines in Oil prices could ease fears of an energy-driven inflation shock, potentially cooling expectations that the Fed may need to raise interest rates again.
That said, until there is more clarity on the negotiations, Gold’s upside may remain limited and continue to be driven largely by movements in the US Dollar, Oil prices and shifting interest rate expectations.
Still, ongoing central bank buying and firm investment demand continue to provide an important longer-term support pillar for bullion, helping limit deeper downside pressure.
Looking ahead, investors will keep a close eye on further headlines surrounding the US-Iran negotiations for fresh direction. Focus later this week will shift to the US Personal Consumption Expenditure (PCE) inflation report on Thursday and speeches from several Fed officials for additional clues on the interest rate outlook.
Technical Analysis: XAU/USD needs to break above the 100-day SMA to revive bullish momentum
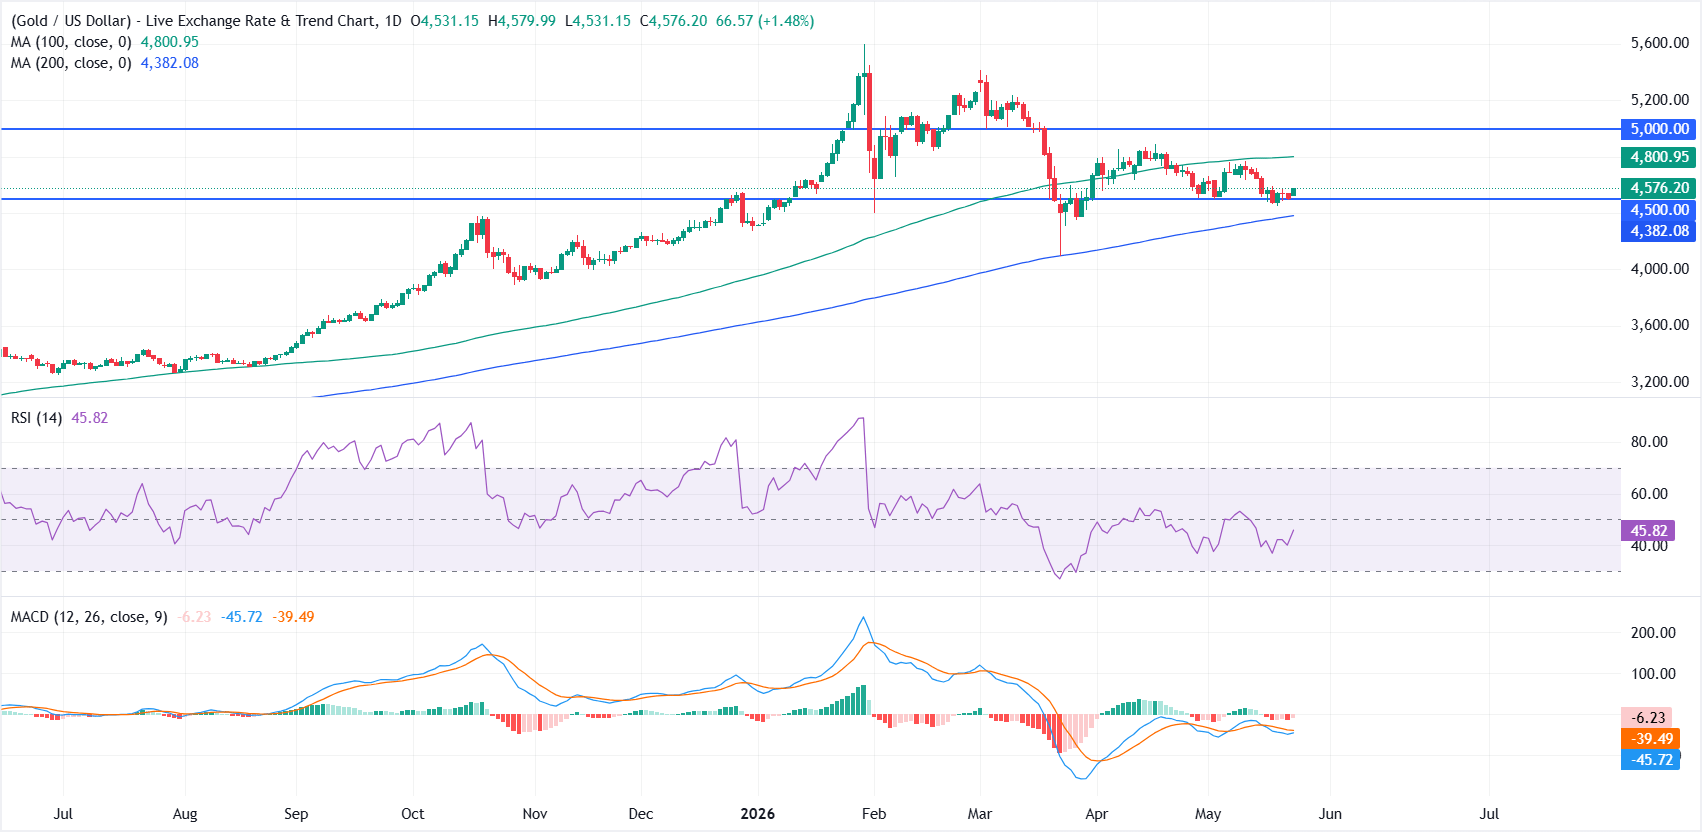
XAU/USD holds above the 200-day Simple Moving Average (SMA) at roughly $4,382, keeping a broader constructive backdrop, but remains capped by the 100-day SMA near $4,801, which limits immediate upside.
The Relative Strength Index (RSI) around 46 on the daily chart leans slightly negative, while the Moving Average Convergence Divergence (MACD) indicator sits below zero with a mildly negative histogram reading, together suggesting subdued momentum and a consolidative, range-bound bias between these key moving averages.
On the downside, initial support aligns with the nearby horizontal floor around $4,500, ahead of the more significant 200-day SMA cluster just above $4,380, where dip-buying interest could re-emerge if bears press their advantage.
On the topside, a sustained break above the 100-day SMA at approximately $4,801 would be needed to ease the current cap and open the way toward the psychological resistance band around $5,000, where prior supply defines the next key obstacle for bulls.
(The technical analysis of this story was written with the help of an AI tool.)
Gold FAQs
Gold has played a key role in human’s history as it has been widely used as a store of value and medium of exchange. Currently, apart from its shine and usage for jewelry, the precious metal is widely seen as a safe-haven asset, meaning that it is considered a good investment during turbulent times. Gold is also widely seen as a hedge against inflation and against depreciating currencies as it doesn’t rely on any specific issuer or government.
Central banks are the biggest Gold holders. In their aim to support their currencies in turbulent times, central banks tend to diversify their reserves and buy Gold to improve the perceived strength of the economy and the currency. High Gold reserves can be a source of trust for a country’s solvency. Central banks added 1,136 tonnes of Gold worth around $70 billion to their reserves in 2022, according to data from the World Gold Council. This is the highest yearly purchase since records began. Central banks from emerging economies such as China, India and Turkey are quickly increasing their Gold reserves.
Gold has an inverse correlation with the US Dollar and US Treasuries, which are both major reserve and safe-haven assets. When the Dollar depreciates, Gold tends to rise, enabling investors and central banks to diversify their assets in turbulent times. Gold is also inversely correlated with risk assets. A rally in the stock market tends to weaken Gold price, while sell-offs in riskier markets tend to favor the precious metal.
The price can move due to a wide range of factors. Geopolitical instability or fears of a deep recession can quickly make Gold price escalate due to its safe-haven status. As a yield-less asset, Gold tends to rise with lower interest rates, while higher cost of money usually weighs down on the yellow metal. Still, most moves depend on how the US Dollar (USD) behaves as the asset is priced in dollars (XAU/USD). A strong Dollar tends to keep the price of Gold controlled, whereas a weaker Dollar is likely to push Gold prices up.
추천 기사


