

WTI Crude Oil steadies after testing key support, remains trapped in narrow range
- WTI crude oil begins the week on a cautious note, paring early losses after testing key support near $61.50.
- Price action remains confined within a narrow range, reflecting market indecision and low volatility.
- The $61.50 area continues to act as a reliable support, though gains remain capped below $63.20.
West Texas Intermediate (WTI) Crude Oil pares some of its early losses on Monday, trading around $62.25 after slipping to an intraday low of $61.57. The commodity started the week on a bearish note but managed a modest bounce, with buyers once again defending the $61.50 floor that has consistently held since early August.
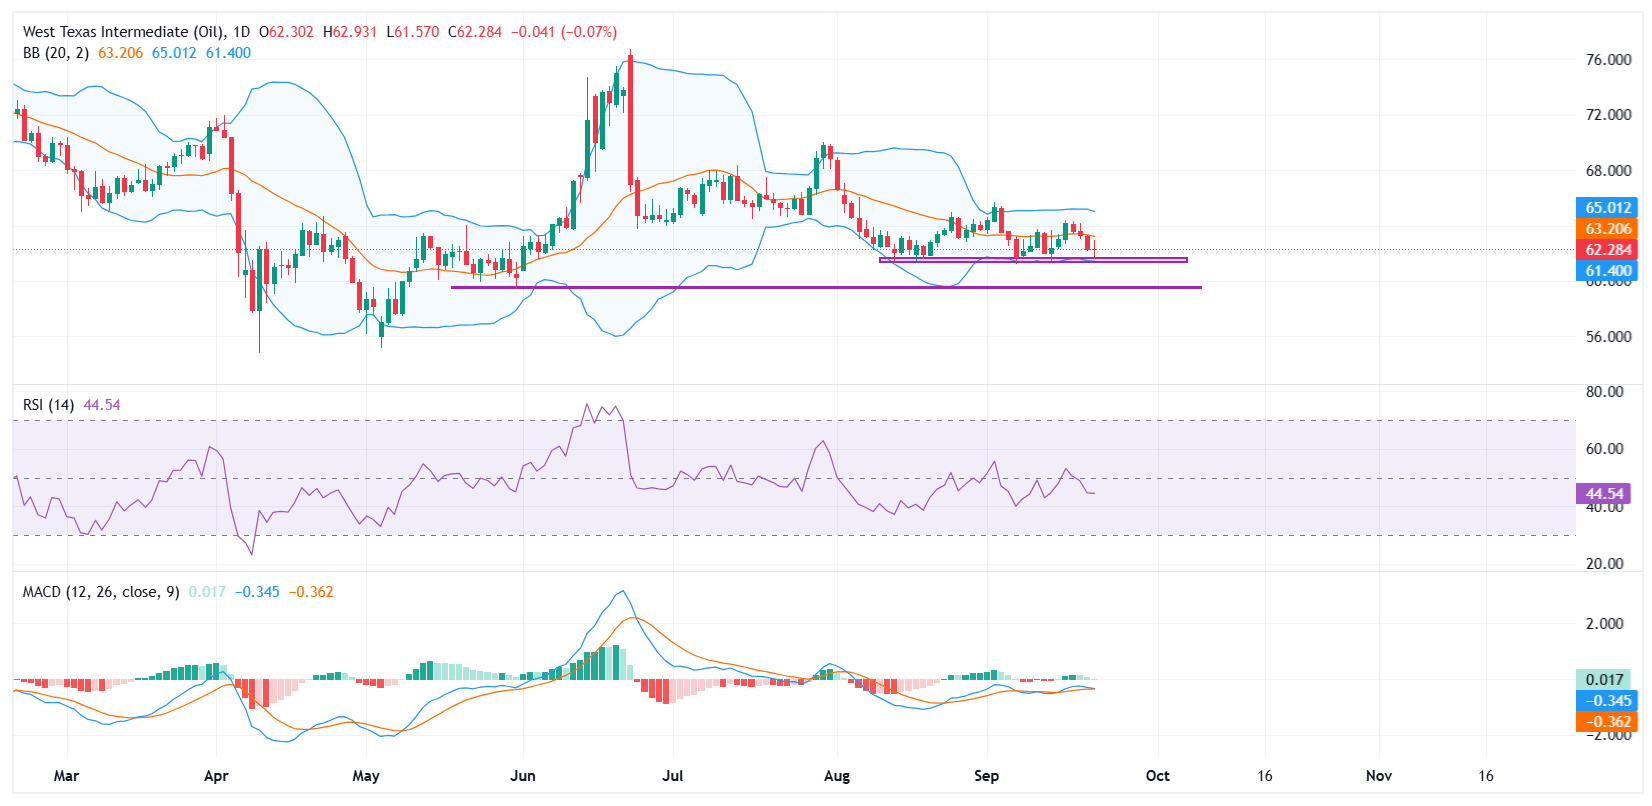
On the daily chart, Oil remains trapped in a sideways consolidation, oscillating between the middle Bollinger Band, which also serves as the 20-day Simple Moving Average (SMA) near $63.20, and the lower band around $61.40. The Bollinger Bands have narrowed slightly, reflecting reduced volatility and signaling that a breakout could be in the making. A breakout above the mid-band could suggest a shift in momentum, while continued pressure near the lower band may reinforce bearish sentiment.
The Relative Strength Index (RSI) hovers near 44, reflecting subdued bullish momentum and a lack of conviction from buyers. While not yet in oversold territory, the RSI’s failure to climb above 50 suggests that upward moves remain corrective rather than trend-defining. Meanwhile, the MACD histogram shows a shallow negative bias, with the MACD line slightly below the signal line, showing that selling pressure persists but lacks strong follow-through.
Overall, WTI remains confined to a range, with sideways trading likely to persist until a fresh catalyst emerges. A clear break below $61.50 would expose downside targets at $60.00 and $59.50. On the upside, a sustained recovery above $63.20 and the previous week’s high at $64.40 would pave the way for a test of the upper Bollinger Band near $65.00.
WTI Oil FAQs
WTI Oil is a type of Crude Oil sold on international markets. The WTI stands for West Texas Intermediate, one of three major types including Brent and Dubai Crude. WTI is also referred to as “light” and “sweet” because of its relatively low gravity and sulfur content respectively. It is considered a high quality Oil that is easily refined. It is sourced in the United States and distributed via the Cushing hub, which is considered “The Pipeline Crossroads of the World”. It is a benchmark for the Oil market and WTI price is frequently quoted in the media.
Like all assets, supply and demand are the key drivers of WTI Oil price. As such, global growth can be a driver of increased demand and vice versa for weak global growth. Political instability, wars, and sanctions can disrupt supply and impact prices. The decisions of OPEC, a group of major Oil-producing countries, is another key driver of price. The value of the US Dollar influences the price of WTI Crude Oil, since Oil is predominantly traded in US Dollars, thus a weaker US Dollar can make Oil more affordable and vice versa.
The weekly Oil inventory reports published by the American Petroleum Institute (API) and the Energy Information Agency (EIA) impact the price of WTI Oil. Changes in inventories reflect fluctuating supply and demand. If the data shows a drop in inventories it can indicate increased demand, pushing up Oil price. Higher inventories can reflect increased supply, pushing down prices. API’s report is published every Tuesday and EIA’s the day after. Their results are usually similar, falling within 1% of each other 75% of the time. The EIA data is considered more reliable, since it is a government agency.
OPEC (Organization of the Petroleum Exporting Countries) is a group of 12 Oil-producing nations who collectively decide production quotas for member countries at twice-yearly meetings. Their decisions often impact WTI Oil prices. When OPEC decides to lower quotas, it can tighten supply, pushing up Oil prices. When OPEC increases production, it has the opposite effect. OPEC+ refers to an expanded group that includes ten extra non-OPEC members, the most notable of which is Russia.
추천 기사


