


USD/CAD Price Forecast: US Dollar eases within range in a quiet session
- USD/CAD trades at 1.4250, down from Friday's highs in the 1.4300 area.
- Weak US Consumer Sentiment data dented the US Dollar's rally on Friday.
- The pair consolidates gains after a nearly 3.5% uptrend in September.
The US Dollar (USD) has opened the week with a mild bearish tone against the Canadian Dollar (CAD), with trading volumes at low levels as the Japanese markets are closed on bank holidays and with the US and Canada also celebrating festivities. The USD/CAD pair has pulled back to the 1.4250 area from 1.4300 highs on Friday, but remains consolidating gains after rallying about 3.5% in September.
US data released last Friday by the University of Michigan revealed that consumer sentiment fell to levels near historic lows in October, as the higher cost of living stemming from elevated energy prices is frustrating US consumers.
In Canada, September’s employment report failed to boost investors' enthusiasm, as the Unemployment Rate increased to 6.5%, from 6.4% in August, amid a sharper-than-expected decline in net jobs.
US President Donald Trump announced an energy ceasefire between Russia and Ukraine on Sunday, apparently without consulting Ukrainian President Volodymyr Zelenski and, so far, without confirmation from the Russian side either. Brent prices dropped about 2.5% following the announcement, but recovered most of the losses later on, as the details of the “agreement” were disclosed.
The calendar is thin today, with only Cleveland Federal Reserve President Beth Hammack’s speech worth mentioning, and with markets awaiting US Consumer Price Index (CPI) and Producer Price Index (PPI) due later in the week for further insight into the Fed’s monetary policy.
Technical Analysis: Looking for direction between 1.4200 and 1.4300
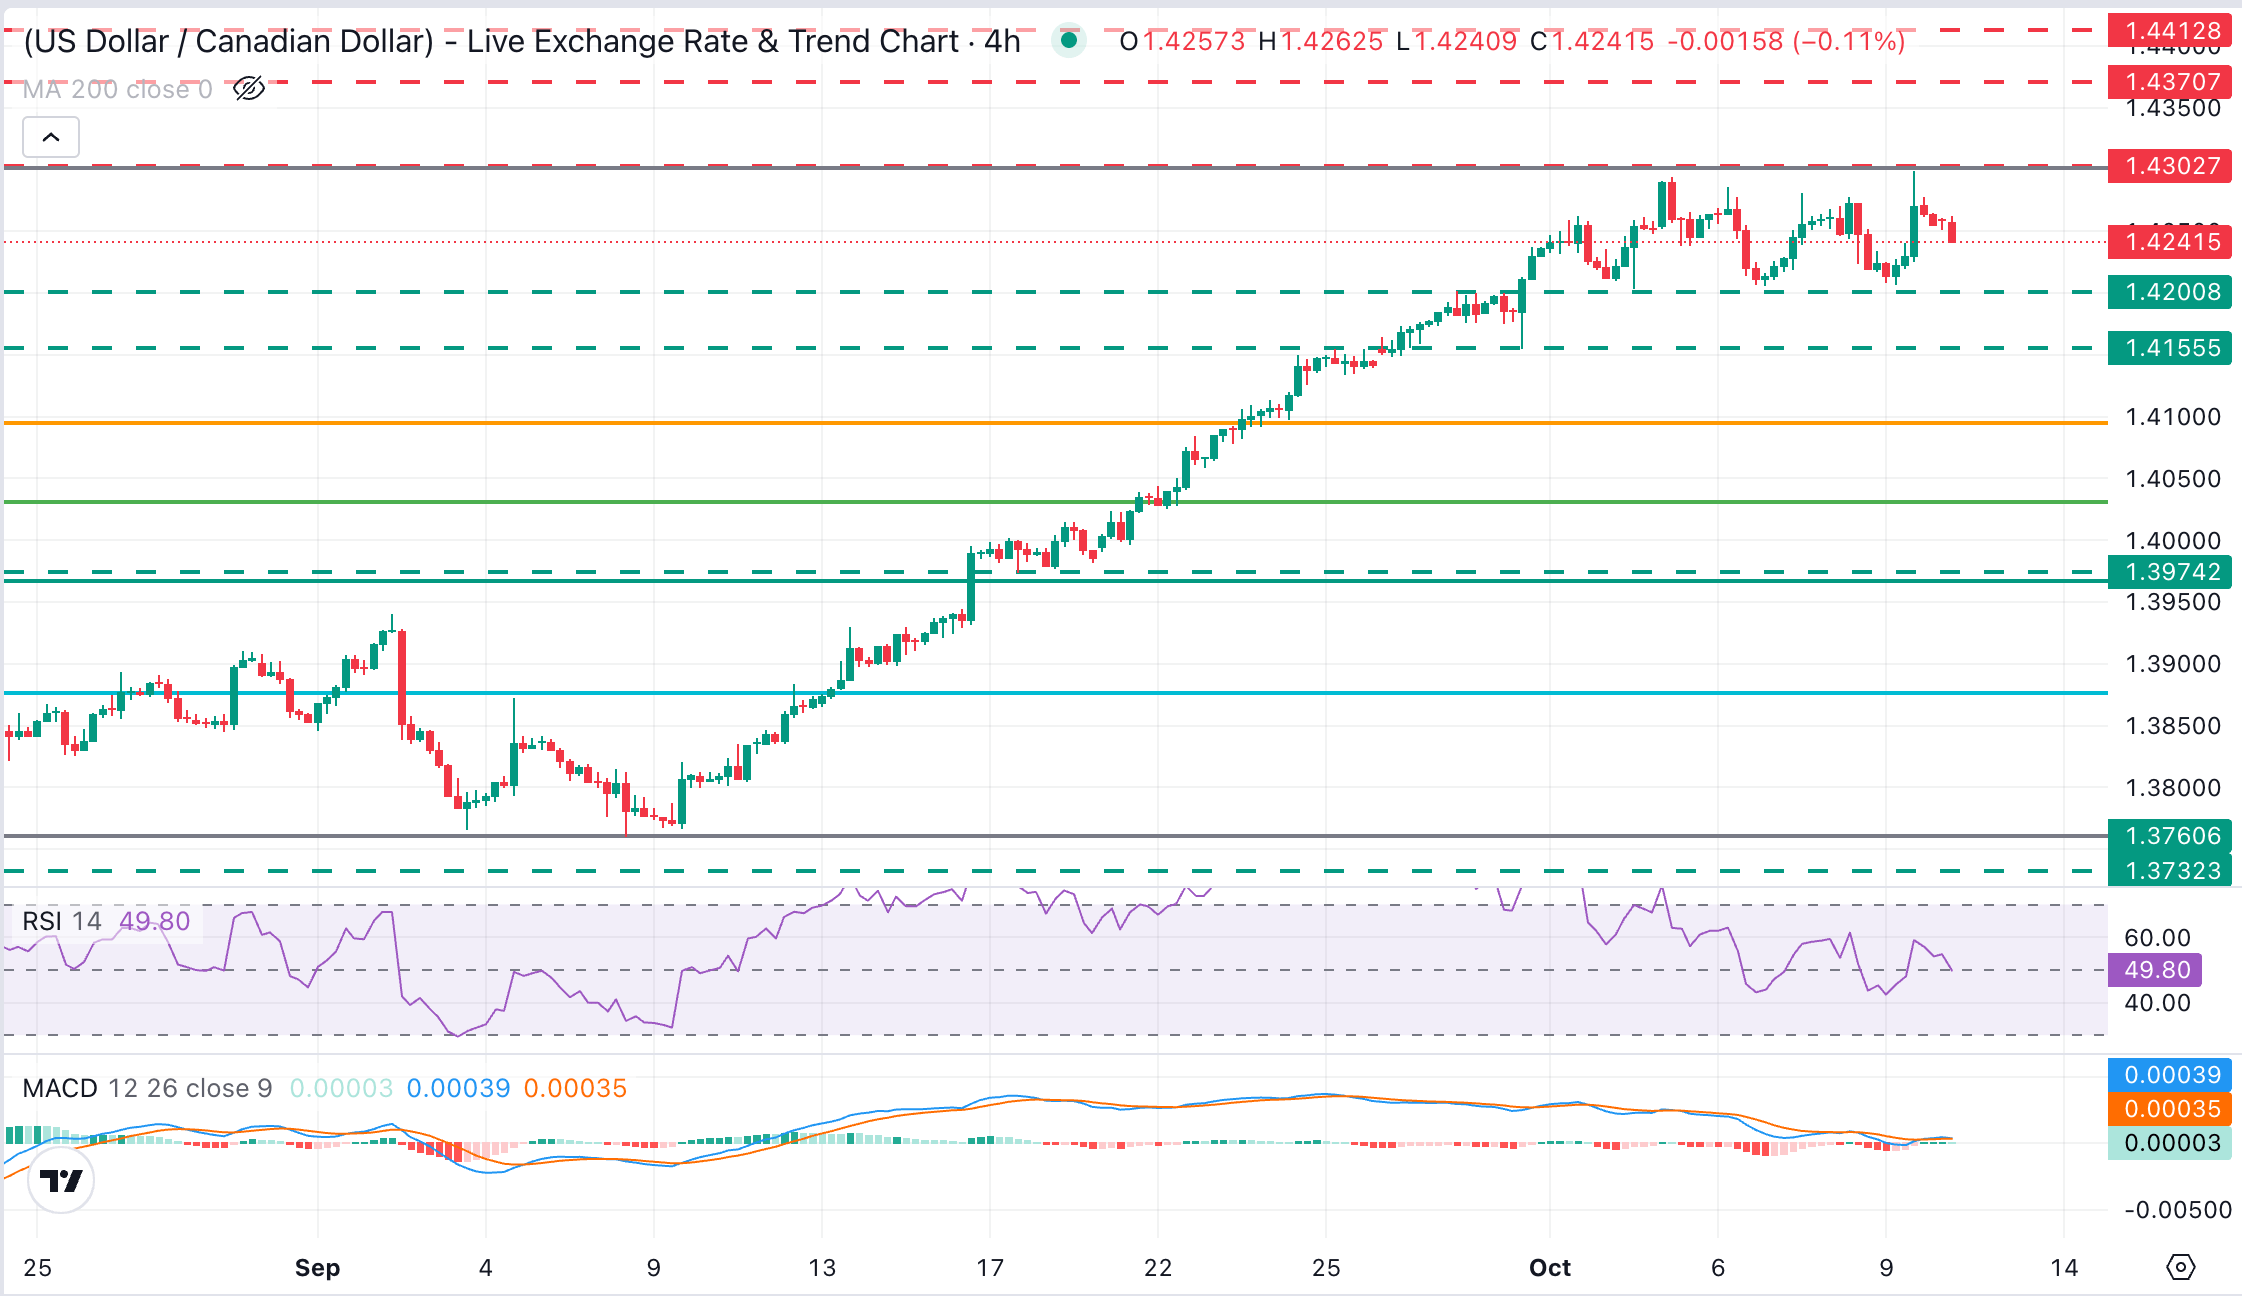
The technical picture shows the USD/CAD pair trading halfway through the last two weeks' range, between 1.4200 and 1.4300, consolidating gains after rallying to a 17-month high in September. Indicators on the 4-hour chart show muted momentum, with the Relative Strength Index hovering just above the 50 line and the Moving Average Convergence Divergence (MACD) practically flat around zero.
On the upside, above the 1.4300 resistance area (October 9 high), bulls are likely to target the early April 2025 highs at 1.4370 and the 1.4410 area. A reversal below 1.4200 (October 2, 6 and 9 lows), on the other hand, would signal a deeper correction, with the September 30 low at 1.4155 and the 38.2% Fibonacci retracement of September's rally, arounf 1.4100 as the next bearish targets.
(The technical analysis of this story was written with the help of an AI tool. Know more.)
US Dollar Price Today
The table below shows the percentage change of US Dollar (USD) against listed major currencies today. US Dollar was the strongest against the Swiss Franc.
| USD | EUR | GBP | JPY | CAD | AUD | NZD | CHF | |
|---|---|---|---|---|---|---|---|---|
| USD | -0.06% | -0.18% | 0.02% | -0.08% | -0.00% | 0.00% | 0.03% | |
| EUR | 0.06% | -0.15% | 0.05% | -0.01% | 0.04% | 0.11% | 0.08% | |
| GBP | 0.18% | 0.15% | 0.23% | 0.08% | 0.16% | 0.25% | 0.21% | |
| JPY | -0.02% | -0.05% | -0.23% | -0.12% | -0.03% | 0.03% | 0.00% | |
| CAD | 0.08% | 0.00% | -0.08% | 0.12% | 0.08% | 0.11% | 0.12% | |
| AUD | 0.00% | -0.04% | -0.16% | 0.03% | -0.08% | 0.08% | 0.03% | |
| NZD | -0.01% | -0.11% | -0.25% | -0.03% | -0.11% | -0.08% | -0.03% | |
| CHF | -0.03% | -0.08% | -0.21% | -0.01% | -0.12% | -0.03% | 0.03% |
The heat map shows percentage changes of major currencies against each other. The base currency is picked from the left column, while the quote currency is picked from the top row. For example, if you pick the US Dollar from the left column and move along the horizontal line to the Japanese Yen, the percentage change displayed in the box will represent USD (base)/JPY (quote).
추천 기사


