


USD/CHF Price Forecast: RSI nears overbought territory
- USD/CHF pauses a six-day winning streak as the US Dollar’s post-Fed rally stalls.
- A widening Fed-SNB rate gap and the Franc’s growing funding role leave the currency vulnerable.
- The pair holds above its major daily SMAs, keeping the broader technical bias bullish.
USD/CHF trades slightly lower on Thursday as the Swiss Franc regains some ground after falling for six straight days. The pullback comes as US Dollar (USD) buyers take a breather following the sharp rally triggered by the Federal Reserve’s (Fed) hawkish monetary policy announcement on Wednesday. At the time of writing, the pair trades around 0.8245, hovering near levels last seen in May 2025.
The Fed unanimously raised its benchmark rate by 25 basis points to 3.75%-4.00%, delivering its first increase since 2023. The updated dot plot showed that 16 of 18 policymakers expect at least one more quarter-point increase before the end of the year.
Prospects of more Fed rate hikes could widen the interest rate gap with Switzerland, where the Swiss National Bank (SNB) keeps its policy rate at zero. This difference may keep the Swiss Franc vulnerable to additional losses by making US Dollar-denominated assets more attractive.
At the same time, the Swiss Franc has become increasingly popular as a funding currency for carry trades, as expectations that the Bank of Japan (BoJ) could accelerate its rate-hike cycle make borrowing in Japanese Yen (JPY) less attractive.
Strategists at UOB Group note that the latest upswing in USD/CHF has exceeded their prior expectations. In their “most recent narrative from Tuesday (15 Sep, spot at 0.8175),” they had highlighted that the Dollar “must break and hold above 0.8205 before a move to 0.8245 can be expected.” They point out that “yesterday, USD broke above both levels as it surged to 0.8265,” confirming a strong short-term impulse higher.
However, UOB cautions that “while momentum remains strong, it is too early to tell whether it is sufficient for USD to break above 0.8300.” On the downside, they stress that “a breach of 0.8185 (‘strong support’ level was at 0.8145 yesterday) would mean that the upside momentum from late last week is easing,” marking 0.8185 as a pivotal level for assessing whether the recent bullish phase is starting to fade.
Technical Analysis
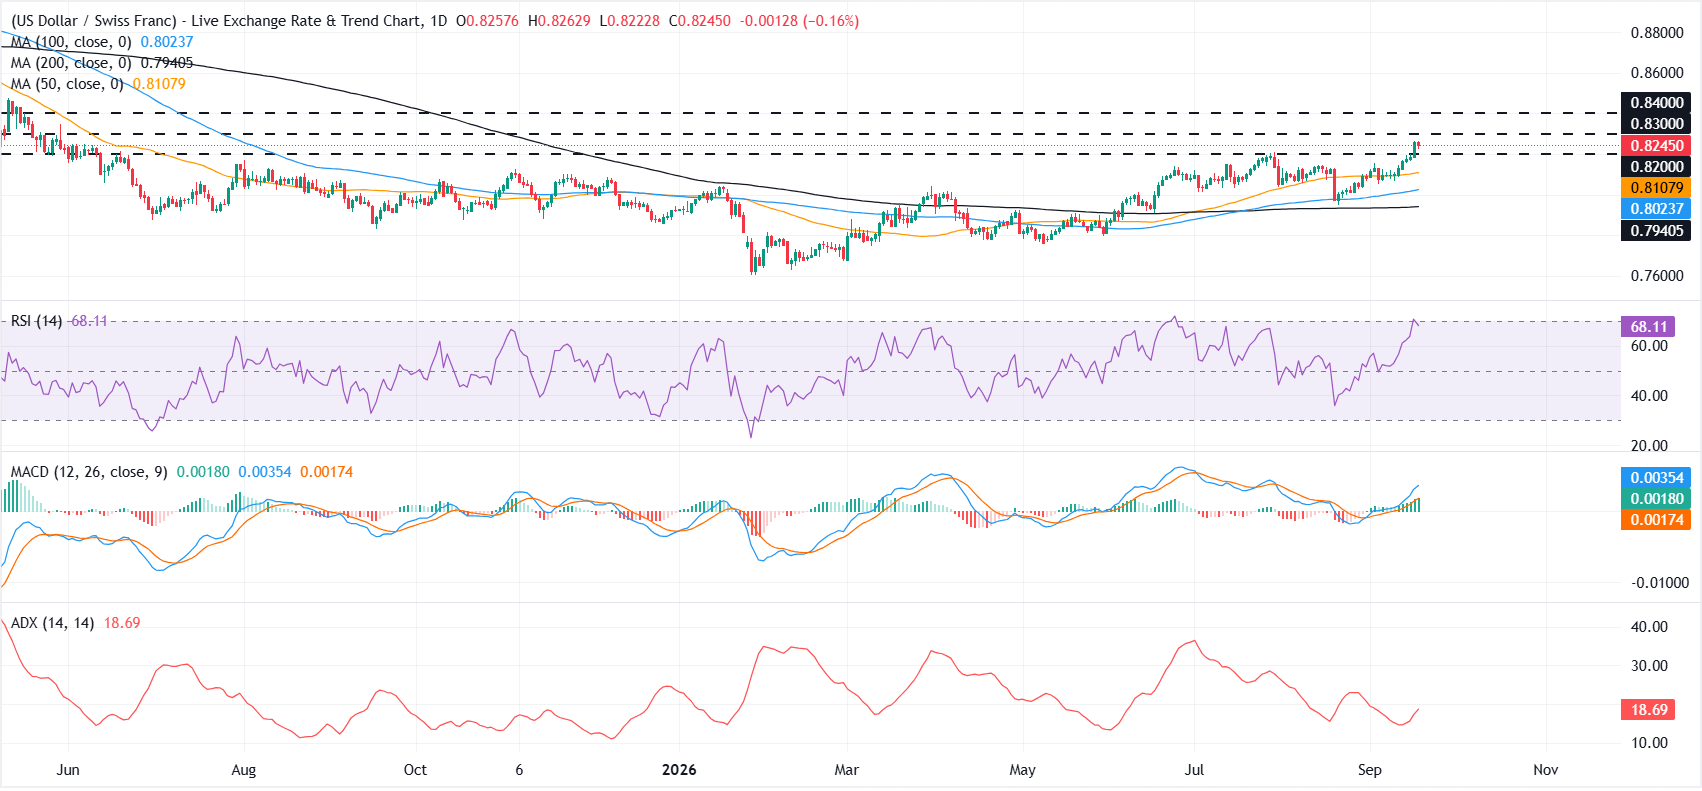
On the daily chart, USD/CHF extends its advance above the 50-day, 100-day and 200-day Simple Moving Averages (SMAs), which now underpin a constructive near-term bias. The Relative Strength Index (RSI) at 68 suggests strong but nearly overbought momentum, and the Moving Average Convergence Divergence (MACD) remains positive, hinting that buyers still retain control despite a relatively weak trend backdrop signaled by the subdued Average Directional Index (ADX).
On the downside, initial support emerges at the horizontal level around 0.8200, ahead of the 50-day SMA near 0.8108, with deeper demand likely around the 100-day SMA at 0.8024 and the 200-day SMA at 0.7941.
On the topside, immediate resistance is located at 0.8300, with a further barrier at 0.8400, and a daily close above the former would open the door for a continuation of the bullish sequence while a failure to clear these hurdles could trigger a corrective pullback toward the nearby support cluster.
(The technical analysis of this story was written with the help of an AI tool. Know more.)
US Dollar Price Today
The table below shows the percentage change of US Dollar (USD) against listed major currencies today. US Dollar was the strongest against the British Pound.
| USD | EUR | GBP | JPY | CAD | AUD | NZD | CHF | |
|---|---|---|---|---|---|---|---|---|
| USD | -0.09% | 0.25% | -0.23% | 0.00% | -0.35% | -0.34% | -0.19% | |
| EUR | 0.09% | 0.35% | -0.13% | 0.10% | -0.27% | -0.21% | -0.08% | |
| GBP | -0.25% | -0.35% | -0.46% | -0.24% | -0.61% | -0.56% | -0.40% | |
| JPY | 0.23% | 0.13% | 0.46% | 0.19% | -0.12% | -0.13% | 0.03% | |
| CAD | -0.01% | -0.10% | 0.24% | -0.19% | -0.34% | -0.31% | -0.14% | |
| AUD | 0.35% | 0.27% | 0.61% | 0.12% | 0.34% | 0.05% | 0.17% | |
| NZD | 0.34% | 0.21% | 0.56% | 0.13% | 0.31% | -0.05% | 0.19% | |
| CHF | 0.19% | 0.08% | 0.40% | -0.03% | 0.14% | -0.17% | -0.19% |
The heat map shows percentage changes of major currencies against each other. The base currency is picked from the left column, while the quote currency is picked from the top row. For example, if you pick the US Dollar from the left column and move along the horizontal line to the Japanese Yen, the percentage change displayed in the box will represent USD (base)/JPY (quote).
추천 기사


