


The Australian Dollar's thirteen-year high is a New Zealand story
- AUD/NZD trades just above 1.2250 after a session high short of 1.2300.
- The cross gained 1.07% and the New Zealand Dollar supplied most of it.
- Australian growth beat at 0.4% on the quarter and 2.1% on the year.
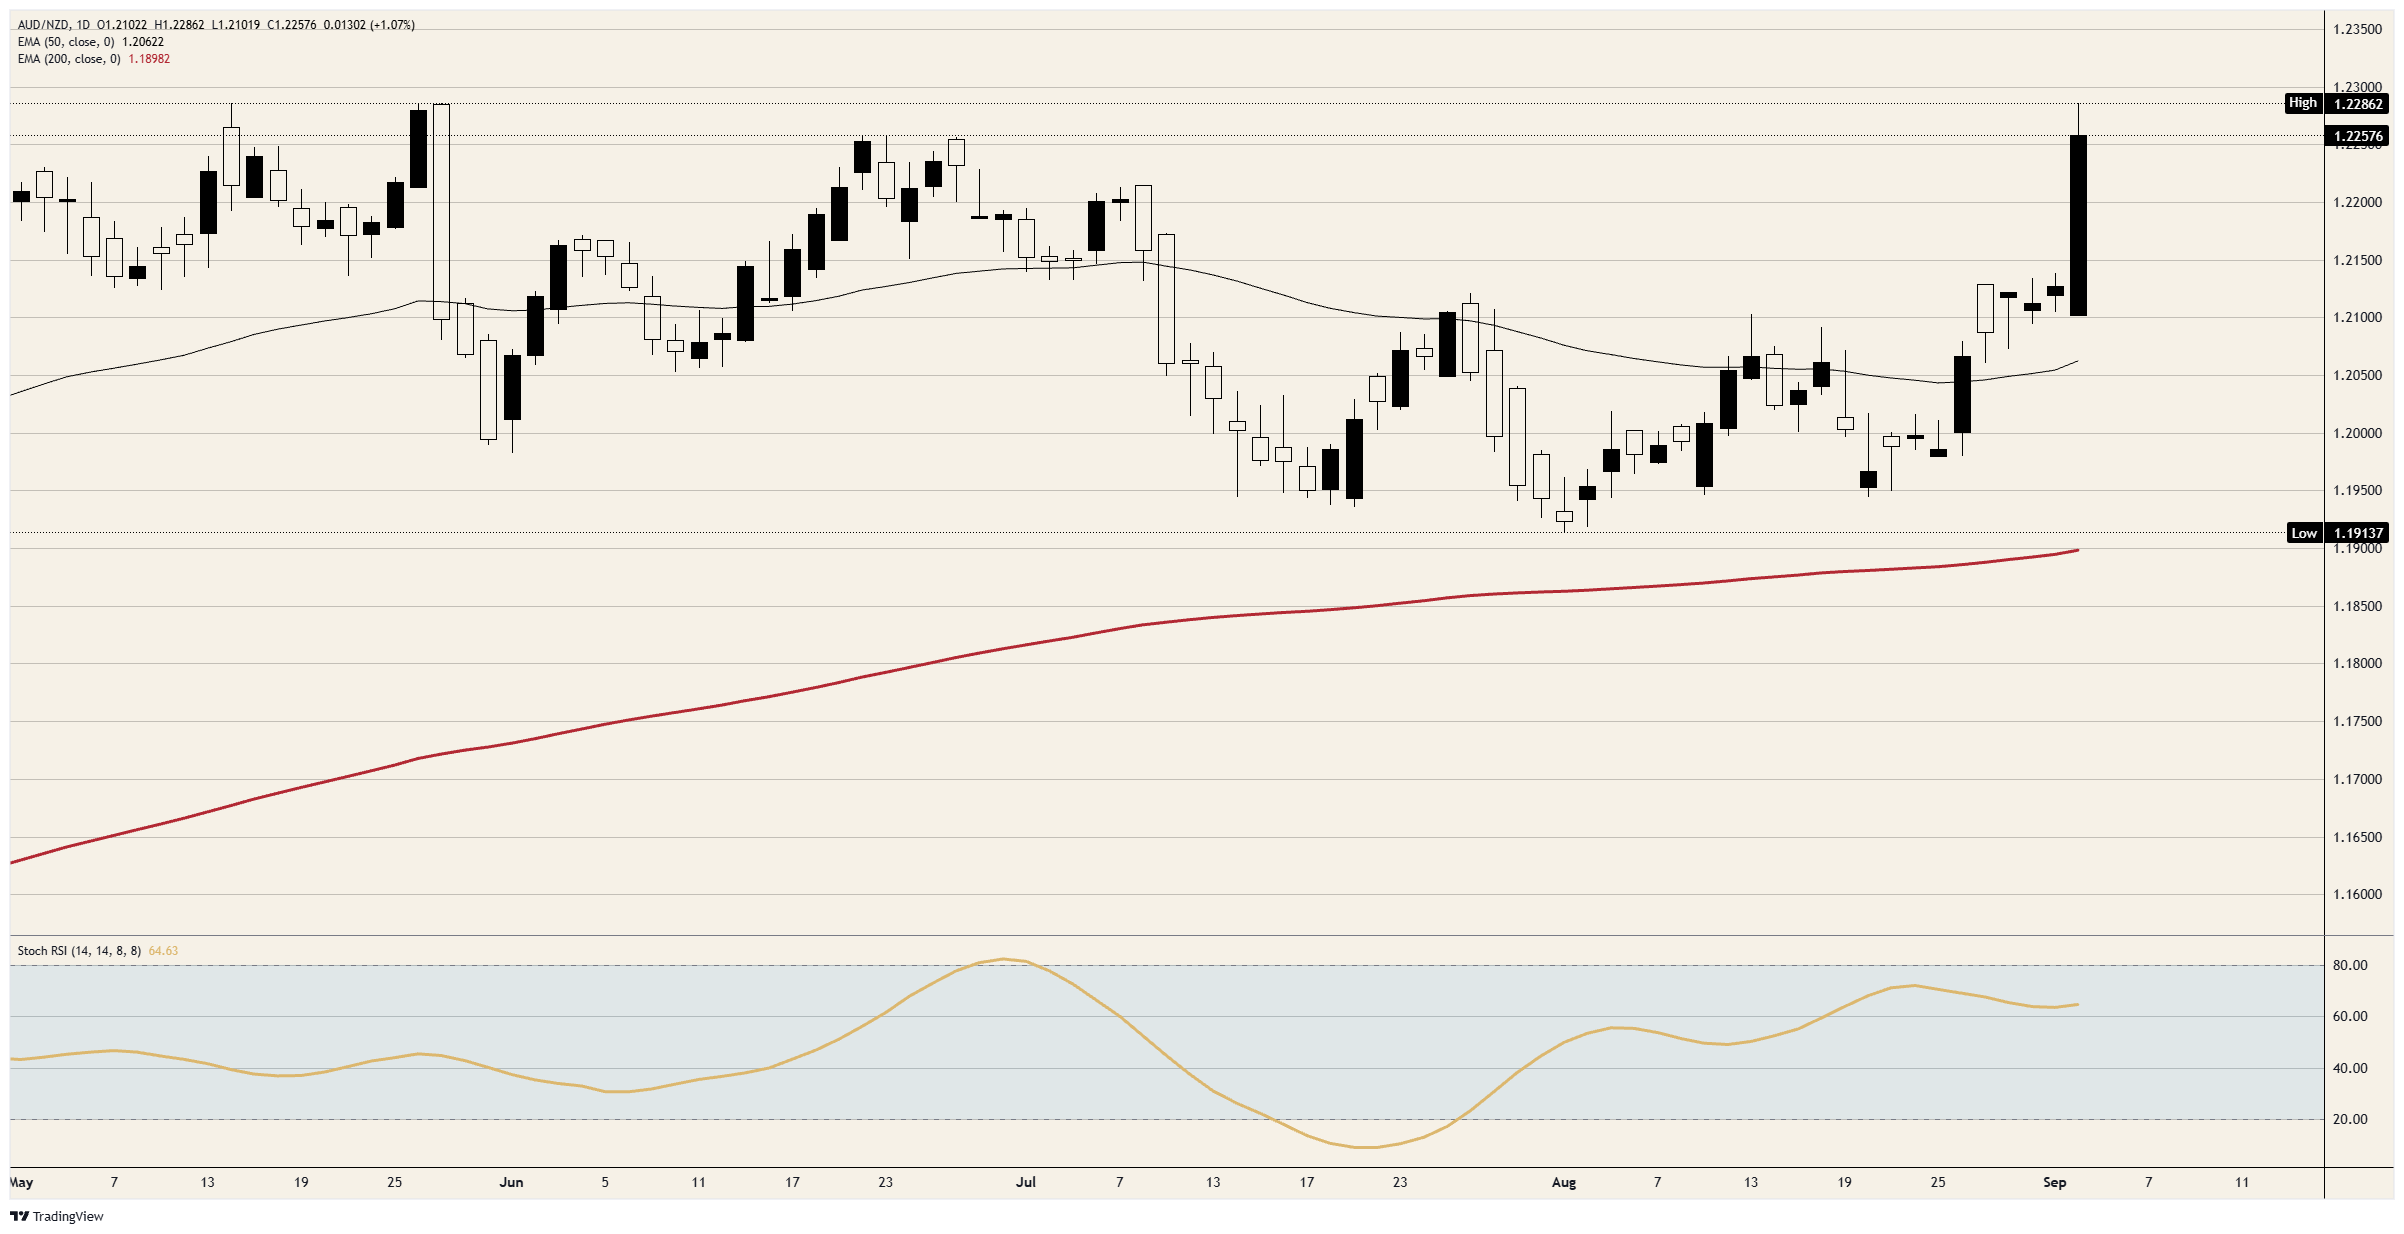
AUD/NZD spent Wednesday pushing at a ceiling that has held since 2013, running from near 1.2100 to a high short of 1.2300 and trading just above 1.2250 into the European afternoon. The Australian Gross Domestic Product (GDP) beat and the New Zealand rate decision landed within hours of each other, and the tidy explanation is that the Aussie caught a bid on the data. The arithmetic says something less flattering.
Only one leg actually moved
Set the cross gain of 1.07% against the New Zealand Dollar's own 0.82% decline on the US Dollar in the same window, and the Australian contribution comes out at roughly a quarter of a percent. That is not a currency catching a firm pop off a growth surprise. That is a currency standing still while the other side of the cross falls over, and it accounts for close to four fifths of the move.
The distinction matters to anyone buying a thirteen-year high. A cross that rallies because both legs are working carries its own momentum, while a cross that rallies because the denominator collapsed is only as durable as the damage on that side. The Reserve Bank of New Zealand raised its Official Cash Rate (OCR) to 2.75% and its own projections carried only one more quarter point this year, which is the disappointment that did the work. Nothing about that repricing tells you where the Australian Dollar goes next.
The divergence trade is real but dated
None of the above means the structural story is wrong. Australia's cash rate sits at 4.35% against New Zealand's 2.75%, a gap of 160 basis points, and Wednesday's growth figures pushed the implied probability of a hike at the September 28 meeting to around 57% from roughly 48% beforehand. New Zealand is openly discussing a pause. Those two trajectories point the same way the cross has been travelling for a year.
The composition is where the Australian case gets thinner. Household spending rose 0.4% with discretionary strength concentrated heavily in electric and hybrid vehicle purchases, essential spending fell 0.3%, private investment was flat, and softer imports supplied a meaningful share of the headline. Growth of that shape does not force a central bank's hand. It removes an argument for patience, which is a smaller thing than the reaction suggests, and annual growth still decelerated from 2.5%.
The Reserve Bank of Australia has also been explicit that growth needs to slow for inflation to come down, which makes an upside growth surprise an ambiguous input rather than a clean hawkish one. Australian 10-year yields at their highest since 2011 do more to advertise a global bond problem than a domestic tightening cycle. The cross is being asked to break a level it has failed at twice since May on the strength of a growth print that beat by a tenth and a policy statement written in Wellington.
Both legs answer to the same shock
Thursday's Australian trade balance at 01:30 GMT carries a 1.39 billion consensus against 1.929 billion previously, with exports last at 9.6% and imports at minus 0.2% on the month, and the Chinese services survey follows at 01:45 GMT at 50.6 against 50.4. China is the largest trading partner for both economies, which makes that release one of the few scheduled events this week capable of moving the cross rather than one of its legs. Friday's American payrolls report, by contrast, hits both antipodean currencies through the same risk channel and largely nets out here, which is the standing argument for expressing an antipodean view on the cross rather than against the Dollar.
The larger risk is that both central banks are reading one shock in opposite directions. New Zealand's headline inflation of 4.1% falls to 2.9% excluding vehicle fuels, and Australia's July annual rate of 3.5% sits alongside a trimmed mean stuck at 3.6%, with households cutting fuel consumption because of the conflict. Crude Oil above $90.00 is writing both inflation stories, and a decisive move lower in the barrel takes the hawkish argument away from Sydney and Wellington at the same moment.
Levels and bias
Resistance: The 1.2300 handle is the only level that matters and Wednesday's high stopped short of it, which is the second refusal at this shelf since May. A daily close above 1.2300 puts the cross into territory untraded since 2013, where there is no reference structure and price discovery gets disorderly quickly.
Support: The 1.2200 area is the first line and it decides whether Wednesday holds as a breakout attempt or reads as an exhaustion spike. Beneath it, 1.2100 marks where the session began, and the 50-day Exponential Moving Average (EMA) near 1.2050 is the level that would end the near-term advance.
Bias: Bullish while 1.2200 holds. The trend, the rate gap and both policy trajectories favour the Australian leg, and the 200-day EMA near 1.1900 is a long way beneath the tape. The Stochastic Relative Strength Index (Stoch RSI) near 65 leaves room to run, though a one-legged rally into a thirteen-year ceiling is worth respecting, and a slip back under 1.2200 would confirm that Wednesday was a New Zealand event borrowed rather than an Australian one earned.
AUD/NZD daily chart
Australian Dollar FAQs
One of the most significant factors for the Australian Dollar (AUD) is the level of interest rates set by the Reserve Bank of Australia (RBA). Because Australia is a resource-rich country another key driver is the price of its biggest export, Iron Ore. The health of the Chinese economy, its largest trading partner, is a factor, as well as inflation in Australia, its growth rate and Trade Balance. Market sentiment – whether investors are taking on more risky assets (risk-on) or seeking safe-havens (risk-off) – is also a factor, with risk-on positive for AUD.
The Reserve Bank of Australia (RBA) influences the Australian Dollar (AUD) by setting the level of interest rates that Australian banks can lend to each other. This influences the level of interest rates in the economy as a whole. The main goal of the RBA is to maintain a stable inflation rate of 2-3% by adjusting interest rates up or down. Relatively high interest rates compared to other major central banks support the AUD, and the opposite for relatively low. The RBA can also use quantitative easing and tightening to influence credit conditions, with the former AUD-negative and the latter AUD-positive.
China is Australia’s largest trading partner so the health of the Chinese economy is a major influence on the value of the Australian Dollar (AUD). When the Chinese economy is doing well it purchases more raw materials, goods and services from Australia, lifting demand for the AUD, and pushing up its value. The opposite is the case when the Chinese economy is not growing as fast as expected. Positive or negative surprises in Chinese growth data, therefore, often have a direct impact on the Australian Dollar and its pairs.
Iron Ore is Australia’s largest export, accounting for $118 billion a year according to data from 2021, with China as its primary destination. The price of Iron Ore, therefore, can be a driver of the Australian Dollar. Generally, if the price of Iron Ore rises, AUD also goes up, as aggregate demand for the currency increases. The opposite is the case if the price of Iron Ore falls. Higher Iron Ore prices also tend to result in a greater likelihood of a positive Trade Balance for Australia, which is also positive of the AUD.
The Trade Balance, which is the difference between what a country earns from its exports versus what it pays for its imports, is another factor that can influence the value of the Australian Dollar. If Australia produces highly sought after exports, then its currency will gain in value purely from the surplus demand created from foreign buyers seeking to purchase its exports versus what it spends to purchase imports. Therefore, a positive net Trade Balance strengthens the AUD, with the opposite effect if the Trade Balance is negative.
추천 기사


