


Silver Price Forecast: Buyers stall near $70 after strong rally
- Silver trades near its highest level since mid-June after last week’s strong rally.
- A firmer US Dollar limits some of the upside as markets look ahead to key US data and Fed signals this week.
- XAG/USD retains a bullish technical bias above the 100-day MA, with the upper Bollinger band and 200-day MA in focus.
Silver (XAG/USD) is little changed on Monday, fluctuating between modest gains and losses near its highest level since mid-June, with buyers struggling to clear the $70 psychological mark.
At the time of writing, XAG/USD trades around $69.17, holding firm after last week’s strong rally, although Gold (XAU/USD) is outperforming the white metal at the start of the week, up nearly 1% on the day.
The US Dollar (USD) is also firmer on Monday, limiting some of Silver’s upside. Still, the broader backdrop remains supportive after the sharp rally in precious metals following the US Treasury’s buyback announcement and fading expectations of an imminent Federal Reserve rate hike. However, the interest rate outlook remains uncertain as tensions in the Middle East keep energy-driven inflation risks elevated.
Later this week, attention turns to key US data, with the Personal Consumption Expenditures (PCE) Price Index due on Wednesday, which could shape expectations for the Federal Reserve’s September policy meeting. Fed Chair Kevin Warsh’s speech at the Jackson Hole Symposium on Friday will also be closely watched for fresh signals on the interest-rate outlook.
Technical analysis
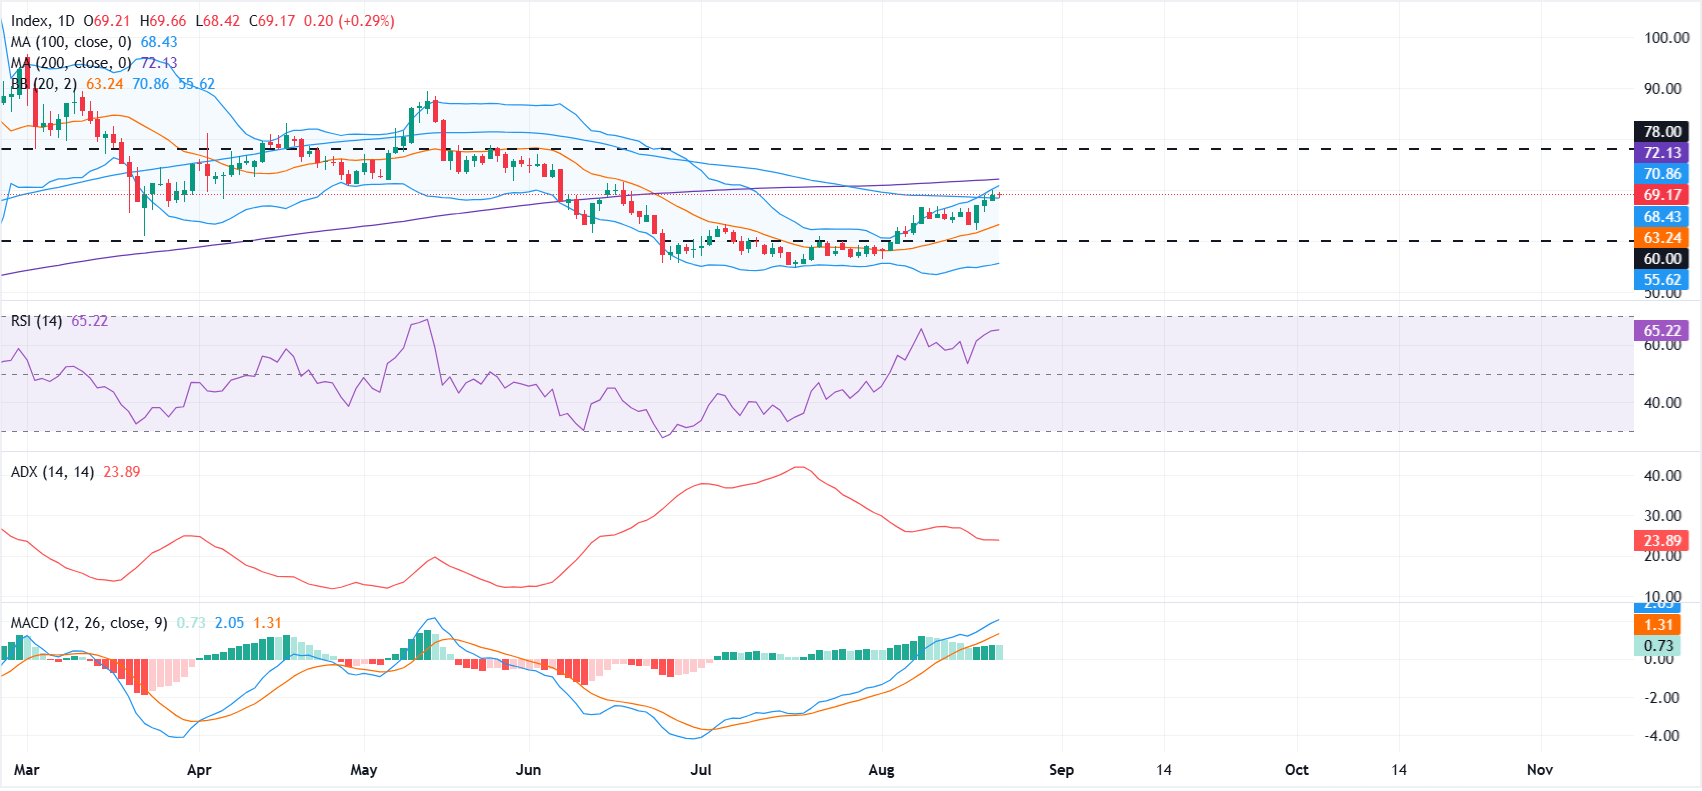
On the daily chart, XAG/USD retains a bullish near-term bias as price holds above the 100-day Moving Average (MA) at $68 and the Bollinger middle band at roughly $63.
The pair is advancing toward the upper Bollinger band at $70.86, while the 200-day MA at $72.13 looms as a next hurdle. Momentum remains constructive, with the Relative Strength Index (RSI) near 65 and the Moving Average Convergence Divergence (MACD) positive, although the Average Directional Index (ADX) around 24 hints at a moderate trend strength rather than an aggressive breakout.
On the topside, initial resistance aligns with the upper Bollinger band at $70, followed by the longer-term barrier at the 200-day MA near $72. On the downside, immediate support is seen at the 100-day MA around $68, ahead of secondary demand at the Bollinger middle band near $63, with the lower Bollinger band down at $55 marking a more distant structural floor should a deeper correction unfold.
(The technical analysis of this story was written with the help of an AI tool. Know more.)
US Dollar Price Today
The table below shows the percentage change of US Dollar (USD) against listed major currencies today. US Dollar was the strongest against the Canadian Dollar.
| USD | EUR | GBP | JPY | CAD | AUD | NZD | CHF | |
|---|---|---|---|---|---|---|---|---|
| USD | 0.13% | 0.08% | 0.08% | 0.60% | 0.14% | 0.28% | 0.18% | |
| EUR | -0.13% | -0.03% | 0.00% | 0.47% | 0.03% | 0.20% | 0.06% | |
| GBP | -0.08% | 0.03% | 0.04% | 0.52% | 0.06% | 0.25% | 0.10% | |
| JPY | -0.08% | 0.00% | -0.04% | 0.55% | -0.03% | 0.18% | 0.07% | |
| CAD | -0.60% | -0.47% | -0.52% | -0.55% | -0.53% | -0.26% | -0.41% | |
| AUD | -0.14% | -0.03% | -0.06% | 0.03% | 0.53% | 0.18% | 0.05% | |
| NZD | -0.28% | -0.20% | -0.25% | -0.18% | 0.26% | -0.18% | -0.14% | |
| CHF | -0.18% | -0.06% | -0.10% | -0.07% | 0.41% | -0.05% | 0.14% |
The heat map shows percentage changes of major currencies against each other. The base currency is picked from the left column, while the quote currency is picked from the top row. For example, if you pick the US Dollar from the left column and move along the horizontal line to the Japanese Yen, the percentage change displayed in the box will represent USD (base)/JPY (quote).
추천 기사


