


EUR/USD Price Forecast: Doubling US bond-buying plan opens way for 1.1800
- EUR/USD refreshes three-month high at around 1.1690 as the US Dollar underperforms.
- The US Treasury Department announces a significant increase in bond buyback volumes to curb higher financing costs.
- The ECB is expected to raise policy rates in the September meeting.
The Euro (EUR) posts a fresh three-month high at around 1.1693 against the US Dollar (USD) during the European trading session on Thursday. The major currency pair strengthens as the US Dollar takes a hit due to plunging United States (US) long-dated bond yields after the Treasury Department’s announcement that it will double down on its bond-buying operations to curb higher borrowing costs.
Strategists at Danske Bank note that EUR/USD “spiked higher” after the US Treasury announced an increase in buyback volumes of longer-dated Treasury bonds, a move that coincided with a flattening of the US yield curve. They highlight that the 10Y UST, at “4.64% currently, … is now 10bp below the peak on Tuesday,” and that the adjustment in US yields has “only partly spilled over to Europe, where the primary market has opened with plenty of SSA and covered bond deals.”
In the European session, the US Dollar Index (DXY), which tracks the Greenback’s value against six major currencies, extends its decline and posts a fresh 11-week low near 98.70.
US Dollar Price Today
The table below shows the percentage change of US Dollar (USD) against listed major currencies today. US Dollar was the weakest against the New Zealand Dollar.
| USD | EUR | GBP | JPY | CAD | AUD | NZD | CHF | |
|---|---|---|---|---|---|---|---|---|
| USD | -0.15% | -0.17% | 0.16% | -0.24% | -0.01% | -0.33% | 0.15% | |
| EUR | 0.15% | -0.02% | 0.30% | -0.08% | 0.13% | -0.19% | 0.30% | |
| GBP | 0.17% | 0.02% | 0.32% | -0.07% | 0.15% | -0.15% | 0.32% | |
| JPY | -0.16% | -0.30% | -0.32% | -0.40% | -0.17% | -0.50% | -0.01% | |
| CAD | 0.24% | 0.08% | 0.07% | 0.40% | 0.24% | -0.08% | 0.39% | |
| AUD | 0.01% | -0.13% | -0.15% | 0.17% | -0.24% | -0.31% | 0.16% | |
| NZD | 0.33% | 0.19% | 0.15% | 0.50% | 0.08% | 0.31% | 0.50% | |
| CHF | -0.15% | -0.30% | -0.32% | 0.01% | -0.39% | -0.16% | -0.50% |
The heat map shows percentage changes of major currencies against each other. The base currency is picked from the left column, while the quote currency is picked from the top row. For example, if you pick the US Dollar from the left column and move along the horizontal line to the Japanese Yen, the percentage change displayed in the box will represent USD (base)/JPY (quote).
On the Euro front, financial markets are confident that the European Central Bank (ECB) will raise interest rates at the September meeting. In contrast, the Federal Reserve (Fed) is expected to leave them steady in the same month.
EUR/USD Technical Analysis
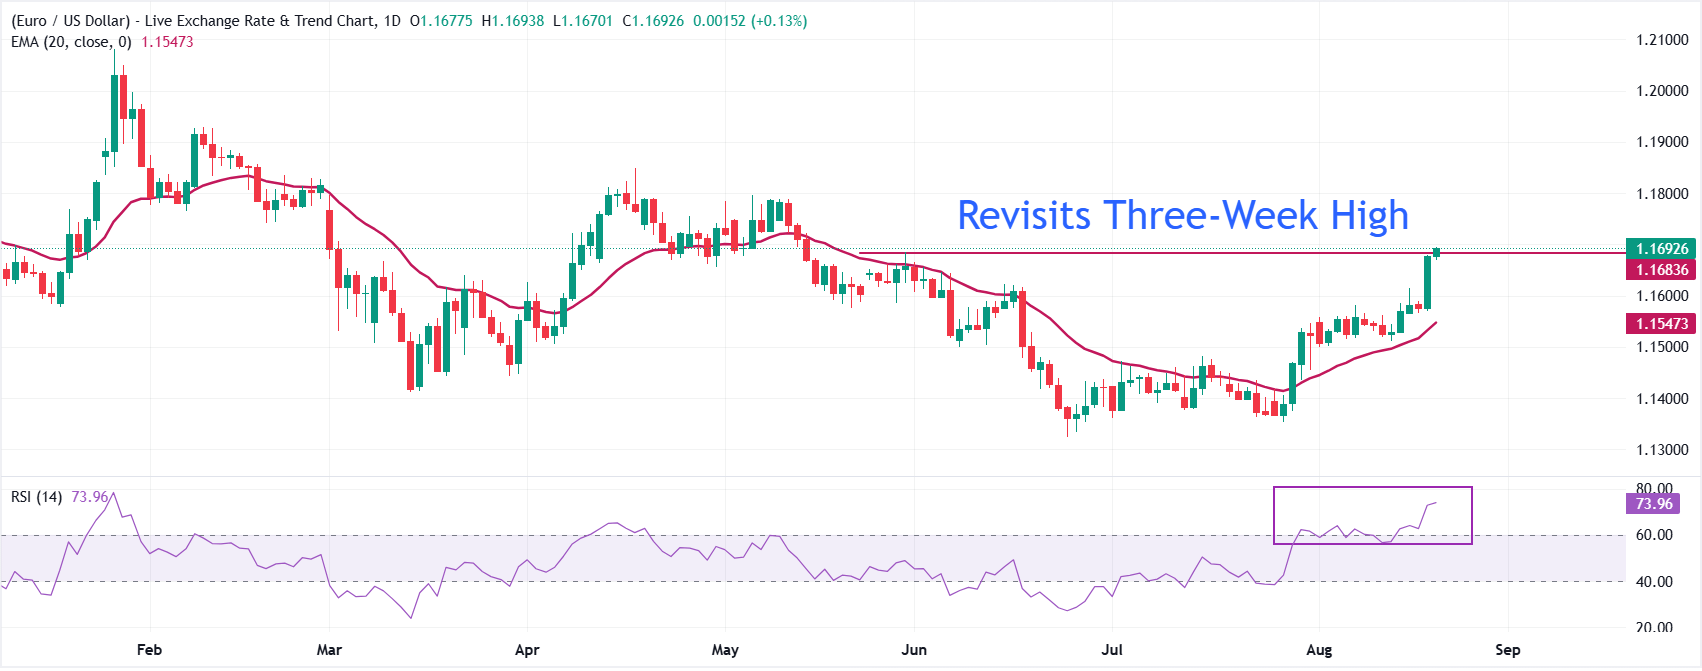
EUR/USD trades at 1.1693, extending its advance above the 20-period exponential moving average (EMA) at 1.1547. The pair’s position comfortably above this short-term trend indicator suggests a constructive near-term bias, though the Relative Strength Index (RSI) at 73.98 signals overbought conditions that could cap upside in the very short run.
On the downside, initial support is located at the 20-day EMA around 1.1547, where a pullback would likely be tested before any deeper correction unfolds. Looking up, the pair could advance towards May's high at around 1.1800 once it stabilizes above 1.1700.
Analysts at UOB Group are also constructive on the pair in the near-term horizon, recalling that they “turned positive on Monday (17 Aug, spot at 1.1570), indicating that ‘the price action suggests EUR is likely to trade with an upside bias.’” On Tuesday (18 Aug, spot at 1.1580), they maintained that “while the upside bias remains intact, given that there is no significant increase in upward momentum, EUR must break and hold above 1.1615 before a move to 1.1655 and beyond can be expected.” That condition was met yesterday as EUR “broke above 1.1615, as it rallied sharply to 1.1679,” with the pair closing “at a three-month high of 1.1677, up by 0.89%.”
UOB now judges that, “given the strong momentum, there is room for further upside in EUR toward 1.1725,” and will “maintain our positive EUR view as long as it stays above 1.1600 (‘strong support’ level previously at 1.1525).”
(The technical analysis of this story was written with the help of an AI tool. Know more.)
US Dollar FAQs
The US Dollar (USD) is the official currency of the United States of America, and the ‘de facto’ currency of a significant number of other countries where it is found in circulation alongside local notes. It is the most heavily traded currency in the world, accounting for over 88% of all global foreign exchange turnover, or an average of $6.6 trillion in transactions per day, according to data from 2022. Following the second world war, the USD took over from the British Pound as the world’s reserve currency. For most of its history, the US Dollar was backed by Gold, until the Bretton Woods Agreement in 1971 when the Gold Standard went away.
The most important single factor impacting on the value of the US Dollar is monetary policy, which is shaped by the Federal Reserve (Fed). The Fed has two mandates: to achieve price stability (control inflation) and foster full employment. Its primary tool to achieve these two goals is by adjusting interest rates. When prices are rising too quickly and inflation is above the Fed’s 2% target, the Fed will raise rates, which helps the USD value. When inflation falls below 2% or the Unemployment Rate is too high, the Fed may lower interest rates, which weighs on the Greenback.
In extreme situations, the Federal Reserve can also print more Dollars and enact quantitative easing (QE). QE is the process by which the Fed substantially increases the flow of credit in a stuck financial system. It is a non-standard policy measure used when credit has dried up because banks will not lend to each other (out of the fear of counterparty default). It is a last resort when simply lowering interest rates is unlikely to achieve the necessary result. It was the Fed’s weapon of choice to combat the credit crunch that occurred during the Great Financial Crisis in 2008. It involves the Fed printing more Dollars and using them to buy US government bonds predominantly from financial institutions. QE usually leads to a weaker US Dollar.
Quantitative tightening (QT) is the reverse process whereby the Federal Reserve stops buying bonds from financial institutions and does not reinvest the principal from the bonds it holds maturing in new purchases. It is usually positive for the US Dollar.
추천 기사


